

ABSTRACT
Chronic hepatitis C virus (HCV) infection is one of the leading causes of liver failure and liver cancer, affecting around 3% of the world's population. The extreme sequence variability of the virus resulting from error-prone replication has thwarted the discovery of a universal prophylactic vaccine. It is known that vigorous and multispecific cellular immune responses, involving both helper CD4+ and cytotoxic CD8+ T cells, are associated with the spontaneous clearance of acute HCV infection. Escape mutations in viral epitopes can, however, abrogate protective T-cell responses, leading to viral persistence and associated pathologies. Despite the propensity of the virus to mutate, there might still exist substitutions that incur a fitness cost. In this paper, we identify groups of coevolving residues within HCV nonstructural protein 3 (NS3) by analyzing diverse sequences of this protein using ideas from random matrix theory and associated methods. Our analyses indicate that one of these groups comprises a large percentage of residues for which HCV appears to resist multiple simultaneous substitutions. Targeting multiple residues in this group through vaccine-induced immune responses should either lead to viral recognition or elicit escape substitutions that compromise viral fitness. Our predictions are supported by published clinical data, which suggested that immune genotypes associated with spontaneous clearance of HCV preferentially recognized and targeted this vulnerable group of residues. Moreover, mapping the sites of this group onto the available protein structure provided insight into its functional significance. An epitope-based immunogen is proposed as an alternative to the NS3 epitopes in the peptide-based vaccine IC41.
IMPORTANCE Despite much experimental work on HCV, a thorough statistical study of the HCV sequences for the purpose of immunogen design was missing in the literature. Such a study is vital to identify epistatic couplings among residues that can provide useful insights for designing a potent vaccine. In this work, ideas from random matrix theory were applied to characterize the statistics of substitutions within the diverse publicly available sequences of the genotype 1a HCV NS3 protein, leading to a group of sites for which HCV appears to resist simultaneous substitutions possibly due to deleterious effect on viral fitness. Our analysis leads to completely novel immunogen designs for HCV. In addition, the NS3 epitopes used in the recently proposed peptide-based vaccine IC41 were analyzed in the context of our framework. Our analysis predicts that alternative NS3 epitopes may be worth exploring as they might be more efficacious.
INTRODUCTION
Hepatitis C virus (HCV) infects more than 170 million people globally, with another 3 million people newly infected each year (1). Approximately 20% of patients spontaneously clear the virus after a period of acute viremia, while the majority of patients develop chronic disease (2, 3). Chronic HCV infection leads to liver failure and liver cancer and is the leading cause of liver transplantations across the world. While no vaccine is yet available for HCV, patients are often treated with a therapy employing pegylated interferon (PEG-IFN) and ribavirin (4). But the therapy is prolonged, expensive (5), and genotype dependent (6), has limited efficacy, and is associated with extensive side effects (7). There has been much effort aimed at designing better drugs for the treatment of chronic patients, but a cheap and effective drug is yet to be discovered (8). Thus, there is need for a universal prophylactic HCV vaccine, and efforts toward this goal are under way (9).
The challenge before the design of an efficacious HCV vaccine is the extreme sequence variability of circulating viral strains due to a high mutation rate (approximately one nucleotide per replication cycle [10]). This, in combination with the high rate of viral turnover (∼1012 virions per day), results in a highly diverse circulating virus population, enabling the emergence of mutations that can aid viral escape from vaccine-induced immune responses (10).
The HCV proteome consists of 3,011 amino acids and is divided into three structural proteins (core, E1, and E2) and seven nonstructural (NS) proteins (p7, NS2, NS3, NS4A, NS4B, NS5A, and NS5B). Although neutralizing antibodies to the HCV envelope proteins have been discovered (11, 12), their role in viral clearance and persistence is not yet clear (9, 13). On the other hand, some reports indicate the importance of a T cell-based vaccine against HCV due to strong association of broadly directed immune responses involving both CD4+ and CD8+ T cells with viral clearance (13, 14). However, due to the high variability of HCV, point substitutions in T-cell epitopes can abrogate the associated response by interfering with presentation or recognition mechanisms (15, 16). This suggests that a vaccine should induce T-cell responses against HCV epitopes that are highly conserved, i.e., epitopes where the frequency of single substitutions is low within circulating viral strains, suggesting that such substitutions might compromise viral fitness. However, the virus might still escape the immune pressure on such epitopes through compensatory substitutions (17). Thus, as discussed in reference 18, an efficacious vaccine should prime T cells to target groups of coevolving residues wherein simultaneous substitutions have deleterious consequences with a greater likelihood, possibly due to the underlying structural or functional importance of such groups. If such multidimensionally conserved residues are targeted, the virus will either be recognized and subsequently eliminated or be forced to make multiple substitutions to avoid the resulting immune pressure which most likely would result in unfit viruses.
Although the core protein is the most highly conserved part of the viral proteome, experimental studies have shown that patients associated with spontaneous viral clearance (referred to as “HCV controllers” here) predominantly target the NS proteins (19–22). “IC41,” a therapeutic peptide vaccine being developed by Intercell AG, Austria, consists of five synthetic peptides derived from the core, NS3, and NS4B proteins of HCV genotype 1. These peptides are largely conserved across the highly prevalent HCV genotypes (1a, 1b, and 2). This vaccine, when used in combination with the standard therapy of PEG-IFN and ribavirin, has been shown to induce specific T-cell responses resulting in reduced relapse rates in chronic HCV patients (23). In this work, we focus on NS3, which is a bifunctional protein associated with serine protease activity and an additional helicase function. It plays an important role in the RNA replication of the virus and is therefore an attractive target for drug and vaccine design (24–28).
In an earlier work (29), one of our groups identified mutational vulnerabilities of HIV using various computational analyses of HIV sequences with potential applications in rational vaccine design. In another study (18), collectively evolving groups of HIV residues were identified by “cleaning” the mutational correlation matrix, computed from publicly available multiple sequence alignment (MSA) of HIV proteins, using ideas from random matrix theory (RMT). Such an approach was earlier applied in the context of finance (30, 31) to decouple intrinsic correlations in stock price fluctuations of companies from financial time series data, which are corrupted by sampling noise and extrinsic factors such as global recessions, bubbles, etc. By cleaning the correlation matrix using RMT, those studies found that companies grouped into independent “economic sectors” such that within a sector, stock price variations were highly correlated between companies. Within the realm of biology, a similar approach was proposed in reference 32, in which the authors analyzed the amino acid sequences of a serine protease to identify groups of coevolving residues termed “protein sectors.”
Despite many experimental studies undertaken to develop a potent HCV vaccine (references 9 and 33 and references therein), there has not been much effort invested in studying the sequences of HCV patients statistically for this purpose. In this paper, we study correlations between substitutions in circulating NS3 genotype 1a sequences available in public databases and identify sectors comprising coevolving residues that can guide the design of a HCV vaccine. We note that coevolution in HCV proteins has been studied previously in different contexts. For example, genome-wide association studies were carried out for predicting the outcome of the standard therapy (PEG-IFN and ribavirin) using a classical chi-square test (34) and Bayesian networks (35) and for identifying potential therapeutic targets using tools from network theory (36). Similarly, other works have also studied coevolving residues within specific proteins (E1, E2, and NS5A) for the purpose of predicting the standard therapy outcome (37–39). Here, in contrast, we focus specifically on the NS3 protein and on the application of designing a potential vaccine against HCV using ideas from RMT which enable us to study collective correlations in residues (not just pairs) (18). The statistical linkage analysis of the substitutions in NS3 reveals three sectors, one of which (sector 1) appears to be multidimensionally conserved and a promising target for vaccine design. The sites in sector 1 appear to have structural significance and also comprise a major portion of the epitopes that are targeted by the T-cell-mediated immune response within HCV controllers.
MATERIALS AND METHODS
Sequence data.
A MSA of HCV genotype 1a (prevalent in North America) was downloaded from the open-access Los Alamos National Laboratory database (40). We chose to focus on sequences corresponding to this particular genotype due to their relative abundance compared to the sequences of other genotypes, thus aiding statistical analyses. The nucleotide sequences were aligned based on the H77 (NC004102) reference sequence (http://www.genome.jp/dbget-bin/www_bget?refseq:NC_004102) and converted to amino acid sequences. A “blank” was assigned to all the ambiguous codons (including the insertions and deletions) and was considered the 21st amino acid.
Constructing the correlation matrix from the MSA.
Consider a MSA of a N-residue (site) protein with M sequences. The MSA was first converted into a binary code as follows (18, 32):
| (1) |
where denotes the binary letter at position i in a sequence s. The validity of this binary approximation of the MSA can be established by comparing the values of Shannon entropy per residue between the binary approximation and the case when all the 20 amino acids along with the blank are considered. The details are presented in the Appendix for NS3, and the binary approximation was found to be valid in this case (Fig. 1a).
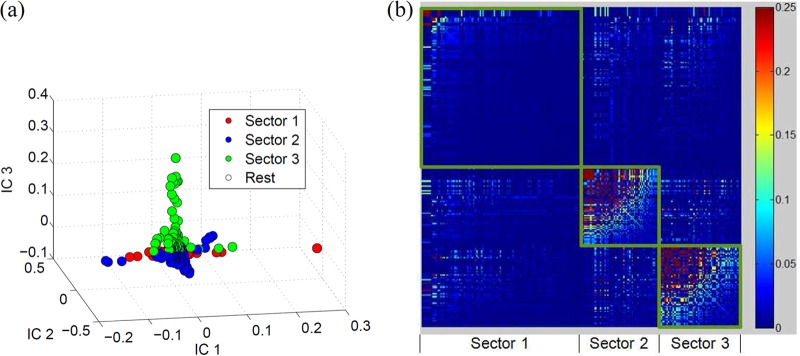
FIG 1.

(a) Comparison of the entropy for each site of NS3 in the binary representation (equation 9) with the entropy computed from the complete representation (equation 10). (b) Eigenvalue distribution of NS3 computed from the correlation matrix resulting from the actual alignment (upper panel) and randomized alignment (lower panel). (c) 3-D scatter plot of the loadings of the eigenvectors 1, 2, and 3 showing the three distinct sectors. (d) Heat map of the cleaned correlation matrix with rows and columns ordered according to the sites in the three sectors of NS3. The rows and the columns of the correlation matrix were arranged according to the sectors so that the sectors appear as squares in the heat map. The sites within each sector were further arranged in descending order with respect to their correlation values in the cleaned correlation matrix.
A sample correlation matrix C was constructed based on the binary MSA, with the (i,j)th entry, as follows:
| (2) |
where denotes the empirical average over all the sequences, fi is the relative frequency of substitution at site i, fij is the relative frequency of simultaneous substitutions at sites i and j, and Vi = fi(1 − fi) is the sample variance of substitution at site i.
Cleaning the sample correlation matrix.
Our objective is to find sites that coevolve due to intrinsic structural and functional constraints. The sample correlation matrix constructed using the available sequences is corrupted by the common ancestries of sequences (phylogeny) and statistical noise resulting from finite sample sizes (18, 32). Thus, it was necessary to “clean” the MSA with respect to this phylogenetic effect and statistical noise. The details of this cleaning procedure are discussed in the Appendix. Briefly, we can write the correlation matrix in terms of its eigenvalues as follows:
| (3) |
where λk is the kth eigenvalue of C and uk is the corresponding eigenvector. Any real, symmetric matrix can be decomposed in this manner. Correlations arising due to common ancestry (or phylogeny) were discarded by removing the maximum eigenvalue (λmax) and its effect on the data using a linear regression approach (18, 32). The contribution in C arising from statistical noise is removed by the application of RMT principles. RMT theorems specify the spectral properties of random-correlation matrices when both the number of variables (sites) and the number of observations (sequences) are large and comparable, under the null hypothesis that sites evolve independently. (Note that RMT theorems are also applicable to much more general models [e.g., including correlations] [41, 42] beyond the “pure noise” model.) Here we determined an upper bound on the maximum eigenvalue of the statistical noise (where superscript rnd stands for random) from the eigenvalue distribution of an ensemble of random matrices obtained by randomly shuffling the columns of the MSA. Thus, only the eigenvalues greater than represented the intrinsic correlations and all the remaining eigenvalues were removed (18, 32). Note that the P value associated with observing eigenvalues larger than was found to be very small (P = 6 × 10⁻⁴), lending a high degree of statistical confidence to our results. There are alternative RMT-based approaches present in the literature (see, for example, references 43 and 44) for cleaning the statistical noise. These approaches are discussed in the Appendix. It was found that the qualitative results remained the same regardless of the approach used.
The complete cleaning procedure can be summarized by rewriting the sample correlation matrix C (in equation 3) to show the separate spectral contributions resulting from phylogeny and statistical noise as follows:
| (4) |
where the first sum and the last term indicate statistical noise and phylogeny, respectively. Based on the above arguments, the cleaned correlation matrix is thus given as follows:
| (5) |
Definition of sectors.
Once the correlation matrix was cleaned to remove phylogeny and noise, the sectors were formed by studying the loadings (elements) of the eigenvectors corresponding to the eigenvalues in the range < λk < λmax. Let α be the total number of eigenvalues in this range. These eigenvalues were arranged in descending order, i.e., λ1′ > λ2′ > · · · > λα′, with the eigenvectors labeled accordingly. The sectors were formed based on the eigenvectors as follows:
| (6) |
for k = 1, 2, …, α, where |uk′(n)| is the absolute value of the nth element of uk′, and ε is a small positive constant that serves as a threshold. One may choose ε by examining the distribution of the loadings of the eigenvectors of random matrices. Alternatively, here we chose a small value, ε = 0.005, to include many sites in the sectors initially and later pruned them as discussed below. As these eigenvectors were found to be quite sparse, the sectors formed by selecting even such a small value of ε included at most only 40% of the sites.
The resulting sectors might have overlapping sites. This issue was solved by assigning the overlapping site to the sector with which it had the highest mean absolute correlation coefficient (based on the cleaned correlation matrix) (18). Within the binary approximation, a pair of sites can be positively correlated or negatively correlated or uncorrelated. A positive correlation implies that the double substitution occurs at a frequency higher than the frequency that would be expected if the sites had mutated independently. Thus, a positive correlation between sites can correspond to “compensatory interactions” between the sites. In contrast, a negative correlation between two sites implies that the frequency of the double substitution is lower than the frequency that would be expected if the single substitutions were independent, suggesting that such a double substitution is likely to be deleterious for viral fitness. The high mutability of viruses like HCV enables the emergence of mutations that can lead to immune escape; thus, one would like to design a vaccine that targets groups of sites where multiple substitutions that are needed to escape the T-cell response are likely to be deleterious for viral fitness. The depletion of multiple simultaneous substitutions in data sets of circulating sequences would result in negative correlations among the participating sites as identified by our analysis. Furthermore, an efficacious vaccine should also avoid targeting sites where multiple simultaneous substitutions are beneficial for viral fitness—such sites would be expected to exhibit positive correlations in sequence data (18). In order to identify statistically significant positively and negatively correlated pairs of sites, we used the following convention:
| (7) |
where is the (i,j)th element of , and the thresholds δ+ and δ− were obtained from the ensemble of random-correlation matrices constructed by shuffling the columns of the MSA as described previously. Specifically, these thresholds were chosen such that the correlation coefficients with magnitude larger than δ+ and smaller than δ− arose with a very low probability, P = 10−2, in the random matrices. The sites in each sector that did not show any correlation larger (smaller) than the positive (negative) threshold δ+ (δ−) with any of the other sites in that sector were discarded. In addition to this approach to form sectors, two alternative methods motivated by references 32 and 45 were studied and are reported in the Appendix. These methods yielded approximately the same sectors.
Definition of statistical significance.
The statistical significance of the results in this work is quantified using a P value, which is the probability of observing a result as extreme as or more extreme than the one being studied, assuming a null hypothesis were true. For example, assume that there are y sites that are biologically or clinically important (e.g., sites on a binding interface). Suppose we wished to estimate the statistical significance of a result derived from our RMT analysis, where a sector of n sites also includes x sites that are a subset of the y sites. Here, the null hypothesis would be that the n sites of this sector arose from a random selection from the N sites of the protein. Assuming that the null hypothesis is true, the P value is the probability that the sector would include at least x of the y important sites and is calculated as follows:
Thus, low P values would indicate that the null hypothesis is untenable and that it is unlikely that our result could arise from chance. Following conventional practice, we rejected the null hypothesis and considered the result statistically significant when P < 0.05.
RESULTS
Sequence analysis reveals three sectors of collectively evolving sites in NS3.
NS3 is a 631-residue protein, large portions of which are well conserved in circulating sequences. We obtained 2,814 sequences of NS3 HCV genotype 1a (H77 reference sequence positions 1027 to 1657) (throughout the paper, all the residues are numbered according to the H77 reference sequence; the position of a residue within the NS3 protein [xNS3] can be easily obtained from the H77 reference sequence position [xH77] as follows: xNS3 = xH77 − 1,026) from the HCV Los Alamos database (the accession numbers of these sequences are listed in Dataset S1 in the supplemental material). Preprocessing steps indicated that all sites in NS3 had fewer than 7% blanks, suggesting that sequencing ambiguities were not highly prevalent. The consensus sequence of the resulting MSA differed from the H77 reference sequence at six sites (1046, 1117, 1179, 1274, 1358, and 1436). It is important to mention that no substitutions were observed in 156/631 (∼24%) sites in NS3; i.e., they were 100% conserved. Columns and rows of the correlation matrix corresponding to such sites were undefined, and therefore we excluded them from our initial sectoring analysis. The correlation matrix C was constructed using the frequencies of single substitutions at sites and the frequency of double substitutions at pairs of sites from the sequence information at the remaining N* = 475 sites, according to equation 2. Figure 1a shows the validity of the binary approximation of MSA. It can be seen that for a majority of the NS3 sites, the Shannon entropy computed in the binary representation of the MSA agrees well with that computed in the full amino acid representation.
The distribution of eigenvalues (spectrum) of C is shown in Fig. 1b (upper panel). The average eigenvalue distribution of correlation matrices computed from 1,000 randomized alignments is shown in Fig. 1b (lower panel). It is evident that the eigenvalue distribution of the actual alignment is quite similar to the randomized one except for a few large eigenvalues. The presence of eigenvalues λk < in the randomized matrix spectra suggests that these arise from statistical noise, and they were thus discarded (18, 32). The eigenvector corresponding to the maximum eigenvalue was coherent (consisted of a large fraction of elements with the same sign) and thus was deemed to be associated with the phylogenetic couplings (18, 31, 32). Excluding the phylogenetic (maximum) eigenvalue and its effect on the data using a simple linear regression approach (18, 31, 32), there remained α = 9 eigenvalues greater than , presumably representing intrinsic correlations.
Once the correlation matrix was “cleaned” of phylogeny and noise, the sectors were formed based on the α = 9 eigenvectors according to equation 6. The sectors were then trimmed using the threshold values δ+ = 0.08 and δ− = −0.024, as described in equation 7. The q-value, i.e., the probability of false discoveries in a set of patterns deemed significant by a statistical test (46), associated with the P value of 0.01 (used to obtain the thresholds in equation 7) was found to be 2.066 × 10⁻⁶. Using the thresholds in equation 7, we found a total of 4,076 significant correlations (including both positive and negative correlations). Thus, this q-value indicates that of the 4,076 significant correlations, the false discoveries are expected to be even less than one pair (q = 0.0084). Three distinct sectors comprising coevolving sites were determined in the NS3 protein. Sectors were defined as in equation 6 with k = 1, 2, and 3. Figure 1c shows a three-dimensional (3-D) scatter plot of the loadings of the eigenvectors in which the three sectors are clearly visible. A heat map of the cleaned correlation matrix is also presented in Fig. 1d. The numbers of sites in sectors 1, 2, and 3 were 135, 57, and 83, respectively. The list of sites in each sector is given in Table S1 in the supplemental material.
Statistical analysis of the NS3 sectors indicates sector 1 to be multidimensionally conserved.
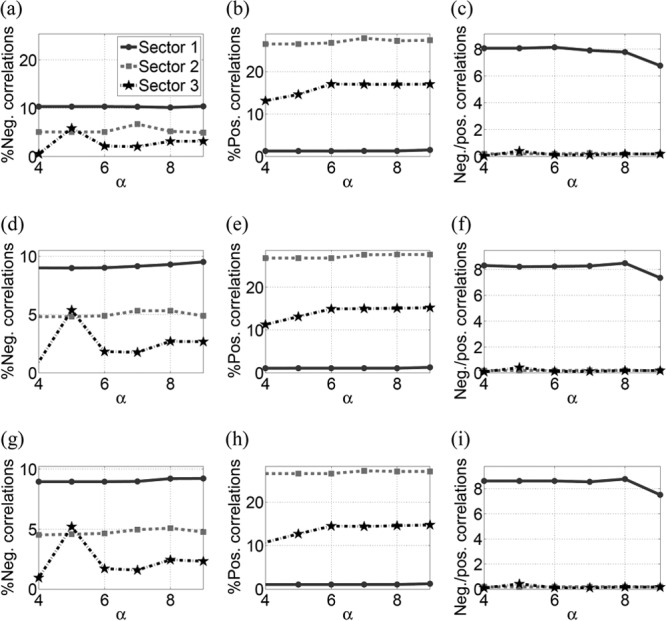
Figure 2 presents the statistics of conservation and correlation within the three sectors of NS3. Figure 2a shows that the mean conservation (1 − fi) in all the sectors was high (>96%). Analyzing the correlations in the sectors revealed around 10% pairs of sites with negative correlations in sector 1 (according to the definition in equation 7), while these percentages for sector 2 and sector 3 were around 5% and 3%, respectively (Fig. 2b). Furthermore, sector 1 had a much higher ratio of negative to positive correlations than sectors 2 and 3 (Fig. 2c and d), suggesting that a greater proportion of combinations of substitutions in sector 1 were likely to be deleterious and that fewer were likely to be compensatory in nature. This is in contrast with the characteristics of sectors 2 and 3. Taken together, these results suggest that sector 1 consists of multidimensionally conserved sites, predicting that a putative vaccine which focuses the immune response on this region of the proteome might restrict potential escape routes for the virus and force the emergence of escape mutations that are likely to be deleterious for viral fitness. The statistics of correlations in different sectors remained robust with respect to variations in the thresholds in equation 7 as shown in Fig. 3.
FIG 2.
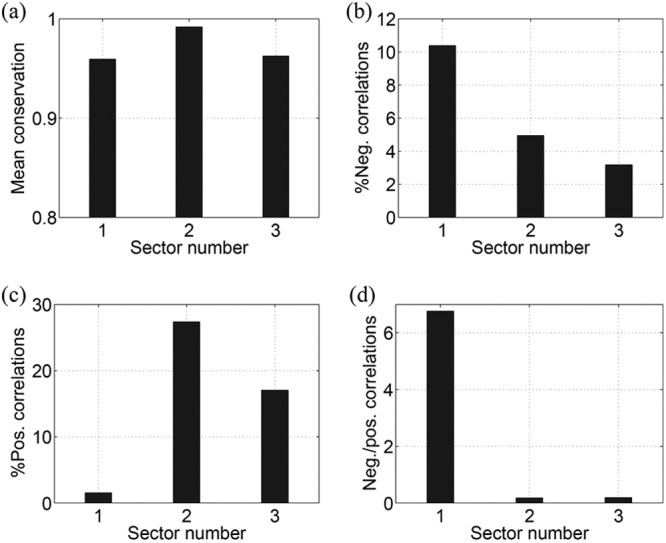
Statistics of the mutational correlations in NS3 sectors. (a) The mean of single-site conservation. (b) The percentage of negative correlations. (c) The percentage of positive correlations. (d) The ratio of negative to positive correlations.
FIG 3.
Statistics of the three sectors of NS3 when the positive and negative thresholds (δ+ and δ−) in equation 7 are decreased by 50% (a to c) and increased by 50% (d to f). This figure demonstrates the robustness of the correlations in the sectors to the variations in the thresholds given in equation 7.
A large proportion of the sites in the protease-helicase and the helicase-helicase interfaces of NS3 are part of sector 1.
NS3 is a bifunctional enzyme with serine protease and helicase activities (2). Recently, it was found that 10 sites located at the interface between the protease and the helicase domains were critical for protease activity via an allosteric mechanism (47). Three sites (30%) of this protease-helicase interface of NS3 were present in sector 1 (Fig. 4a). Moreover, the protein interface region formed between the two NS3 helicase molecules was reported to be important for the helicase activity and viral replication (48). A large number of sites (17 of 44 [∼39%] sites in chain A and 4 of 17 [∼24%] sites in chain B) in the NS3 dimer interface were part of sector 1 (Fig. 4b). Two sector 1 sites (1552 of chain A and 1616 of chain B) in the interface were especially interesting as they appeared to be interacting with each other (distance < 7.5 Å) in the multiprotein X-ray crystal structure. Although the presence of three sector 1 sites in the protease-helicase interface was not statistically significant (due to the large size of sector 1), those present in the helicase-helicase interface were found to be statistically significant (P < 0.05).
FIG 4.
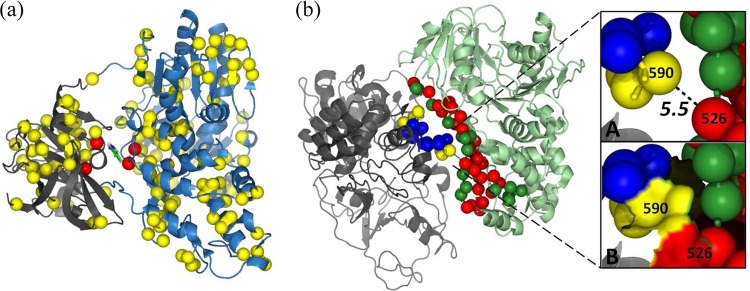
Structural significance of the sites in sector 1 of NS3. (a) Sites of sector 1 in the allosteric pocket at the interface of the protease (gray) and the helicase (blue) domains of NS3 protein (PDB code 4B6E) are shown as red spheres. Only the C-α atoms of all the sites are shown for clean presentation. All the remaining sites in sector 1 are also shown in the figure as yellow spheres. (b) C-α atoms of the sites at the interface between NS3 helicase chains A (pale green) and B (gray) in the dimer structure (PDB code 2F55) are shown as dark green and blue spheres, respectively. The interface sites of chain A and chain B present in sector 1 are shown as red and yellow spheres, respectively. The main chain of all the interface sites is also shown as sticks. Site 526NS3 (1552H77) of chain A and site 590NS3 (1616H77) of chain B, which were part of sector 1, were of particular importance because they seemed to be interacting with each other, as the distance between these two sites was 5.5 Å (inset A) and the surfaces of these two sites appeared to be attached to each other (inset B).
As mentioned before, the downloaded NS3 MSA had a good proportion (24.7%) of 100% conserved sites (i.e., sites with fi = 0). The sectors, which were defined based on the nonzero mutational correlations, did not feature these sites. But their complete conservation in the MSA suggests that substitutions in these sites would most likely be deleterious to viral fitness. Based on analysis of the 3-D structure of the NS3 protein (PDB code 4B6E), we therefore supplemented the sectors with neighboring sites, if the latter were completely conserved. Two sites were considered neighbors if the distance between their C-α locations was less than 7.5 Å (49, 50). The number of sites in the three sectors increased to 265, 116, and 149, respectively. The helicase-helicase interface consisted of 15 (∼24%) such sites. The number of sector 1 sites in the interface increased after this modification (28 of 44 [∼64%] sites in chain A and 6 of 17 [∼35%] sites in chain B), and the results became highly significant (P < 0.01).
Preponderance of sector 1 sites in the NS3 epitopes targeted by HCV controllers.
Clinical studies of HCV-infected cohorts have shown that possession of specific HLA alleles is highly correlated with the ability to spontaneously clear HCV by immune-mediated mechanisms (24, 51–55). In this work, we studied two classes of protective epitopes to validate our findings. One set of epitopes was allele restricted, as some specific HLA class I and class II alleles have been linked to spontaneous clearance of HCV (24, 51–55). We refer to these epitopes as “allele-restricted protective epitopes.” The other set consisted only of protective CD4+ T-cell epitopes that are presented by promiscuous HLA-DR alleles (20). We considered these epitopes separately as they were found to be immunogenic in HCV controllers with multiple HLA-DR alleles (20). We refer to them as “allele-independent protective epitopes.” Interestingly, it has been found recently that the elite controllers of HIV are also able to keep HCV under control (56, 57). Specifically, the HLA-B27 and HLA-B57 alleles, which are highly enriched in HIV controllers, were associated with spontaneous clearance of HCV as well.
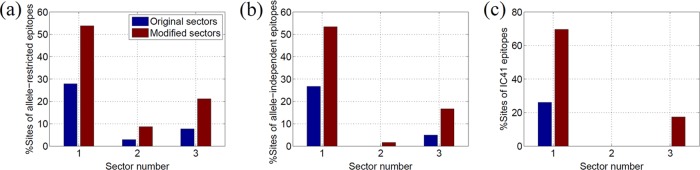
For the allele-restricted protective epitopes, we studied the CD4+ and CD8+ T-cell epitopes recognized by the six specific HLA alleles (HLA-A11, HLA-B27, HLA-B57, HLA-DR1, HLA-DR4, and HLA-DR11) that were found to have a strong association with spontaneous elimination of HCV in several independent studies (24, 51–55). The list of NS3-specific epitopes used in this analysis is given in Table S2 in the supplemental material and was compiled using the data from the Immune Epitope Database and Analysis Resource (http://www.iedb.org/) (58). Figure 5a shows (in blue) the percentages of sites of these specific allele-restricted epitopes present in the three sectors of NS3. It can be seen that 27% of the sites present in these epitopes were in sector 1 and 9% in sector 3. In these allele-restricted T-cell epitopes, ∼25% of the sites corresponded to 100% conserved sites in the MSA. Figure 5a shows (in brown) the percentage of sites of these epitopes present in the modified sectors (obtained by incorporating the neighboring 100% conserved sites). It is interesting that after this modification, the percentage of sites of these epitopes in sector 1 increased to 54% whereas that of sector 3 increased only to 25%. The results were highly statistically significant (P < 0.01) for sector 1, while those for the other two sectors were found to be nonsignificant. This enhanced targeting of sector 1 within HCV controllers indicates that the spontaneous viral clearance is linked with the targeting of both the 100% conserved and the multidimensionally conserved sites of sector 1.
FIG 5.

(a) Percentage of sites in the NS3-specific allele-restricted protective epitopes present in the original sectors and the modified sectors obtained by incorporating the neighboring 100% conserved sites. This percentage was calculated as Nes/Ne × 100, where Nes is the number of sites in the epitopes that were present in the sector and Ne is the total number of sites in the epitopes. (b) Percentage of sites in the NS3-specific allele-independent protective epitopes present in the original sectors and the modified sectors. (c) Percentage of sites in the NS3-specific IC41 epitopes present in the original sectors and the modified sectors. (d) Percentage of sites of allele-restricted protective epitopes, allele-independent protective epitopes, and IC41 epitopes in modified sector 1.
The set of allele-independent protective NS3-specific epitopes was obtained from reference 20 and is listed in Table S3 in the supplemental material. Figure 5b shows (in blue) the fraction of sites in these epitopes that fall within the three NS3 sectors. A total of 27% of these epitopes are present in sector 1, while 5% are present in sector 3. Figure 5b shows (in brown) that this percentage for sector 1 increased to 53% when 100% conserved sites were incorporated (P < 0.05). This further demonstrates the importance of sector 1 for T-cell-mediated immune control.
The therapeutic IC41 vaccine, proposed in reference 23, consists of two NS3-specific epitopes (listed in Table S4 in the supplemental material). Although these two epitopes were selected based on their high conservation across HCV genotypes (23), they consisted of only 22.2% and 57.1%, respectively, of the 100% conserved sites. A total of 26% of the sites in these epitopes fell in sector 1, while sectors 2 and 3 did not have any sites in common with these IC41 epitopes (Fig. 5c). This proportion of sector 1 sites increased to ∼70% (P < 0.01) after incorporating the 100% conserved sites, while the percentages of sectors 2 and 3 remained modest. This indicates that a significantly large proportion of the sites in the NS3-specific epitopes of the IC41 vaccine are part of sector 1.
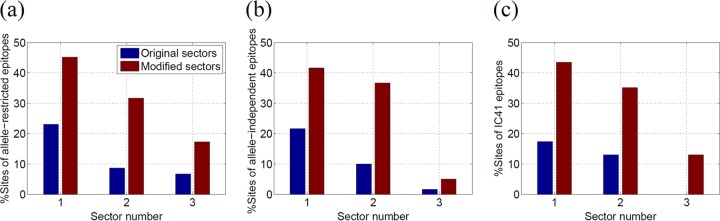
Figure 5d shows the percentage of sites of each NS3 epitope in the modified sector 1 of NS3 (including the 100% conserved sites). This statistic is shown only for sector 1 as it was considered to be important for HCV vaccine design in this work. It can be seen that, except for two allele-restricted epitopes (that included two CD4+ epitopes [no. 1 and no. 9] listed in Table S3 in the supplemental material), sector 1 contained at least 35% of the sites of each epitope.
Immunogen design.
Our results suggest that the multidimensionally conserved sector 1 of NS3 might be a promising target for a potential HCV vaccine. To design a vaccine that primes the immune response to this sector, it is important that the immunogen contains T-cell epitopes that are processed and presented by the HLA class I and class II molecules prevalent in the target population receiving the vaccine. Since our analysis has focused on HCV genotype 1a, which predominates in North America, we propose an immunogen for subjects with a European American ancestry as a case study. The frequency of HLA haplotypes in this target population has been described in reference 59. As clinical studies have shown that HCV controllers use both the CD4+ and CD8+ T cells to combat infection (13, 14), HLA allele frequency data of the five common loci (A, C, B, DRB1, and DQB1), consisting of both HLA class I and II molecules (presented in reference 59), were utilized. We focused on the 25 most frequent haplotypes, with a cumulative frequency of ∼34% across the population. We compiled a list of epitopes (see Table S5 in the supplemental material) presented by the individual alleles within these haplotypes using the data from reference 58. A worst-case approach was pursued; i.e., it was assumed that a single substitution in the epitope can eliminate epitope presentation or abrogate recognition by T cells, resulting in immune escape (15, 16). Moreover, we included from the database only epitopes that were exclusively comprised of wild-type residues. A total of 32 distinct CD4+ and CD8+ epitopes within NS3 were identified for the 25 haplotypes we chose to focus on. For immunogen candidates, we evaluated combinations of 5 epitopes from the 32 epitopes. We propose two immunogen designs that optimize two different objectives. The first design focuses on maximizing the potency of the immunogen, while the second one emphasizes on minimizing the possibility of escape. The details of the two designs are as follows.
For an efficacious immune response that is likely to establish viral control, one would like to prime the immune system against a combination of epitopes that is enriched in sites where a large proportion of combinations of substitutions (necessary for escaping the immune response) is unlikely to be tolerated by the virus. We would thus like to maximize the proportion of 100% conserved and negatively correlated pairs of residues. At the same time, we would like to minimize the possibility of escape paths; this would imply that we must minimize the proportion of positively correlated and uncorrelated pairs. This design objective can be represented mathematically as follows:
| (8) |
where PCP represents the percentage of the residue pairs in the immunogen that are 100% conserved (PCP includes all pairs with at least one conserved site), PNCP represents the percentage of pair correlations in the immunogen that are negative, PPCP represents the percentage of pair correlations in the immunogen that are positive, and PUCP represents the percentage of uncorrelated residue pairs in the immunogen.
Thus, the combination that maximizes L is the one with the highest PCP and PNCP and with the lowest PPCP and PUCP. These quantities were calculated using all the residue pairs within the combination of 5 epitopes, including interepitope pairs. The score thus reflects possible synergistic/antagonistic effects between multiple epitopes. The 10 NS3-specific epitope combinations with the largest L scores, which are also presented by the 25 major haplotypes within the European American population, are listed in Table 1. The combinations have been ordered with respect to “double coverage” (DCov), which is the frequency of the haplotypes (of the 25 most frequent ones) that present at least 2 epitopes from the combination. The “coverage” (Cov) of each combination (the frequency of the haplotypes that present at least 1 epitope of the combination) and the corresponding L score are also listed.
TABLE 1.
List of 10 combinations of NS3-specific 5-epitope-based vaccine which had highest values of L scores using the first proposed immunogen design (equation 8) for the European-American population in the United Statesa
| Combination | H77 reference sequence location |
L | Cov | DCov | ||||
|---|---|---|---|---|---|---|---|---|
| Epitope 1 | Epitope 2 | Epitope 3 | Epitope 4 | Epitope 5 | ||||
| 1 | 1251–1259 | 1292–1300 | 1436–1444 | 1585–1594 | 1585–1595 | 63.58 | 0.71 | 0.50 |
| 2 | 1123–1131 | 1169–1177 | 1251–1259 | 1292–1300 | 1436–1444 | 61.62 | 0.66 | 0.44 |
| 3 | 1123–1131 | 1175–1183 | 1251–1259 | 1359–1367 | 1436–1444 | 61.62 | 0.70 | 0.37 |
| 4 | 1123–1131 | 1175–1183 | 1251–1259 | 1292–1300 | 1436–1444 | 65.45 | 0.66 | 0.37 |
| 5 | 1169–1177 | 1175–1183 | 1251–1259 | 1292–1300 | 1436–1444 | 64.46 | 0.66 | 0.34 |
| 6 | 1123–1131 | 1251–1259 | 1292–1300 | 1359–1367 | 1436–1444 | 65.45 | 0.52 | 0.30 |
| 7 | 1251–1259 | 1292–1300 | 1436–1444 | 1540–1550 | 1541–1550 | 61.31 | 0.71 | 0.18 |
| 8 | 1169–1177 | 1251–1259 | 1292–1300 | 1359–1367 | 1436–1444 | 61.62 | 0.72 | 0.14 |
| 9 | 1175–1183 | 1251–1259 | 1292–1300 | 1359–1367 | 1436–1444 | 65.45 | 0.72 | 0.07 |
| 10 | 1123–1131 | 1175–1183 | 1251–1259 | 1292–1300 | 1359–1367 | 61.62 | 0.72 | 0.07 |
The combinations are ordered according to their double coverage (DCov), the values of which are shown in bold. The HLA class II epitopes are underlined to differentiate them from the HLA class I epitopes.
Although the immunogen obtained using this design seeks to attack the virus on 100% and multidimensionally conserved sites and is anticipated to be effective in reducing the viral load, the virus can still potentially escape the immune pressure in the long run by substitution if there is even a single positively correlated or uncorrelated pair within these epitopes. The escaping viral strain would be viable and would eventually dominate the quasispecies. Thus, our second proposed immunogen design focuses on avoiding such scenarios. In this immunogen design, we selected the epitopes in such a way that the escaping viral strains have minimal fitness. We made an assumption that the fitness of the viral strains that escape by means of double substitutions in positively correlated pairs should be higher than the fitness of those that escape through double substitutions in uncorrelated or negatively correlated pairs. This is because positive correlation between sites might entail compensatory interactions that could restore the fitness cost of a single escape mutation (see Materials and Methods). Moreover, as negative correlations most likely are deleterious for virus, we assumed the fitness of viral strains that escape through double substitutions on uncorrelated pairs to be higher than the fitness of the ones that escape using negatively correlated pairs. A general iterative procedure to obtain an immunogen that focuses specifically on minimizing the possibility of escape is presented in Fig. 6. A brief summary of the procedure is as follows.
FIG 6.

Flowchart of the second immunogen design that minimizes the fitness of the escaping viral strains. The path followed by the 10 selected combinations of epitopes that minimize the potential escape paths in the case of NS3 is shown by the dotted line.
We start by considering the set of all possible combinations of 5 epitopes and obtain the best single combination of epitopes with minimal escaping fitness (or maximizing the fitness cost needed to escape) as an output. The selection is done stepwise according to the fitness ranking discussed above. In the case of the best combination having nonzero PPCP or PUCP within the epitopes, the PPCP as well as PUCP of the sites in these pairs with all the remaining sites in the protein is minimized. This minimizes the possibility of escape paths involving substitutions outside the epitopes considered. The best combination after every iteration is selected, and the whole process is repeated for the remaining combinations until a desired number of combinations is achieved. In our case, there were approximately 1,000 combinations of 5 epitopes (0.5% of the total combinations) that had zero PPCP within the epitopes. Of these, there were 21 combinations (0.01% of the total combinations) that had zero PPCP with all the remaining sites in the protein. As the PUCP of these combinations with all the sites in the protein was nonzero, we selected the top 10 combinations with minimum PUCP with all the sites in the protein. The path followed by these selected combinations is shown by a dotted line in Fig. 6. These combinations are presented in Table 2 ordered with respect to the double coverage (DCov). It is encouraging that there were some common epitopes in the top combinations obtained using both immunogen designs. These combinations can be combined to form a potentially potent epitope-based immunogen for HCV.
TABLE 2.
List of 10 combinations of NS3-specific 5-epitope-based vaccine that were obtained using the second immunogen design for the European-American population in the United Statesa
| Combination | H77 reference sequence location |
Cov | DCov | ||||
|---|---|---|---|---|---|---|---|
| Epitope 1 | Epitope 2 | Epitope 3 | Epitope 4 | Epitope 5 | |||
| 1 | 1123–1131 | 1131–1139 | 1248–1261 | 1250–1264 | 1541–1550 | 1.00 | 0.46 |
| 2 | 1123–1131 | 1131–1139 | 1250–1264 | 1251–1259 | 1541–1550 | 1.00 | 0.45 |
| 3 | 1123–1131 | 1131–1139 | 1243–1252 | 1248–1261 | 1250–1264 | 0.90 | 0.38 |
| 4 | 1123–1131 | 1131–1139 | 1243–1252 | 1250–1264 | 1251–1259 | 0.90 | 0.38 |
| 5 | 1123–1131 | 1248–1261 | 1250–1264 | 1251–1259 | 1541–1550 | 0.94 | 0.37 |
| 6 | 1123–1131 | 1243–1252 | 1248–1261 | 1250–1264 | 1541–1550 | 0.95 | 0.37 |
| 7 | 1123–1131 | 1243–1252 | 1250–1264 | 1251–1259 | 1541–1550 | 0.95 | 0.37 |
| 8 | 1123–1131 | 1131–1139 | 1248–1261 | 1250–1264 | 1251–1259 | 0.90 | 0.36 |
| 9 | 1123–1131 | 1243–1252 | 1248–1261 | 1250–1264 | 1251–1259 | 0.86 | 0.23 |
| 10 | 1123–1131 | 1131–1139 | 1243–1252 | 1248–1261 | 1251–1259 | 0.65 | 0.18 |
The combinations are ordered according to their double coverage (DCov), the values of which are shown in bold. The HLA class II epitopes are underlined to differentiate them from the HLA class I epitopes.
Notably, a majority of the sites (∼58%) in the top 10 combinations (using both designs) were part of sector 1 (P < 0.01). The immunogens were designed to maximize the negatively correlated pairs and minimize the presence of positively correlated pairs. Thus, the preponderance of sector 1 sites in the vaccine combinations further validates the utility of the RMT-based approach as a systematic way to extract groups of collectively coevolving sites that might serve as good vaccine targets.
While the 32 epitopes under consideration contained the 2 NS3 epitopes targeted by the peptide-based IC41 vaccine, neither of these appeared in the top 10 combinations using the first immunogen design (Table 1), while one CD4+ epitope (amino acids 1248 to 1261) appeared in the top 10 combinations obtained using the second immunogen design (Table 2). This was not surprising as the selection criterion of the epitopes in IC41 was different from ours. In IC41, epitopes enriched with sites that exhibit high conservation across genotypes were selected. Focusing on high average single-site conservation assumes that the sites evolve independently and ignores correlations between substitution probabilities at different sites. Although single-site substitutions can incur a fitness cost, compensatory substitutions can often restore viral fitness (17). In our proposed immunogen designs, we take into consideration such collective constraints between substitutions at different sites elucidated by an RMT-based analysis and propose that an efficacious vaccine must target multidimensionally conserved sites along with the individual sites with high conservation. The highest rank of a combination consisting of both NS3 epitopes present in IC41 was 448 in the first immunogen design, whereas no combination consisting of both these epitopes was selected in the second immunogen design. The complete procedure was repeated for a 2-NS3-epitope-based immunogen (as opposed to 5 epitopes) to investigate the possibility that the two IC41 epitopes might arise as the best candidate. Table 3 lists the top 10 combinations for this case. The rank of this combination was 71 using the first immunogen design whereas the combination was not obtained in the second immunogen design. However, the CD4+ epitope (1248 to 1261) of IC41 appears in the top combinations of epitopes obtained using both immunogen designs. We also calculated the percentage of conservation across all the genotypes (PCAG) for the top combinations of both immunogen designs (all the NS3 sequences present in reference 40 were used to calculate this statistic). It is interesting that the majority of the top 10 combinations (8 of 10 in the first immunogen design and all in the second immunogen design) that were obtained from our analysis (based on NS3 genotype 1a only) also had a high percentage of conservation across all genotypes compared to that of the IC41 epitopes. This result indicates that there might be better alternatives (as many combinations were common in both the immunogen designs) for a vaccine based on the combination of two NS3 epitopes.
TABLE 3.
List of 10 combinations of NS3-specific 2-epitope-based vaccine for the European-American population in the United States using both immunogen designsa
| Combination | First immunogen design |
Second immunogen design |
|||||
|---|---|---|---|---|---|---|---|
| H77 reference sequence location |
L | PCAG | H77 reference sequence location |
PCAG | |||
| Epitope 1 | Epitope 2 | Epitope 1 | Epitope 2 | ||||
| 1 | 1251–1259 | 1292–1300 | 86.93 | 99.87 | 1248–1261 | 1251–1259 | 99.65 |
| 2 | 1251–1259 | 1436–1444 | 86.93 | 97.63 | 1250–1264 | 1251–1259 | 99.37 |
| 3 | 1123–1131 | 1251–1259 | 80.39 | 98.78 | 1248–1261 | 1250–1264 | 99.24 |
| 4 | 1175–1183 | 1251–1259 | 80.39 | 98.43 | 1131–1139 | 1250–1264 | 98.79 |
| 5 | 1251–1259 | 1359–1367 | 80.39 | 98.35 | 1123–1131 | 1251–1259 | 98.78 |
| 6 | 1251–1259 | 1287–1296 | 75.44 | 95.97 | 1123–1131 | 1248–1261 | 98.75 |
| 7 | 1169–1177 | 1251–1259 | 72.55 | 95.21 | 1123–1131 | 1250–1264 | 98.50 |
| 8 | 1243–1252 | 1251–1259 | 69.12 | 99.11 | 1123–1131 | 1243–1252 | 98.02 |
| 9 | 1251–1259 | 1541–1550 | 67.25 | 97.09 | 1123–1131 | 1131–1139 | 98.01 |
| 10 | 1248–1261 | 1251–1259 | 67.03 | 99.65 | 1250–1264 | 1541–1550 | 97.23 |
| 71 (IC41) | 1073–1081 | 1248–1261 | 38.34 | 96.64 | 1073–1081 | 1248–1261 | 96.64 |
For the first design, the combinations were ranked according to the L scores (equation 8). The statistic PCAG of the combinations is also presented and was calculated based on available sequences of all genotypes in the Los Alamos database (40). The rank of NS3 epitopes in the peptide-based IC41 vaccine is also mentioned at the bottom of the table in italics. The HLA class II epitopes are underlined to differentiate them from the HLA class I epitopes.
DISCUSSION
Despite many efforts, there is currently no functional vaccine available for HCV. Here, we have characterized the mutational statistics within the diverse publicly available sequences of the NS3 protein and identified mutational vulnerabilities of the virus that can potentially guide the rational design of immunogens against HCV. We specifically utilized ideas from RMT for robust estimation of the sample correlation matrix of substitutions, decoupling intrinsic correlations from phylogeny and statistical noise, which enabled us to identify independent groups of coevolving sites in NS3.
Many notable efforts in the past have studied coevolving residues in HCV (34–39). Similar to our results, those papers noted the presence of coevolving residues that are far from each other in the linear sequence, suggesting that these might be a consequence of epistatic interactions mediated by the 3-D protein structure. Although different in application (therapy outcome prediction as opposed to vaccine design in our case), reference 34 is closely related to our work. The authors of reference 34 analyzed genome-wide amino acid covariances within pretherapy HCV sequences of 94 patients (47 of genotype 1a and 47 of genotype 1b), a considerably smaller data set than ours. Those authors identified common covarying inter- and intraprotein residues that were predictive of the outcome of the standard therapy. An important feature of our RMT-based method which was not considered in reference 34 was the removal of statistical noise. Our analysis shows that even for an approximately 60×-larger data set of a single protein, the data correlation matrix consisted of considerable statistical noise. In fact, when sectors were formed without this cleaning procedure, all the significance tests reported in our work resulted in loss of significance (P > 0.05) for each sector. Moreover, the phylogenetic effect on the correlations was not considered in reference 34, despite this having been noted as an important factor in HCV evolution (60, 61) and similarly in HIV evolution (18, 61). Of the reported 26 covarying pairs, however, correlations were significant for only 13 pairs according to our analysis (using RMT cleaning). We believe that these differences are likely due to the large differences in the numbers of sequences employed in the two studies and the consequent significant effects of statistical noise and phylogeny which were unaccounted for in reference 34.
Throughout our analysis, we assumed that the correlations observed in the sequences, after “cleaning out” noise and phylogeny, faithfully reflected intrinsic fitness. However, it is known that HCV evolution is impacted by immune selection, and this is evidenced by a large number of HLA-specific substitutions reported in the literature (62–65). To test whether our results are strongly biased due to immune selection (and therefore not accurately reflective of intrinsic fitness), we tried to compare the substitutions reported in these papers with our analysis. A disagreement can then support our assumption of the correlations representing intrinsic fitness. Unfortunately, most of the HLA-specific substitutions in NS3 epitopes mentioned in references 62, 63, 64, and 65 are single substitutions. However, a negatively correlated pair (sites 1397 and 1398) in HLA-B*0801-positive patients was reported in reference 63. This “immune-induced” correlation was in fact found to be nonsignificant in our analysis. We believe that there would certainly be some effect of HLA footprints in the sequences but that it would not likely be dominant as argued in references 18 and 66. Specifically, in reference 18, in which a similar analysis was performed on the Gag protein of HIV, it was found that the mutations due to HLA footprints were weakly coupled. This is in line with what we found for the HLA-associated negatively correlated pair mentioned in reference 63. Intuitively, one would expect the effect on correlations due to immune selection to average out, because the sequences in the database are taken from a wide range of patients in different geographical areas.
To further complement our results, it would be interesting to perform a detailed study of the probability distributions of the sequences, similar to that reported in reference 29, that could potentially reveal further insights into the fitness of a HCV protein sequence with particular substitutions. The current work, however, serves as an initial base of statistical study of HCV sequences from which a potent vaccine against HCV might be devised. Moreover, this study can be easily extended for designing immunogens targeting other HCV proteins (such as NS4B and NS5B, which are known to be important antiviral targets [67], as well as the highly variable envelope glycoproteins E1 and E2). With the rapid advancement in sequencing techniques, this approach can also be performed for studying interprotein correlations in the future as more sequences become available.
In summary, we pursued an approach similar to that used in reference 18 (which dealt with HIV) to obtain sectors of coevolving sites in the NS3 protein of HCV. This analysis revealed three such sectors in NS3, with sector 1 consisting of a comparatively large number of sites that are negatively correlated and with a high ratio of negative to positive correlations as well. The sites present in sector 1 had structural significance as they were present at critical interfaces between the helicase monomers forming a dimer and between the helicase and the protease domains. A greater proportion of negative correlations within these sites indicated that, due to structural and functional constraints, multiple substitutions in these regions are likely to be deleterious to viral fitness. These predictions can be tested through in vitro replicative capacity assays.
The study of the epitopes recognized by specific HLA alleles that are associated with spontaneous viral clearance (HLA-A3, HLA-B27, HLA-B57, HLA-DRB1*0101, HLA-DRB1*0401, and HLA-DR11) demonstrated that those sites were preponderantly in sector 1. The higher percentage of sites in known allele-independent protective CD4+ epitopes also favored sector 1. Thus, based on the structural and experimental data available in the literature, it appears that the sites (particularly the negatively correlated ones) in sector 1 of NS3 can be a potential target for a potent HCV vaccine.
We also proposed two population-oriented epitope-based vaccine designs comprising 5 NS3 epitopes that optimize two different objectives. One focused on maximizing efficacy, while the other stressed minimizing the possibility of escape. We studied the combination of two NS3 epitopes present in IC41 based on our statistical analysis framework and observed that, while IC41 has desirable features, there may be better alternatives that take into account collective constraints in viral evolution. Thus, this work serves as a guideline for experimental biologists and immunologists to test the epitopes (suggested in this paper) for an efficacious HCV vaccine.
APPENDIX
Validity of binary approximation.
Since the binary approximation of the MSA reduces the description of residue identity from the 20-letter alphabet of amino acids to a 2-letter binary code, this results in a loss of information. It is, however, a reasonable approximation when residues are well conserved (18, 32). This was ascertained by comparing the Shannon entropy per residue within the binary approximation with that for the case when all the 20 amino acids along with the blank are considered. Because the Shannon entropy is a good statistical measure of diversity (68), equal values in the binary and the full amino acid representations would support the validity of the former. For the binary MSA, the entropy at position i (i = 1, 2, …, N) can be written as follows:
| (9) |
For the original (amino acid) MSA, the entropy can be calculated by using the frequencies of all the 20 amino acids at each residue along with the frequency of the blank as follows:
| (10) |
is the frequency of amino acid a at position i.
Steps involved in cleaning the sample correlation matrix. (i) Step 1. Removing the effect of phylogeny.
As all HCV sequences have recently evolved from a common ancestor (69), phylogenetic correlations make a large contribution to the correlation matrix, just as in the case of HIV (18). The consequence of this effect is that the maximum eigenvalue λmax is associated with an eigenvector whose components carry the same sign (18, 32). This concept of phylogeny is analogous to the “market mode” in finance as discussed in references 30 and 31. As we are not interested in this historical correlation, it needed to be removed. This was accomplished using a simple linear regression approach (18, 30, 31) that removed the maximum eigenvalue and its effect on the remaining data.
(ii) Step 2. Removing noise using RMT.
As the number of patients' sequences is limited in HCV, classical statistical methods, which apply when the number of observations (sequences) is very large (i.e., M → ∞) compared to the number of variables (sites), cannot be used to clean the noise. On the other hand, RMT is deployed for obtaining statistics in the double-limit regime in which both the number of observations and the number of variables are large (i.e., M → ∞ and N → ∞) and comparable, which is more related to our HCV data set. Specifically, in this double-limit regime, the Marĉenko-Pastur (MP) law (70) states that the sample eigenvalue distribution of a random matrix consisting of independent and identically distributed (i.i.d.) elements converges to a deterministic limiting distribution (with probability = 1), while references 71 and 72 show that the maximum and minimum eigenvalues of such a random matrix converge to the respective edges of the limiting distribution. Thus, these RMT results can be used to distinguish between correlations due to statistical noise (which is assumed i.i.d.) and the interesting correlations among sites. As opposed to using the MP law directly, to account for finite size effects, we determined the bounds on the eigenvalues numerically by randomly shuffling the entries along each column (site) of the MSA and estimating the eigenvalues of the resulting ensemble of “random matrices.” The maximum eigenvalue of the randomized alignment was considered an upper bound for statistical noise, and all the eigenvalues less than or equal to it were discarded (18, 32). There are alternative RMT-based approaches present in the literature (see, for example, references 43 and 44) for cleaning the statistical noise. These approaches are discussed below. It was found that the qualitative results remained the same regardless of the approach used to clean the statistical noise.
Alternative approaches to clean the statistical noise yield qualitatively similar results.
It is important to obtain a good estimate of the true correlation matrix from the sample correlation matrix, as the formation of sectors and the calculation of percentage of positive and negative correlations depend on it. It is well known that the traditional sample correlation matrix gives noisy estimates for scenarios in which the number of variables and the number of observations are of similar orders (18, 30–32). Thus, this noise must be cleaned to get insightful results. Obtaining a true correlation matrix from the sample correlation matrix based on appropriate thresholding is currently an active area of research (73).
In our work, an RMT-based “eigenvalue clipping” method similar to the methods described in references 18, 30, 31, and 32 was used to clean the statistical noise from the sample correlation matrix. As described in Materials and Methods, all eigenvalues less than the maximum eigenvalue of the randomized alignment were discarded. Panels a to c in Fig. A1 demonstrate that the results of our analysis are robust with respect to the change in the number of eigenvalues (α) selected for the construction of the cleaned correlation matrix. In the literature, there are other RMT-based methods present as well that remove statistical noise. For example, a slightly modified method was proposed in reference 43, in which, instead of discarding all eigenvalues less than , these were replaced with a constant value such that Tr(C) = N* (i.e., the number of mutating sites in the MSA), where Tr(.) denotes the trace operation which is the sum of the eigenvalues of C. In reference 44, it was shown that by assuming a so-called “spike” model for the eigenvalue distribution of the true covariance matrix, its large eigenvalues (lj) can be estimated from the large eigenvalues (λj > ) of the sample covariance matrix as follows (proposition 3.4 [44]):
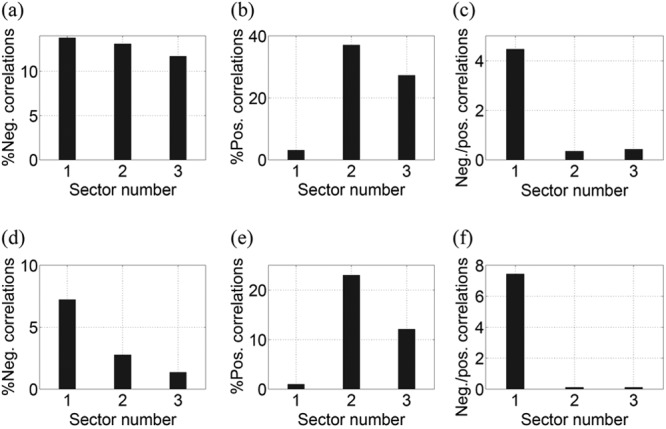
where γ = N/M. To examine the consequences of this method, we applied the above correction to eigenvalues greater than whereas the remaining eigenvalues were replaced by a constant as described in reference 43. After testing the above methods for cleaning the noise from the sample correlation matrix of NS3, the qualitative results (as shown in Fig. A1d to i) remained the same. The statistical trends also remained consistent; i.e., the percentage of negative correlations and the ratio of negative to positive correlations of sector 1 within NS3 were always greater than those of the remaining sectors.
FIG A1.
Consistency in the statistics of the three sectors of NS3 when the cleaned correlation matrix was constructed using selective large eigenvalues (4 < α < 9). (a) The percentage of negative correlations. (b) The percentage of positive correlations. (c) The ratio of negative to positive correlations. (d to f) Statistics of the sectors as a function of the number of eigenvalues selected to construct the cleaned correlation matrix for NS3 using the RMT-based modified eigenvalue clipping method (43). (g to i) RMT-based estimation of true eigenvalues from sample eigenvalues (44).
Alternative approaches to define the sectors are mutually consistent.
As described in Results, the sectors were formed based on the eigenvectors of the correlation matrix (according to equation 6). For statistical independence of the sectors, the higher-order couplings should also be studied. One can use independent component analysis (ICA), a heuristic way to find statistically independent components, as described in references 32 and 45. Though there are several variants of ICA, a basic version (74) was implemented with whitening (i.e., it was fed the important [nine] eigenvectors only, which were found based on comparing the eigenvalue distribution of the actual alignment with that of randomized alignments). The 3-D scatter plot of the loadings of the independent components was used to group sites into three sectors as shown in Fig. A2a. The heat map of the cleaned correlation matrix is also shown in Fig. A2b. Note that sector 1 formed using this method shared 94% similarity with sector 1 obtained in Results. The percentages of overlapping sites for sector 2 and sector 3 of both methods were 78.5% and 97%, respectively. The statistical analysis of the sectors shown in Fig. A3 is consistent with Fig. 2, with the only exception being the increase of negatively correlated sites in sector 2. The ratio of negative to positive correlations of sector 1 remained the largest. It can be argued that the eigenvalues might be noisier near the threshold obtained from the randomized alignment; panels e to g of Fig. A3 show that the percentage of negative correlations of sector 2 increases when eigenvalues greater than 7 are used to construct the cleaned correlation matrix. The percentages of sites of the epitopes targeted by the HCV controllers and of those in the therapeutic IC41 vaccine falling within each of the NS3 sectors defined by ICA are presented in Fig. A4a to c. It can be seen that these results were fairly consistent with Fig. 5a to c.
FIG A2.
(a) 3-D scatter plot of the loadings of the independent components 1, 2, and 3 showing the three distinct sectors of NS3 constructed using the ICA method. (b) Heat map of the cleaned correlation matrix with rows and columns ordered according to the sites in the three sectors of NS3 constructed using the ICA method.
FIG A3.

(a to d) Statistics of the three sectors of NS3 constructed using the ICA method. (a) The mean of single-site conservation. (b) The percentage of negative correlations. (c) The percentage of positive correlations. (d) The ratio of negative to positive correlations. (e to g) Consistency in the statistics of the three sectors of NS3 (constructed using the ICA method) when the cleaned correlation matrix was constructed using selective large eigenvalues (4 < α < 9). (e) The percentage of negative correlations. (f) The percentage of positive correlations. (g) The ratio of negative to positive correlations.
FIG A4.
Analysis of the three sectors of NS3 constructed using the ICA method. (a) Percentage of sites in the NS3-specific allele-restricted protective epitopes present in the original sectors and the modified sectors obtained by incorporating the neighboring 100% conserved sites. (b) Percentage of sites in the NS3-specific allele-independent protective epitopes present in the original sectors and the modified sectors. (c) Percentage of sites in the NS3-specific IC41 epitopes present in the original sectors and the modified sectors.
For defining the sectors in Results, a threshold ε was selected after studying the loadings of each one of the top α eigenvectors. As an alternative, a distribution fitting method presented in reference 45 was used to automatically form sectors. In this method, the threshold ε was calculated by fitting the distribution of the loadings of each one of the top α-independent components to a particular distribution. The distribution of the independent components was found to be heavy tailed as shown in Fig. A5a (in blue). Thus, a t-location-scale distribution was selected as a reference distribution because it is useful for modeling distributions with heavy tails. The independent components were obtained from the top nine eigenvectors using ICA as discussed above. The fitted t-location-scale distribution for independent components 1, 3, and 4 is plotted in Fig. A5a (in red). The threshold ε is obtained by setting a cutoff on the tail probability of the fitted distribution such that P( > ε) ≤ ζ. A cutoff of ζ = 0.15 was used in all cases. In this case, sector 1 was formed using independent component (IC) 1, sector 2 using IC 3, and sector 3 using IC 4. Note that no sector was formed from the remaining six independent components. The 3-D scatter plot of the loadings of the independent components in Fig. A5b demonstrates the sites in the three sectors. The heat map of the cleaned correlation matrix is also shown in Fig. A5c. Note that sector 1 formed using this method was 95% similar to sector 1 obtained in Results. The percentages of overlapping sites in sector 2 and sector 3 obtained using this method were 67% and 74% compared with those in sector 3 and sector 2 as mentioned in Results, respectively. The statistical analysis of the sectors shown in Fig. A6 is consistent with Fig. 2. As mentioned above, sector 3 derived from this method corresponded largely to sector 2 in Fig. 2. The percentage of negative correlations of sector 1 was again larger than that of the other sectors. Panels e to g of Fig. A6 demonstrate that this trend was independent of the number of large eigenvalues used to construct the cleaned correlation matrix. The fraction of the sites of the epitopes (targeted by the HCV controllers and selected in IC41) present in each sector (when independent components along with distribution fitting were used to form them) is shown in Fig. A7a to c. It can be seen that these results were fairly consistent with Fig. 5a to c.
FIG A5.

(a) The distribution of independent components 1, 3, and 4 (in blue), along with the fitted t location-scale distribution (in red). The threshold values used to form the sectors are also shown by the dotted black line. (b) 3-D scatter plot of the loadings of the independent components 1, 3, and 4 showing the three distinct sectors of NS3 constructed using ICA and the distribution fitting method. (c) Heat map of the cleaned correlation matrix with rows and columns ordered according to the sites in the three sectors of NS3 constructed using ICA and the distribution fitting method.
FIG A6.

(a to d) Statistics of the three sectors of NS3 constructed using ICA and the distribution fitting method. (a) The mean of single-site conservation. (b) The percentage of negative correlations. (c) The percentage of positive correlations. (d) The ratio of negative to positive correlations. (e to g) Consistency in the statistics of the three sectors of NS3 (constructed using the ICA method) when the cleaned correlation matrix was constructed using selective large eigenvalues (4 < α < 9). (e) The percentage of negative correlations. (f) The percentage of positive correlations. (g) The ratio of negative to positive correlations.
FIG A7.
Analysis of the three sectors of NS3 constructed using ICA and the distribution fitting method. (a) Percentage of sites in the NS3-specific allele-restricted protective epitopes present in the original sectors and the modified sectors obtained by incorporating the neighboring 100% conserved sites. (b) Percentage of sites in the NS3-specific allele-independent protective epitopes present in the original sectors and the modified sectors. (c) Percentage of sites in the NS3-specific IC41 epitopes present in the original sectors and the modified sectors.
Supplementary Material
ACKNOWLEDGMENTS
We thank Fatima Pardo (Department of Chemistry, The Hong Kong University of Science and Technology, Kowloon, Hong Kong) for helpful discussions regarding the 3-D structure of proteins.
This work was supported by the Hong Kong PhD Fellowship Scheme, Research Grants Council, Hong Kong (A.A.Q.), HKUST research grant IGN13EG02 (R.H.Y.L.), the Ragon Institute of Massachusetts General Hospital, MIT and Harvard (K.S. and A.K.C.), and the Hari Harilela endowment fund, R8002 (M.R.M.).
Footnotes
Published ahead of print 23 April 2014
Supplemental material for this article may be found at http://dx.doi.org/10.1128/JVI.03812-13.
REFERENCES
- 1.World Health Organization. 2013. Factsheet, hepatitis C. World Health Organization, Geneva, Switzerland [Google Scholar]
- 2.Lauer G, Walker B. 2001. Hepatitis C virus infection. N. Engl. J. Med. 345:41–52. 10.1056/NEJM200107053450107 [DOI] [PubMed] [Google Scholar]
- 3.Afdhal NH. 2004. The natural history of hepatitis C. Semin. Liver Dis. 24:3–8. 10.1055/s-2004-832922 [DOI] [PubMed] [Google Scholar]
- 4.National Institutes of Health. 2002. National Institutes of Health Consensus Development Conference statement: management of hepatitis C: 2002–June 10–12, 2002. Hepatology 36(Suppl 1):S3–S20. 10.1053/jhep.2002.37117 [DOI] [PubMed] [Google Scholar]
- 5.Grieve R, Roberts J, Wright M, Sweeting M, DeAngelis D, Rosenberg W, Bassendine M, Main J, Thomas H. 2006. Cost effectiveness of interferon alpha or peginterferon alpha with ribavirin for histologically mild chronic hepatitis C. Gut 55:1332–1338. 10.1136/gut.2005.064774 [DOI] [PMC free article] [PubMed] [Google Scholar]
- 6.Dev A, Patel K, McHutchison J. 2004. New therapies for chronic hepatitis C virus infection. Curr. Gastroenterol. Rep. 6:77–86. 10.1007/s11894-004-0030-5 [DOI] [PubMed] [Google Scholar]
- 7.Booth JC, O'Grady J, Neuberger J; The Royal College of Physicians of London and the British Society of Gastroenterology. 2001. Clinical guidelines on the management of hepatitis C. Gut 49:I1–I21. 10.1136/gut.49.suppl_1.I1 [DOI] [PMC free article] [PubMed] [Google Scholar]
- 8.Delang L, Neyts J, Vliegen I, Abrignani S, Neddermann P, De Francesco R. 2013. Hepatitis C virus-specific directly acting antiviral drugs, p 289–320 In Bartenschlager R. (ed), Hepatitis C virus: from molecular virology to antiviral therapy. Springer, Berlin, Germany: [DOI] [PubMed] [Google Scholar]
- 9.Halliday J, Klenerman P, Barnes E. 2011. Vaccination for hepatitis C virus: closing in on an evasive target. Expert Rev. Vaccines 10:659–672. 10.1586/erv.11.55 [DOI] [PMC free article] [PubMed] [Google Scholar]
- 10.Moradpour D, Penin F, Rice CM. 2007. Replication of hepatitis C virus. Nat. Rev. Microbiol. 5:453–463. 10.1038/nrmicro1645 [DOI] [PubMed] [Google Scholar]
- 11.Perotti M, Mancini N, Diotti RA, Tarr AW, Ball JK, Owsianka A, Adair R, Patel AH, Clementi M, Burioni R. 2008. Identification of a broadly cross-reacting and neutralizing human monoclonal antibody directed against the hepatitis C virus E2 protein. J. Virol. 82:1047–1052. 10.1128/JVI.01986-07 [DOI] [PMC free article] [PubMed] [Google Scholar]
- 12.Meunier J-C, Russell RS, Goossens V, Priem S, Walter H, Depla E, Union A, Faulk KN, Bukh J, Emerson SU, Purcell RH. 2008. Isolation and characterization of broadly neutralizing human monoclonal antibodies to the E1 glycoprotein of hepatitis C virus. J. Virol. 82:966–973. 10.1128/JVI.01872-07 [DOI] [PMC free article] [PubMed] [Google Scholar]
- 13.Klenerman P, Thimme R. 2012. T cell responses in hepatitis C: the good, the bad and the unconventional. Gut 61:1226–1234. 10.1136/gutjnl-2011-300620 [DOI] [PubMed] [Google Scholar]
- 14.Timm J, Lauer GM, Kavanagh DG, Sheridan I, Kim AY, Lucas M, Pillay T, Ouchi K, Reyor LL, Schulze zur Wiesch J, Gandhi RT, Chung RT, Bhardwaj N, Klenerman P, Walker BD, Allen TM. 2004. CD8 epitope escape and reversion in acute HCV infection. J. Exp. Med. 200:1593–1604. 10.1084/jem.20041006 [DOI] [PMC free article] [PubMed] [Google Scholar]
- 15.Söderholm J, Ahlén G, Kaul A, Frelin L, Alheim M, Barnfield C, Liljeström P, Weiland O, Milich DR, Bartenschlager R, Sällberg M. 2006. Relation between viral fitness and immune escape within the hepatitis C virus protease. Gut 55:266–274. 10.1136/gut.2005.072231 [DOI] [PMC free article] [PubMed] [Google Scholar]
- 16.Petrovic D, Dempsey E, Doherty DG, Kelleher D, Long A. 2012. Hepatitis C virus—T-cell responses and viral escape mutations. Eur. J. Immunol. 42:17–26. 10.1002/eji.201141593 [DOI] [PubMed] [Google Scholar]
- 17.Oniangue-Ndza C, Kuntzen T, Kemper M, Berical A, Wang YE, Neumann-Haefelin C, Foote PK, Hills-Evans K, Reyor LL, Kane K, Gladden AD, Bloom AK, Power KA, Thimme R, Lauer GM, Henn MR, Kim AY, Allen TM. 2011. Compensatory mutations restore the replication defects caused by cytotoxic T lymphocyte escape mutations in hepatitis C virus polymerase. J. Virol. 85:11883–11890. 10.1128/JVI.00779-11 [DOI] [PMC free article] [PubMed] [Google Scholar]
- 18.Dahirel V, Shekhar K, Pereyra F, Miura T, Artyomov M, Talsania S, Allen TM, Altfeld M, Carrington M, Irvine DJ, Walker BD, Chakraborty AK. 2011. Coordinate linkage of HIV evolution reveals regions of immunological vulnerability. Proc. Natl. Acad. Sci. U. S. A. 108:11530–11535. 10.1073/pnas.1105315108 [DOI] [PMC free article] [PubMed] [Google Scholar]
- 19.Chang KM, Thimme R, Melpolder JJ, Oldach D, Pemberton J, Moorhead-Loudis J, McHutchison JG, Alter HJ, Chisari FV. 2001. Differential CD4+ and CD8+ T-cell responsiveness in hepatitis C virus infection. Hepatology 33:267–276. 10.1053/jhep.2001.21162 [DOI] [PubMed] [Google Scholar]
- 20.Schulze zur Wiesch J, Lauer GM, Day CL, Kim AY, Ouchi K, Duncan JE, Wurcel AG, Timm J, Jones AM, Mothe B, Allen TM, McGovern B, Lewis-Ximenez L, Sidney J, Sette A, Chung RT, Walker BD. 2005. Broad repertoire of the CD4+ Th cell response in spontaneously controlled hepatitis C virus infection includes dominant and highly promiscuous epitopes. J. Immunol. 175:3603–3613 [DOI] [PubMed] [Google Scholar]
- 21.Fournillier A, Dupeyrot P, Martin P, Parroche P, Pajot A, Chatel L, Fatmi A, Gerossier E, Bain C, Lone YC, Trépo C, Inchauspé G. 2006. Primary and memory T cell responses induced by hepatitis C virus multiepitope long peptides. Vaccine 24:3153–3164. 10.1016/j.vaccine.2006.01.039 [DOI] [PubMed] [Google Scholar]
- 22.Schulze Zur Wiesch J, Ciuffreda D, Lewis-Ximenez L, Kasprowicz V, Nolan BE, Streeck H, Aneja J, Reyor LL, Allen TM, Lohse AW, McGovern B, Chung RT, Kwok WW, Kim AY, Lauer GM. 2012. Broadly directed virus-specific CD4+ T cell responses are primed during acute hepatitis C infection, but rapidly disappear from human blood with viral persistence. J. Exp. Med. 209:61–75. 10.1084/jem.20100388 [DOI] [PMC free article] [PubMed] [Google Scholar]
- 23.Wedemeyer H, Schuller E, Schlaphoff V, Stauber RE, Wiegand J, Schiefke I, Firbas C, Jilma B, Thursz M, Zeuzem S, Hofmann WP, Hinrichsen H, Tauber E, Manns MP, Klade CS. 2009. Therapeutic vaccine IC41 as late add-on to standard treatment in patients with chronic hepatitis C. Vaccine 27:5142–5151. 10.1016/j.vaccine.2009.06.027 [DOI] [PubMed] [Google Scholar]
- 24.Diepolder HM, Gerlach JT, Zachoval R, Hoffmann RM, Jung MC, Wierenga EA, Scholz S, Santantonio T, Houghton M, Southwood S, Sette A, Pape GR. 1997. Immunodominant CD4+ T-cell epitope within nonstructural protein 3 in acute hepatitis C virus infection. J. Virol. 71:6011–6019 [DOI] [PMC free article] [PubMed] [Google Scholar]
- 25.Bronowicki JP, Vetter D, Uhl G, Hudziak H, Uhrlacher A, Vetter JM, Doffoel M. 1997. Lymphocyte reactivity to hepatitis C virus (HCV) antigens shows evidence for exposure to HCV in HCV-seronegative spouses of HCV-infected patients. J. Infect. Dis. 176:518–522. 10.1086/517279 [DOI] [PubMed] [Google Scholar]
- 26.Pang PS, Jankowsky E, Planet PJ, Pyle AM. 2002. The hepatitis C viral NS3 protein is a processive DNA helicase with cofactor enhanced RNA unwinding. EMBO J. 21:1168–1176. 10.1093/emboj/21.5.1168 [DOI] [PMC free article] [PubMed] [Google Scholar]
- 27.Rosen HR, Miner C, Sasaki AW, Lewinsohn DM, Conrad AJ, Bakke A, Bouwer HGA, Hinrichs DJ. 2002. Frequencies of HCV-specific effector CD4+ T cells by flow cytometry: correlation with clinical disease stages. Hepatology 35:190–198 [DOI] [PubMed] [Google Scholar]
- 28.Raney KD, Sharma SD, Moustafa IM, Cameron CE. 2010. Hepatitis C virus non-structural protein 3 (HCV NS3): a multifunctional antiviral target. J. Biol. Chem. 285:22725–22731. 10.1074/jbc.R110.125294 [DOI] [PMC free article] [PubMed] [Google Scholar]
- 29.Ferguson A, Mann J, Omarjee S, Ndung'u T, Walker BD, Chakraborty AK. 2013. Translating HIV sequences into quantitative fitness landscapes predicts viral vulnerabilities for rational immunogen design. Immunity 38:606–617. 10.1016/j.immuni.2012.11.022 [DOI] [PMC free article] [PubMed] [Google Scholar]
- 30.Laloux L, Cizeau P, Potters M, Bouchaud J-P. 2000. Random matrix theory and financial correlations. Int. J. Theor. Appl. Financ. 03:391–397. 10.1142/S0219024900000255 [DOI] [Google Scholar]
- 31.Plerou V, Gopikrishnan P, Rosenow B, Amaral L, Guhr T, Stanley H. 2002. Random matrix approach to cross correlations in financial data. Phys. Rev. E Stat. Nonlin. Soft Matter Phys. 65(Pt 2):066126. 10.1103/PhysRevE.65.066126 [DOI] [PubMed] [Google Scholar]
- 32.Halabi N, Rivoire O, Leibler S, Ranganathan R. 2009. Protein sectors: evolutionary units of three-dimensional structure. Cell 138:774–786. 10.1016/j.cell.2009.07.038 [DOI] [PMC free article] [PubMed] [Google Scholar]
- 33.Schmidt J, Blum HE, Thimme R. 2013. T-cell responses in hepatitis B and C virus infection: similarities and differences. Emerg. Microbes Infect. 2:e15. 10.1038/emi.2013.14 [DOI] [PMC free article] [PubMed] [Google Scholar]
- 34.Aurora R, Donlin M. 2009. Genome-wide hepatitis C virus amino acid covariance networks can predict response to antiviral therapy in humans. J. Clin. Invest. 119:225–236. 10.1172/JCI37085 [DOI] [PMC free article] [PubMed] [Google Scholar]
- 35.Lara J, Xia G, Purdy M, Khudyakov Y. 2011. Coevolution of the hepatitis C virus polyprotein sites in patients on combined pegylated interferon and ribavirin therapy. J. Virol. 85:3649–3663. 10.1128/JVI.02197-10 [DOI] [PMC free article] [PubMed] [Google Scholar]
- 36.Campo DS, Dimitrova Z, Mitchell RJ, Lara J, Khudyakov Y. 2008. Coordinated evolution of the hepatitis C virus. Proc. Natl. Acad. Sci. U. S. A. 105:9685–9690. 10.1073/pnas.0801774105 [DOI] [PMC free article] [PubMed] [Google Scholar]
- 37.Schvoerer E, Moenne-Loccoz R, Murray JM, Velay A, Turek M, Fofana I, Fafi-Kremer S, Erba A-C, Habersetzer F, Doffoël M, Gut J-P, Donlin MJ, Tavis JE, Zeisel MB, Stoll-Keller F, Baumert TF. 2013. Hepatitis C virus envelope glycoprotein signatures are associated with treatment failure and modulation of viral entry and neutralization. J. Infect. Dis. 207:1306–1315. 10.1093/infdis/jit032 [DOI] [PubMed] [Google Scholar]
- 38.Lara J, Tavis JE, Donlin MJ, Lee WM, Yuan H-J, Pearlman BL, Vaughan G, Forbi JC, Xia G-L, Khudyakov YE. 2012. Coordinated evolution among hepatitis C virus genomic sites is coupled to host factors and resistance to interferon. In Silico Biol. 11:213–224. 10.3233/ISB-2012-0456 [DOI] [PubMed] [Google Scholar]
- 39.Murray JM, Moenne-Loccoz R, Velay A, Habersetzer F, Doffoël M, Gut J-P, Fofana I, Zeisel MB, Stoll-Keller F, Baumert TF, Schvoerer E. 2013. Genotype 1 hepatitis C virus envelope features that determine antiviral response assessed through optimal covariance networks. PLoS One 8:e67254. 10.1371/journal.pone.0067254 [DOI] [PMC free article] [PubMed] [Google Scholar]
- 40.Kuiken C, Yusim K, Boykin L, Richardson R. 2005. The Los Alamos hepatitis C sequence database. Bioinformatics 21:379–384. 10.1093/bioinformatics/bth485 [DOI] [PubMed] [Google Scholar]
- 41.Tulino A, Verdú S. 2004. Random matrix theory and wireless communications. Now Publishers Inc., Hanover, MA. 10.1561/0100000001 [DOI] [Google Scholar]
- 42.Couillet R, Debbah M. 2011. Random matrix methods for wireless communications. Cambridge University Press, Cambridge, United Kingdom. 10.1017/CBO9780511994746 [DOI] [Google Scholar]
- 43.Bouchaud J-P, Potters M. 2011. Financial applications of random matrix theory: a short review, p 824–850 In Akemann G, Baik J, and Di, Francesco P. (ed), The Oxford handbook of random matrix theory. Oxford University Press, Oxford, United Kingdom [Google Scholar]
- 44.Nadakuditi RR, Edelman A. 2008. Sample eigenvalue based detection of high-dimensional signals in white noise using relatively few samples. IEEE Trans. Signal Process. 56:2625–2638. 10.1109/TSP.2008.917356 [DOI] [Google Scholar]
- 45.Ranganathan R, Rivoire O. 2012. Note 109: a summary of SCA calculations. http://systems.swmed.edu/rr_lab/sca.html
- 46.Storey JD, Tibshirani R. 2003. Statistical significance for genomewide studies. Proc. Natl. Acad. Sci. U. S. A. 100:9440–9445. 10.1073/pnas.1530509100 [DOI] [PMC free article] [PubMed] [Google Scholar]
- 47.Saalau-Bethell S, Woodhead A. 2012. Discovery of an allosteric mechanism for the regulation of HCV NS3 protein function. Nat. Chem. Biol. 8:920–925. 10.1038/nchembio.1081 [DOI] [PMC free article] [PubMed] [Google Scholar]
- 48.Mackintosh SG, Lu JZ, Jordan JB, Harrison MK, Sikora B, Sharma SD, Cameron CE, Raney KD, Sakon J. 2006. Structural and biological identification of residues on the surface of NS3 helicase required for optimal replication of the hepatitis C virus. J. Biol. Chem. 281:3528–3535. 10.1074/jbc.M512100200 [DOI] [PubMed] [Google Scholar]
- 49.Zaki M, Jin S, Bystroff C. 2003. Mining residue contacts in proteins using local structure predictions. IEEE Trans. Syst. Man. Cybern. B Cybern. 33:789–801. 10.1109/TSMCB.2003.816916 [DOI] [PubMed] [Google Scholar]
- 50.Ogmen U, Keskin O, Aytuna AS, Nussinov R, Gursoy A. 2005. PRISM: protein interactions by structural matching. Nucleic Acids Res. 33(Web Server issue):W331–W336. 10.1093/nar/gki585 [DOI] [PMC free article] [PubMed] [Google Scholar]
- 51.Thio C, Gao X, Goedert J. 2002. HLA-Cw* 04 and hepatitis C virus persistence. J. Virol. 76:4792–4797. 10.1128/JVI.76.10.4792-4797.2002 [DOI] [PMC free article] [PubMed] [Google Scholar]
- 52.Neumann-Haefelin C, McKiernan S, Ward S, Viazov S, Spangenberg HC, Killinger T, Baumert TF, Nazarova N, Sheridan I, Pybus O, von Weizsäcker F, Roggendorf M, Kelleher D, Klenerman P, Blum HE, Thimme R. 2006. Dominant influence of an HLA-B27 restricted CD8+ T cell response in mediating HCV clearance and evolution. Hepatology 43:563–572. 10.1002/hep.21049 [DOI] [PubMed] [Google Scholar]
- 53.Neumann-Haefelin C, Oniangue-Ndza C, Kuntzen T, Schmidt J, Nitschke K, Sidney J, Caillet-Saguy C, Binder M, Kersting N, Kemper MW, Power KA, Ingber S, Reyor LL, Hills-Evans K, Kim AY, Lauer GM, Lohmann V, Sette A, Henn MR, Bressanelli S, Thimme R, Allen TM. 2011. Human leukocyte antigen B27 selects for rare escape mutations that significantly impair hepatitis C virus replication and require compensatory mutations. Hepatology 54:1157–1166. 10.1002/hep.24541 [DOI] [PMC free article] [PubMed] [Google Scholar]
- 54.Kim AY, Kuntzen T, Timm J, Nolan BE, Baca MA, Reyor LL, Berical AC, Feller AJ, Johnson KL, Wiesch Zur S, Robbins GK, Chung RT, Walker BD, Carrington M, Allen TM, Lauer GM. 2011. Spontaneous control of HCV is associated with expression of HLA-B*57 and preservation of targeted epitopes. Gastroenterology 140:686–696. 10.1053/j.gastro.2010.09.042 [DOI] [PMC free article] [PubMed] [Google Scholar]
- 55.Hraber P, Kuiken C, Yusim K. 2007. Evidence for human leukocyte antigen heterozygote advantage against hepatitis C virus infection. Hepatology 46:1713–1721. 10.1002/hep.21889 [DOI] [PubMed] [Google Scholar]
- 56.Sajadi M, Shakeri N, Talwani R, Redfield R. 2010. Hepatitis C infection in HIV-1 natural viral suppressors. AIDS 24:1689–1695. 10.1097/QAD.0b013e32833a2a32 [DOI] [PMC free article] [PubMed] [Google Scholar]
- 57.Ruiz-Mateos E, Machmach K, Romero-Sanchez MC, Ferrando-Martinez S, Viciana P, Del Val M, Muñoz-Fernandez MA, Genebat M, Leal M. 2011. Hepatitis C virus replication in Caucasian HIV controllers. J. Viral Hepat. 18:e350–e357. 10.1111/j.1365-2893.2010.01431.x [DOI] [PubMed] [Google Scholar]
- 58.Vita R, Zarebski L, Greenbaum JA, Emami H, Hoof I, Salimi N, Damle R, Sette A, Peters B. 2010. The immune epitope database 2.0. Nucleic Acids Res. 38(Database issue):D854–D862. 10.1093/nar/gkp1004 [DOI] [PMC free article] [PubMed] [Google Scholar]
- 59.Maiers M, Gragert L, Klitz W. 2007. High-resolution HLA alleles and haplotypes in the United States population. Hum. Immunol. 68:779–788. 10.1016/j.humimm.2007.04.005 [DOI] [PubMed] [Google Scholar]
- 60.Neumann-Haefelin C, Frick DN, Wang JJ, Pybus OG, Salloum S, Narula GS, Eckart A, Biezynski A, Eiermann T, Klenerman P, Viazov S, Roggendorf M, Thimme R, Reiser M, Timm J. 2008. Analysis of the evolutionary forces in an immunodominant CD8 epitope in hepatitis C virus at a population level. J. Virol. 82:3438–3451. 10.1128/JVI.01700-07 [DOI] [PMC free article] [PubMed] [Google Scholar]
- 61.Reeves KL, McKinnon EJ, James IR. 2012. Correction for founder effects in host-viral association studies via principal components. Stat. Appl. Genet. Mol. Biol. 11:pii: /j/sagmb.2012.11.issue-4/1544-6115.1827/1544-6115.1827.xml. 10.1515/1544-6115.1827 [DOI] [PubMed] [Google Scholar]
- 62.Timm J, Li B, Daniels MG, Bhattacharya T, Reyor LL, Allgaier R, Kuntzen T, Fischer W, Nolan BE, Duncan J, Schulze zur Wiesch J, Kim AY, Frahm N, Brander C, Chung RT, Lauer GM, Korber BT, Allen TM. 2007. Human leukocyte antigen-associated sequence polymorphisms in hepatitis C virus reveal reproducible immune responses and constraints on viral evolution. Hepatology 46:339–349. 10.1002/hep.21702 [DOI] [PubMed] [Google Scholar]
- 63.Gaudieri S, Rauch A, Park LP, Freitas E, Herrmann S, Jeffrey G, Cheng W, Pfafferott K, Naidoo K, Chapman R, Battegay M, Weber R, Telenti A, Furrer H, James I, Lucas M, Mallal SA. 2006. Evidence of viral adaptation to HLA class I-restricted immune pressure in chronic hepatitis C virus infection. J. Virol. 80:11094–11104. 10.1128/JVI.00912-06 [DOI] [PMC free article] [PubMed] [Google Scholar]
- 64.Ray SC, Fanning L, Wang X-H, Netski DM, Kenny-Walsh E, Thomas DL. 2005. Divergent and convergent evolution after a common-source outbreak of hepatitis C virus. J. Exp. Med. 201:1753–1759. 10.1084/jem.20050122 [DOI] [PMC free article] [PubMed] [Google Scholar]
- 65.Rauch A, James I, Pfafferott K, Nolan D, Klenerman P, Cheng W, Mollison L, McCaughan G, Shackel N, Jeffrey GP, Baker R, Freitas E, Humphreys I, Furrer H, Günthard HF, Hirschel B, Mallal S, John M, Lucas M, Barnes E, Gaudieri S. 2009. Divergent adaptation of hepatitis C virus genotypes 1 and 3 to human leukocyte antigen-restricted immune pressure. Hepatology 50:1017–1029. 10.1002/hep.23101 [DOI] [PubMed] [Google Scholar]
- 66.Shekhar K, Ruberman CF, Ferguson AL, Barton JP, Kardar M, Chakraborty AK. 2013. Spin models inferred from patient-derived viral sequence data faithfully describe HIV fitness landscapes. Phys. Rev. E Stat. Nonlin. Soft Matter Phys. 88:062705. 10.1103/PhysRevE.88.062705 [DOI] [PMC free article] [PubMed] [Google Scholar]
- 67.Rai R, Deval J. 2011. New opportunities in anti-hepatitis C virus drug discovery: targeting NS4B. Antiviral Res. 90:93–101. 10.1016/j.antiviral.2011.01.009 [DOI] [PubMed] [Google Scholar]
- 68.Jost L. 2006. Entropy and diversity. Oikos 113:363–375. 10.1111/j.2006.0030-1299.14714.x [DOI] [Google Scholar]
- 69.Houghton M. 2009. The long and winding road leading to the identification of the hepatitis C virus. J. Hepatol. 51:939–948. 10.1016/j.jhep.2009.08.004 [DOI] [PubMed] [Google Scholar]
- 70.Marčenko V, Pastur L. 1967. Distribution of eigenvalues for some sets of random matrices. Math. USSR-Sbornik 1:457–483. 10.1070/SM1967v001n04ABEH001994 [DOI] [Google Scholar]
- 71.Geman S. 1980. A limit theorem for the norm of random matrices. Ann. Probab. 8:252–261. 10.1214/aop/1176994775 [DOI] [Google Scholar]
- 72.Silverstein J. 1985. The smallest eigenvalue of a large dimensional Wishart matrix. Ann. Probab. 13:1364–1368. 10.1214/aop/1176992819 [DOI] [Google Scholar]
- 73.Donoho D, Gavish M. 2013. The optimal hard threshold for singular values is 4/sqrt(3). arXiv Prepr. arXiv: 1305.5870. http://arxiv.org/abs/1305.5870
- 74.Amari S, Cichocki A, Yang H. 1996. A new learning algorithm for blind signal separation. Adv. Neural Infect. Process. Syst. 8:757–763 [Google Scholar]
Associated Data
This section collects any data citations, data availability statements, or supplementary materials included in this article.