

1. Introduction
Health services and health economics research articles commonly use multivariate regression techniques to measure the relationship of health service utilization and health outcomes (the outcomes of interest) with clinical characteristics, sociodemographic factors, and policy changes (usually treated as explanatory variables). Common regression methods measure differences in outcome variables between populations at the mean (i.e., ordinary least squares regression), or a population average effect (i.e., logistic regression models), after adjustment for other explanatory variables of interest. These are often done assuming that the regression coefficients are constant across the population – in other words, the relationships between the outcomes of interest and the explanatory variables remain the same across different values of the variables. There are times, however, when researchers, policymakers, and clinicians may be interested in group differences across the distribution of a given dependent variable rather than only at the mean.
Taking a more concrete example from the literature, research on individuals' consumption of alcohol consistently reported that higher alcohol prices were associated with lower alcohol consumption.[1] This led to a call for increases in taxes as a policy lever to reduce alcohol consumption and the subsequent social costs of alcoholism and alcohol abuse. However, these studies did not provide any information about whether increased price decreased alcohol use similarly for light drinkers, moderate drinkers, and heavy drinkers. Because there are positive social benefits for light drinkers and negative health and social consequences for heavy drinkers, analyzing the demand response of different types of drinkers was important to understanding who was most likely to modify their behavior due to increasing alcohol taxes. A subsequent study[2] found light and heavy drinkers were much less price elastic than moderate drinkers; that is, higher taxes did not reduce consumption nearly as much for light and heavy drinkers as it did for moderate drinkers. The policy implication is that increasing alcohol taxes might bring in revenue (and reduce alcohol-related accidents among moderate drinkers) but will have limited success in reducing the prevalence of heavy drinking and its sequelae.
Another example is that associations of interest explaining health care and health outcomes may be very different among the highest utilizers of health care, compared to individuals at the bottom or middle of the distribution of health care utilization. As a simple illustration, Figure 1 plots the relationship between the number of hours attended of a hypothetical psychotherapy intervention (x-axis) and a fictitious scale of post-intervention mental health (higher score indicates better mental health on the y-axis) for a group of 400 individuals. In this example, the regression line from an ordinary least squares (OLS) regression model is essentially flat, suggesting that there is no relationship between number of psychotherapy session-hours and mental health at follow-up. To describe the association between number of session-hours and mental health for individuals with low and high post-treatment scores on the mental health scale using OLS, the analyst extends the line up or down to the 90th and 10th quantiles in a parallel fashion, as the OLS model assumes the association between hours of psychotherapy and mental health outcome remains the same at different levels of the mental health scale.
Figure 1. Prediction lines at 10th quantile, mean, and 90th quantile using ordinary least squares (OLS) regression.

In contrast, in Figure 2, we use quantile regression to allow slopes of the regression line to vary across quantiles of the mental health scale. Although the median line is flat as before, the 90th quantile prediction line is significantly increasing whereas the 10th quantile prediction line is significantly decreasing. This suggests that the association between the hypothetical intervention and post-intervention mental health is positive for those with better post-intervention mental health but there is a negative association among those with poorer post-intervention mental health. Quantile regression provides greater flexibility than other regression methods to identify differing relationships at different parts of the distribution of the dependent variable.
Figure 2. Prediction lines at 10th quantile, mean, and 90th quantile using quantile regression.

Health care expenditures are another area important to policy that is amenable to an analytical strategy that measures differences across the distribution. The average user of health care is obviously very different from the heavy user in terms of health status, but what about other factors such as race/ethnicity, gender, employment, insurance status and other factors of policy interest? Quantile regression allows for analysis of these other differences that exist among heavy health care users in a way that is not possible with commonly used regression methods.
In previous applications, we have used quantile regression methods to assess racial and ethnic disparities in health care expenditures and in mental health care expenditures across different quantiles of expenditures, adjusting for covariates.[3] In the United States, disparities in the distribution of health care expenditures between Blacks and Whites, and between Hispanics and Whites diminish in the upper quantiles of expenditure, but remain significant throughout the distribution. This same pattern of persistent disparities was still evident in the highest education and income categories.
2. What is quantile regression?
Quantile regression provides an alternative to ordinary least squares (OLS) regression and related methods, which typically assume that associations between independent and dependent variables are the same at all levels. Quantile regression is not a regression estimated on a quantile, or subsample of data as the name may suggest. Quantile methods allow the analyst to relax the common regression slope assumption. In OLS regression, the goal is to minimize the distances between the values predicted by the regression line and the observed values. In contrast, quantile regression differentially weights the distances between the values predicted by the regression line and the observed values, then tries to minimize the weighted distances.[4]–[6] Referring to Figure 2 above, estimating a 75th quantile regression fits a regression line through the data so that 90 percent of the observations are below the regression line and 25 percent are above. Alternatively, this can be viewed as weighting the distances between the values predicted by the regression line and the observed values below the line (negative residuals) by 0.5, and weighting the distances between the values predicted by the regression line and the observed values above the line (positive residuals) by 1.75. Doing so ensures that minimization occurs when 75 percent of the residuals are negative.
2.1. Describing differences across the distribution of health care expenditures
To demonstrate basic SAS software package code for implementing descriptive statistics and quantile regression, we use a sample of Black and White adults of at least 18 years of age taken from the United States 2009 Medical Expenditure Panel Survey (MEPS). This survey is conducted in a nationally representative sample of the U.S. population of non-institutionalized individuals. For ease of explanation, we drop all individuals with missing values on any of the dependent or independent variables of interest in our regression models and do not incorporate survey sampling characteristics into our estimation.
Simple descriptive statistics are useful in determining whether there are subgroup differences across the distribution of the dependent variable of interest. In the U.S., a considerable body of empirical work has focused on differences in health services use by racial group and prior studies have found that disparities impose a significant burden on racial minorities.[7],[8] In other countries, research has more commonly focused on the inequality of allocation of health care resources across socioeconomic groups.[9],[10] In our case, we look for differences between Blacks and Whites living in the U.S. across the distribution of health care expenditures (variable: totexp). Recognizing that there will be differences in any use of care, we separate out the analysis into a description of Black-White differences in any use (variable: anyexp = 1 if yes; 0 if no) and Black-White differences in health care expenditures at different quantiles conditional on any use of care: the 25th quantile, the median (50th quantile), 75th quantile, 90th quantile, and 95th quantile.
To present descriptive statistics regarding the Black-White difference in any health care expenditures is relatively straight forward in that it can be accomplished with a simple cross-tabulation of any expenditure by race and presenting the column proportions (code in SAS):
proc freq data=sap;
tables anyexp*black / chisq; run;
Descriptive statistics of expenditures conditional on having any health care expenditures can be found using the proc univariate command in SAS. The following code returns a number of quantiles of interest for health care expenditures for each race:
proc univariate data=sap (where= (white=1&anyexp=1));
var totexp; run;
proc univariatedata=sap(where=(black=1&anyexp=1));
var totexp; run;
Running these commands identifies Black-White differences in the percentage of individuals using any health care (89.1% v. 79.6% for Whites and Blacks, respectively). In addition, there are Black-White differences at the 25th quantile and the median but these differences disappear as we assess the higher quantiles of expenditures (for Whites and Blacks, respectively, at the 25th quantile: $677 v. $370; the median: $2180 v. $1388; 75th quantile: $6005 v. $5009: 90th quantile: $14,400 v. $13,991; 95th quantile: $24,091 v. $26,588).
2.2. Example of quantile regression to measure racial and ethnic differences across the distribution of health care expenditures
As is typical of these health care services use and expenditure analyses, one can use multivariate regression (i.e., OLS regression) to isolate the association of an explanatory variable on an outcome after adjusting for health status, socio-economic status characteristics or other covariates of interest. In this case, we identify racial or ethnic differences in health care expenditures, estimating a multivariate regression equation of health care expenditures conditional on a number of covariates using data from the 2009 Medical Expenditure Survey. To account for differences at the upper and lower ends of the distribution, we move beyond OLS regression, estimating quantile regression models. We use the log of total health expenditures (variable: lnexp), in order to reign in the non-linearity of the data and the multiplicative effects of predictor variables as the data approaches the heaviest users. We use the following SAS code, focusing in particular on the significance of the Black race indicator coefficient in each model:
proc logistic data=meps_sap;
model lnexp=&x; run;
proc quantreg data=meps_sap;
model lnexp=&x / quantile =.25.50.75.90.95; run;
where &x represents a vector of covariates describing respondents' race, demographics, social economic status, health status, region, and insurance type (see the SAS program used to conduct this analysis at www.saponline.org/en/home/linkurl). The model option “quantile =” specifies the quantile levels for the quantile regression. Similar coding for quantile regression is available in the Stata statistical software package (see the Stata program used to conduct this analysis at www.saponline.org/en/home/linkurl).
Results from the logit regression model demonstrate that Blacks are significantly less likely to use any health care. Quantile regression results show that Black-White disparities (as represented by the Black coefficient) are significant from the 25th through the 90th quantile, and then diminish in the upper quantiles after adjustment for covariates representing race, demographics, SES, health status, region and insurance type. Blacks were significantly less likely to use any health care than Whites (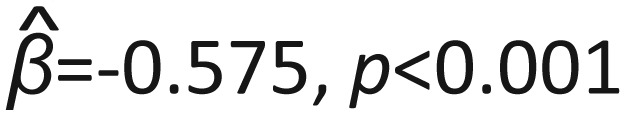 ). At the 25th, 50th, and 75th quantiles, Black expenditures were significantly less than Whites (
 ; and
; and 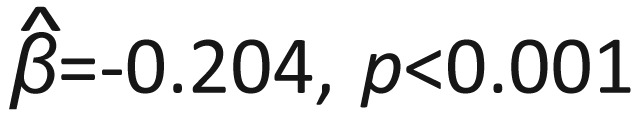 , respectively). At the 90th quantile, Black-White expenditure differences were marginally significant (
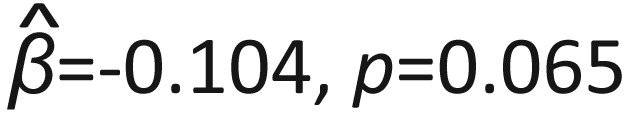 ) and at the 95th quantile, there were no significant differences between Blacks and Whites on health care expenditures.
These are only preliminary findings, but taken together the quantile regression analyses reveal interesting policy-related factors that could not be identified in typically used regression models. Disparities in expenditures conditional on access to care exist at the 25th through the 75th quantiles, but not at the upper quantiles of care, suggesting that Black-White disparities in health care expenditures are less of a concern among individuals that receive the most care (and ostensibly who are in the most need for care).
3. Advantages of quantile regression over more commonly used methods
The main advantage of quantile regression methodology is that the method allows for understanding relationships between variables outside of the mean of the data,making it useful in understanding outcomes that are non-normally distributed and that have nonlinear relationships with predictor variables. By in large, summaries from commonly used regression methods in health services and outcomes research provide information that is useful when thinking about the average patient. However, it is the complex patients with multiple comorbidities who account for most health care expenditures and present the most difficulty in providing high quality medical care. Quantile regression allows the analyst to drop the assumption that variables operate the same at the upper tails of the distribution as at the mean and to identify the factors that are important determinants of expenditures and quality of care for different subgroups of patients.
There are other methodological advantages to quantile regression when compared to other methods of segmenting data. One might argue that separate regressions could be run stratifying on different segments of the population according to its unconditional distribution of the dependent variable. For example, in the disparities analysis above, we could estimate regression models to estimate the mean expenditures for different sub-samples of the population that have low, moderate, and high spending. However, segmenting the population in this way results in smaller sample sizes for each regression and could have serious sample selection issues.[11] As opposed to such a truncated regression, the quantile regression method weights different portions of the sample to generate coefficient estimates, thus increasing the power to detect differences in the upper and lower tails.
4. Recommendations for further applications of quantile regression methods
Many opportunities for using quantile regression exist in the health services literature. For example, in an article describing quantile regression methods, Koenker and Hallock[12] describe the utility of using quantile regression to determine whether the determinants of infant low-birthweight (typically considered to be less than 2500 grams at birth) are similar for infants near the threshold compared to those at the lower tail of the birthweight distribution. Numerous similar applications arise, including determinants of weight among those that are obese versus only overweight, dietary predictors of HbA1c levels among non-diabetics, Type I or II diabetics, and those in the upper tails of glucose levels, and so forth. Using health care claims data, analysis of expenditures for high-end users can be conducted to better understand end-of-life care, acute and post-acute care, and primary care and pharmaceutical expenditures.
We encourage a wider application of these statistical methods. As computing power has increased, the computational burden for estimating quantile regression has decreased substantially to the point where results for our sample of over 10,000 subjects were completed in less than a minute. As the costs in time and effort of computing have fallen, it is becoming more and more common to check the assumption that slopes are the same or differ by examining interaction terms with observed covariates. With the time barrier less of a concern, and with easy-to-use quantile regression commands available in commonly used statistical packages, these methods will be used in an increasing range of research projects.
Biography

Benjamin Cook is Senior Scientist at the Center for Multicultural Mental Health Research (CMMHR) at the Cambridge Health Alliance and Assistant Professor in the Department of Psychiatry at Harvard Medical School. He is a health services researcher focused on reducing and understanding underlying mechanisms of racial/ethnic disparities in health and mental health care. He is currently Principal Investigator on projects that investigate the mechanisms driving healthcare disparities in episodes of mental health care, that develop state by state report cards on mental health care disparities, and that assess the relationship of tobacco use and mental health. His other research interests include improving mental health of immigrant populations, comparative effectiveness research and its influence on healthcare disparities, substance abuse treatment disparities, and healthcare equity.
Footnotes
Conflict of interest: The authors report no conflict of interest related to this manuscript.
References
- 1.Coate D, Grossman M. Effects of alcoholic beverage prices and legal drinking on youth alcohol use. Journal of Law and Economics. 1988;31:145–171. [Google Scholar]
- 2.Manning WG, Blumberg L, Moulton LH. The demand for alcohol: the differential response to price. J Health Econ. 1995;14(2):123–148. doi: 10.1016/0167-6296(94)00042-3. [DOI] [PubMed] [Google Scholar]
- 3.Cook BL, Manning WG. Measuring racial/ethnic disparities across the distribution of health care expenditures. Health Serv Res. 2009;44(5p1):1603–1621. doi: 10.1111/j.1475-6773.2009.01004.x. [DOI] [PMC free article] [PubMed] [Google Scholar]
- 4.Buchinsky M. Recent advances in quantile regression models: a practical guideline for empirical research. Journal of Human Resources. 1998;33(1):88–126. [Google Scholar]
- 5.Koenker R. Quantile Regression. Cambridge, UK: Cambridge University Press; 2005. [Google Scholar]
- 6.Koenker R, Bassett G. Regression quantiles. Econometrica. 1978;46(1):33–50. [Google Scholar]
- 7.Institute of Medicine . Unequal Treatment: Confronting Racial and Ethnic Disparities in Health Care. Washington, DC: National Academies Press; 2002. [PubMed] [Google Scholar]
- 8.U.S. Department of Health and Human Services . Mental Health: Culture, Race and Ethnicity. A Supplement to Mental Health: A Report of the Surgeon General. Rockville, Maryland: U.S Department of Health and Human Services; 2001. [Google Scholar]
- 9.van Doorslaer E, van Ourti T. Measuring inequality and inequity in health and health care. In: Glied S, Smith PC, editors. Oxford Handbook on Health Economics. Oxford: Oxford University; 2011. pp. 837–869. [Google Scholar]
- 10.Wagstaff A, van Doorslaer E. Income inequality and health: what does the literature tell us? Annu Rev Public Health. 2000;21(1):543–567. doi: 10.1146/annurev.publhealth.21.1.543. [DOI] [PubMed] [Google Scholar]
- 11.Heckman JJ. Sample selection bias as a specification error. Econometrica. 1979;47(1):153–161. [Google Scholar]
- 12.Koenker R, Hallock KF. Quantile regression. The Journal of Economic Perspectives. 2001;15(4):143–156. [Google Scholar]