

Abstract
Background
Adrenocortical carcinoma (ACC) is associated with poor survival rates. The objective of the study was to analyze ACC gene expression profiling data for prognostic biomarkers and therapeutic targets.
Methods
44 ACC and 4 normal adrenals were profiled on Affymetrix U133 Plus 2 expression microarrays. Pathway and transcriptional enrichment analysis was performed. Protein levels were determined by western blot. Drug efficacy was assessed against ACC cell lines. Previously published expression datasets were analyzed for validation.
Results
Pathway enrichment analysis identified marked dysregulation of cyclin-dependent kinases and mitosis. Over-expression of PTTG1, which encodes securin, a negative regulator of p53, was identified as a marker of poor survival. Median survival for patients with tumors expressing high PTTG1 levels (log2 ratio of PTTG1 to average beta-actin <-3.04 ) was 1.8 years compared to 9.0 years if tumors expressed lower levels of PTTG1 (P<0.0001). Analysis of a previously published data set confirmed the association of high PTTG1 expression with a poor prognosis. Treatment of two ACC cell lines with vorinostat decreased securin levels and inhibited cell growth (IC50s of 1.69 uM and 0.891 uM, for SW-13 and H295R, respectively).
Conclusion
Over-expression of PTTG1 is correlated with poor survival in ACC. PTTG1/securin is a prognostic biomarker and warrants investigation as a therapeutic target.
Introduction
Adrenocortical carcinoma (ACC) is an aggressive malignancy with a poor overall 5-year survival rate of 39% in patients undergoing surgical resection.i Complete surgical excision is the only treatment that offers the potential for a cure. Unfortunately, as many as 50% of patients have metastases at the time of diagnosis.ii Of those patients who undergo surgical resection, as many as 80% will develop a recurrence of their cancers.iii Patients with recurrent or metastatic disease have limited chemotherapeutic options. In the recently reported FIRM-ACT trial, the combination of doxorubicin, etoposide, cisplatin and mitotane yielded a response rate of only 23.2% and median survival of 14.8 months.iv The development of new and more effective treatments depends on an improved understanding of the molecular pathogenesis of the disease. Identification of the critical oncogenic pathways in ACC could lead to more precisely targeted and effective treatments. Previous gene expression studies have focused on identifying gene expression signatures that differentiate ACC from benign adrenal adenomas and normal adrenal tissue, and the sample sets have included both early and advanced cancers.v,vi,vii,viii To date, no single gene or pathway has emerged from these analyses as a key prognostic marker or therapeutic target in ACC.
In this study, we sought to identify novel potential prognostic markers and novel therapeutic targets through an analysis of the expression profiles of 44 ACC tumors. We identified dysregulation of the G2/M checkpoint of the cell cycle in ACC. Several genes involved in G2/M transition showed coordinate expression with cyclin-dependent kinase 1 (CDK1). Amongst these concordant genes, we found a strong correlation of poor survival with over-expression of pituitary tumor-transforming gene-1 (PTTG1). Targeting the PTTG1 gene product securin, with vorinostat resulted in ACC cell line growth inhibition suggesting that it is a potential therapeutic target.
Materials and Methods
Clinical Samples
A set of 44 ACC flash frozen tumors and 4 normal whole adrenal glands were collected at the Mayo Clinic in Rochester, Minnesota, the University Hospital Essen (Essen, Germany), the University of Calgary (Alberta, Canada), and Scottsdale Healthcare (Scottsdale, Arizona), as well as donated directly by patients through their community care settings. Uninvolved normal adrenal gland tissues were obtained during autopsy. Research materials were obtained under protocols approved by the Western Institutional Review Board. The diagnosis of ACC was confirmed by review of the pathology report and when necessary by an experienced endocrine pathologist (RAK) re-examining the histopathology. Stage was defined using the European Network for the Study of Adrenal Tumors Classification 2008, based on the number of mitosis per high-power field (HPF), presence or absence of necrosis, and presence or absence of atypical mitosis.ix Grade 1 was defined by <5 mitosis per 50 HPF, no evidence of necrosis or atypical mitosis. Grades 2-4 all had evidence of necrosis and atypical mitosis and as were distinguished by number of mitosis per HPF. Grade 2 had 5-20 mitosis per 50 HPF; grade 3, 21-50 per 50 HPF; grade 4, > 50/50 HPF. A Weiss scorex was unavailable in previous pathology notes and was unable to be assessed prospectively because of a limited number of available histology slides in our retrospective series. Additional pooled normal adrenal RNA was obtained commercially (BioChain Institute Inc, Newark CA).
Expression Analysis
RNA was extracted from 100 mg samples of ACC tumors and normal adrenal tissue, amplified and reverse transcribed utilizing the MessageAmp II Biotin Enhanced Kit (Ambion Life Technologies Corp, Carlsbad CA). Biotin-labeled cRNA was synthesized according to this standard protocol, followed by purification through provided cRNA Filter Cartridges. Labeled cRNA was fragmented and hybridized to Affymetrix U133 Plus 2 human genome arrays following the standard Affymetrix protocol (Affymetrix Inc., Santa Clara CA). Scanning and washing was completed on the Fluidic Stations FS450 and the GeneChip® Scanner 3000 with Workstation. Validation of the initial expression profiles was done via both hybridization to a different microarray platform and RT-qPCR. Data for ACC 30 – ACC 150 was generated from chipped samples sent to Clinical Reference Laboratory (Lenexa, KS) for RNA extraction and array processing.
Statistical Analysis
Array quality for ACC 1 – 28, MPI 1-3, and the normal samples was assessed using the Affy QCReport package in Bioconductor and the R statistical language. All arrays passed the quality controls at the site the assays were performed. All subsequent data normalization and statistical analysis was done using GenePattern (Broad Institute, www.broadinstitute.org).xi Expression array data was normalized by gcRMA with quantile normalization and background subtraction after using the Expression File Creator.xii Data was then floored at 5.5 using Preprocess Dataset, and filtered to remove 1) probes with more than 35 floored values and/or 2) probes where all values from one batch were floored while values from the other batch were not. Further batch effects were minimized using ComBat with the parametric option.xiii Differentially expressed genes were determined using a T-test with multiple comparison correction as implemented by Comparative Marker Selection in Gene Pattern. Genes with the corrected p-value < 0.005 and the FDR < 0.075 were selected for further study. For comparing high to low grade or primary to recurrence, the FDR cut-off was increased to < 0.13. Survival analysis was conducted using Prism 6 (GraphPad) to generate Kaplan-Meier curves that were compared by log-rank. The data discussed in this publication have been deposited in NCBI’s Gene Expression Omnibus and are accessible through GEO Series accession number GSE19776 (http://www.ncbi.nlm.nih.gov/geo/query/acc.cgi?acc=GSE19776). Reviewer link: http://www.ncbi.nlm.nih.gov/geo/query/acc.cgi?token=lnkbluyayiqocto&acc=GSE19776
Integration of data with previously published data sets
Previously reported data from the expression profiling on Affymetrix U133 Plus 2 microarrays of normal adrenal glands, adrenal adenomas, and ACCs as reported by Giordano, et al.7 was downloaded from GEO. Other datasets in the literature were not annotated with survival so they could not be used. The data was filtered to include only that from normal adrenal glands and ACCs from patients over the age of 18. Using Gene Pattern11 this data was normalized by gcRMA12 with quantile normalization and background subtraction using Expression File Creator. Expression values for probes corresponding to PTTG1 and beta-actin (203554_x_at, AFFX-HSAC07/X00351_5_at, and AFFX-HSAC07/X00351_M_at) were extracted and compared to survival as above. Prism 6 was also used to calculate t-tests to compare PTTG1/beta-actin ratios between previously reported clusters as well as to compare the survival distributions between our cohort and the cohort from Giordano, et al.7
RT-PCR validation
Total RNA was reverse transcribed utilizing random hexamer primers and the iScript cDNA Synthesis kit (Bio-Rad Laboratories, Inc., Hercules CA). The resulting cDNA was amplified on the iQ5 Real-Time PCR Detection System (Bio-Rad Laboratories, Inc., Hercules CA) using the iScript RT-PCR Kit with SYBR green and gene specific primers designed to span the closest intron-exon junction of the reference sequence to which the probes on the array were designed (Table 1). For amplification, the following program was employed: a 50°C preheat step for 2 min., a 95°C heat activation step for 2 min., followed by 40 cycles of denaturation at 95°C for 15 sec., annealing at the appropriate temperature (Table 1) for 30 sec., and elongation at 72°C for 30 sec. Melting curve analysis was performed to evaluate primer set specificity. Beta-actin was used as the reference gene. Fold difference in cDNA concentration was calculated using the Pfaffl method taking into account reaction efficiencies.xiv
| Gene | Reference Sequence | Forward | Reverse | Annealing Temperature (°C) |
|---|---|---|---|---|
| E2F1 | NM_005225 | TGC TCT CCG AGG ACA CTG ACA GCC A | GGA GGG GCT TTG ATC ACC ATA ACC A | 59 |
| SPARC | NM_003118 | TCT GAC TGA GAA GCA GAA GCT GCG G | CCG AAC TGC CAG TGT ACA GGG AAG A | 62 |
| CDC2 | NM_001786 | CAG GAA GCC TAG CAT CCC ATG TC | CCA GAA ATT CGT TTG GCT GGA TC | 59 |
| BIRC5 | NM_001168 | CCC TTG GTG AAT TTT TGA AAC TGG A | GCA CTT TCT CCG CAG TTT CCT CAA A | 59 |
| TOP2A | NM_001067 | TCC TCC CCT CTG AAT TTA GTT TGG G | AAA CAA TGC CCA TGA GAT GGT CAC T | 62 |
| IGF2 | NM_000612 | CCA AGT CCG AGA GGG ACG TGT CGA | TGG AAG AAC TTG CCC ACG GGG | 59 |
| IGF1R | NM_000875 | CCA ACG AGC AAG TCC TTC GCT TCG | GGG TTA TAC TGC CAG CAC ATG CGC | 59 |
Pathway and transcriptional regulation analysis
Both pathway enrichment and transcriptional regulation for differentially expressed genes were analyzed using MetaCore (Thompson Reuters, New York NY). Data were analyzed by Gene Set Enrichment Analysis (www.broadinstitute.org/gsea/index.jsp)xv using curated gene sets corresponding to Gene Ontology categories followed by Leading Edge analysis of the enriched categories, or if that was a small number, categories with nominal p-values < 0.05, to identify genes whose expression drove enrichment.
Western blot analysis
Cells were plated in 100 mm dishes and allowed to adhere for 24 hours. Cells were then exposed to compound for 24 hours. At 24 hours, cells were lysed with RIPA buffer, and the resulting protein lysate quantitated by BCA (Thermo Fisher Scientific, Rockford IL). Thirty micrograms of protein per lane was loaded on 4-12% denaturing polyacrylamide gels, separated by gel electrophoresis, and transferred to PVDF membranes. Membranes were blocked by incubation in TBST (50 mM Tris.HCl, pH 7.4, 150 mM NaCl, 0.1% Tween 20) with 5% dry milk for 1 hour at room temperature and incubated overnight with primary antibody in TBST with 1% milk at 4°C. Membranes were washed five times in TBST for 3 minute each, and then incubated with horseradish perioxidase conjugated secondary antibody diluted 1:5,000 in 5% milk-TBST. Signal was developed using Western Lightening Plus ECL (Perkin-Elmer, Waltham MA) and visualized with Bio Spectrum 500 Imaging System with LM-26 and BioChemi 500 Camera f/1.2 P/N 97-0362-01 (UVP Cambridge UK). The primary antibodies used were securin (ab3305, Abcam, Cambridge MA) and anti-beta-actin (#4967, Cell Signaling Technology, Danvers MA). Semi-quantitative analysis was performed using Image J9 software and reported as a ratio of securin to beta-actin.
In vitro drug dose response curves
Human ACC cell lines were obtained from American Type Culture Collection (ATCC). NCI-H295R cells were plated at a density of 1750 cell/well in 40 L of DMEM/F12 with 2.5% NuSerum™ (Becton, Dickinson and Company, Franklin Lakes NJ). SW-13 cells were plated at 1250 cells/wells in 40 L DMEM with 2% FBS. Twenty-four hours after plating, serial dilutions of test compounds in 10 L of medium were added in replicates of 20 to the plates. Cells were then incubated for an additional 48, 72, 96, or 120 hours at 37°C in a humidified incubator. Viability was assessed by CellTiter-Glo® (Promega, Madison WI) and converted to normalized percent viability after normalizing to cells alone and with drug carrier, DMSO. Dose response curves and IC50 values for cell survival in the presence of the drugs were calculated using Prism5 software (graphpad.com) using the log (inhibitor) vs. response – 4 parameter function which fits the following equation: Y=Bottom + (Top- Bottom)/(1+10^(X-LogIC50)) where X is the logarithm of concentration and Y is the percent cell survival.
Results
Clinical Parameters
Forty-four adrenocortical cancers were included in our analysis (Table 2). These samples were obtained from 27 women and 16 men with a median age of 52.5 years (range 20 to 72.1) and included a primary and metastasis pair from one female patient. The median size of the tumors was 9.25 cm (2.5 cm – 19 cm), and the median weight of the tumors was 230 g (22 g – 2310 g). The median survival of the patients was 3.05 years (0 – 18 years).
| Sample* | Gender | Age (years) |
Survival (years) |
Tumor Size (cm) |
Tumor Weight (g) |
Tumor Stage | Tumor Grade |
|---|---|---|---|---|---|---|---|
| ACC 4 | F | 56.7 | 5.9 | NA | NA | Recurrence | NA |
| ACC 5* | F | 23.3 | 3.0 | 19 | 1100 | 2 | 3 |
| ACC 8* | F | 56.5 | 0.6 | 9 | 190 | 4 | 4 |
| ACC 9* | M | 53.2 | 9.0 | 8 | 195 | 3 | 2 |
| ACC 10* | M | 67.8 | 1.7 | 7.6 | 150 | 2 | 4 |
| ACC 11* | F | 54.2 | 18 | 15 | 890 | 2 | 1 |
| ACC 12* | M | 72.1 | 0.4 | 9.5 | 175 | 4 | 4 |
| ACC 13* | M | 46.9 | 0.1 | 12 | 235 | 4 | 4 |
| ACC 17* | F | 26.7 | 16.6 | 3 | NA | Recurrence | 4 |
| ACC 19* | M | 48.5 | 3.1 | 9 | 195 | 2 | 3 |
| ACC 21* | F | 36.9 | 13.8 | 6.5 | NA | Recurrence | 4 |
| ACC 22* | F | 67.3 | 6.4 | 10 | 230 | 2 | 2 |
| ACC 23* | F | 27.7 | 9.8 | 8 | 149 | 2 | 2 |
| ACC 26* | F | NA | NA | NA | NA | 2 | 3 |
| ACC 27* | M | NA | NA | NA | NA | Recurrence | 2 |
| ACC 28* | F | 58 | NA | 9 | 153.8 | 1 | 2 |
| MPI1 | M | 42.0 | 14+ | NA | NA | Recurrence | NA |
| MPI2 | F | 46.0 | NA | NA | NA | NA | NA |
| MPI3* | F | 37.0 | NA | NA | NA | 3 | 2 |
| ACC 30 | F | 20 | NA | 18 | NA | NA | 1 |
| ACC 31 | F | 68 | 1.583 | NA | NA | Recurrence | 2 |
| ACC 32 | F | 45 | NA | NA | NA | Recurrence | NA |
| ACC 35 | M | 46 | NA | 16.0 | 1463 | 4 | NA |
| ACC 45 | F | 32 | NA | 11 | 106 | 2 | 1 |
| ACC 47 | M | 43 | NA | 4 | 60 | Recurrence | 1 |
| ACC 48 | F | 45 | NA | NA | NA | 4 | NA |
| ACC 51 | M | 40 | NA | 12 | 480 | NA | 2 |
| ACC 59 | M | 52 | NA | 19.0 | 2310 | NA | NA |
| ACC 61 | F | 60 | NA | 8.8 | 392 | 3 | NA |
| ACC 84 | F | 27 | NA | 9.5 | 300 | NA | 1 |
| ACC 85 | M | 70 | NA | 9.0 | 272 | NA | 1 |
| ACC 112 | F | 53 | NA | NA | NA | 4 | NA |
| ACC 114 | F | NA | NA | NA | NA | Recurrence | NA |
| ACC 115 | F | 58 | NA | NA | NA | Recurrence | NA |
| ACC 117 | M | 57 | 3+ | 4.0 | 39 | 1 | 1 |
| ACC 118 | M | 59 | 7.583 | 2.5 | NA | Recurrence | NA |
| ACC 123 | F | 59 | NA | 10 | 22 | 4 | NA |
| ACC 129 | F | 55 | 0.583 | 10.5 | 277 | 2 | 4 |
| ACC 132 | F | 51 | 6+ | 14.5 | 325 | Recurrence | 2 |
| ACC 134 | F | 53 | 2.083 | 14.5 | 1243 | Recurrence | NA |
| ACC 136 | M | 69 | 2.83 | 7.8 | NA | Recurrence | NA |
| ACC 140 | M | 63 | 2.08+ | 7.8 | 132 | 4 | 4 |
| ACC 149 | F | 28 | NA | NA | NA | 4 | NA |
| ACC 150 | NA | NA | NA | NA | NA | Liver Metastasis from ACC 149 |
NA |
Sample previously reported in Stephan, et al, 2008
Alive at last follow-up
NA - not available
Expression Analysis
Differential gene expression analysis revealed that 1843 probes representing 1485 genes were differentially expressed between ACC and normal. The top 50 over- and under-expressed probes, along with the log2 fold-change are given in Table 3. Pathway enrichment analysis demonstrated that there dysregulation in G2/M transition was enriched in ACC (Figure 1). This dysregulation focused on the sister chromatid adhesion and homologous recombination DNA repair. To determine whether the G2/M signature that we observed in the ACC samples was overwhelming our ability to detect other pathways, we used the 70 gene signature of chromosomal instability (CIN70)xvi as a proxy, removed these genes from the data, and re-ran our analysis. The results from these analyses indicated that while normal adrenal tissue is enriched for both IGF1R and EGFR signaling, ACCs continue to retain evidence of cell cycle perturbations that become more pronounced with increasing tumor grade (Figure 2).
| Probe ID | Gene | Score | P-value | FDR | Fold-change | Direction |
|---|---|---|---|---|---|---|
| 207169_x_at | DDR1 | 10.24 | 0.002 | 0.052 | 11.47 | ACC |
| 203677_s_at | TARBP2 | 10.01 | 0.002 | 0.052 | 4.64 | ACC |
| 242108_at | 9.93 | 0.002 | 0.052 | 10.56 | ACC | |
| 232135_at | SAP30L | 9.93 | 0.002 | 0.052 | 4.27 | ACC |
| 218389_s_at | APH1A | 9.76 | 0.002 | 0.052 | 1.77 | ACC |
| 214163_at | HSPB11 | 9.71 | 0.002 | 0.052 | 3.67 | ACC |
| 225191_at | CIRBP | 9.36 | 0.002 | 0.052 | 26.62 | ACC |
| 55872_at | ZNF512B | 9.33 | 0.002 | 0.052 | 4.47 | ACC |
| 239516_at | 9.32 | 0.002 | 0.052 | 5.36 | ACC | |
| 1556821_x_at | DLEU2 | 9.28 | 0.002 | 0.052 | 8.09 | ACC |
| 212913_at | MSH5 | 9.26 | 0.002 | 0.052 | 7.66 | ACC |
| 212849_at | AXIN1 | 9.26 | 0.002 | 0.052 | 1.67 | ACC |
| 91952_at | DCAF15 | 9.25 | 0.002 | 0.052 | 3.76 | ACC |
| 202253_s_at | DNM2 | 9.09 | 0.002 | 0.052 | 4.02 | ACC |
| 226072_at | FUK | 9.00 | 0.002 | 0.052 | 2.64 | ACC |
| 227670_at | ZNF75A | 8.98 | 0.002 | 0.052 | 3.57 | ACC |
| 209675_s_at | HNRNPUL1 | 8.97 | 0.004 | 0.068 | 2.12 | ACC |
| 1555575_a_at | KDELR1 | 8.94 | 0.002 | 0.052 | 1.74 | ACC |
| 218494_s_at | SLC2A4RG | 8.93 | 0.002 | 0.052 | 7.85 | ACC |
| 235984_at | 8.87 | 0.002 | 0.052 | 5.34 | ACC | |
| 212194_s_at | TM9SF4 | 8.85 | 0.002 | 0.052 | 7.38 | ACC |
| 227129_x_at | FLJ45340 | 8.84 | 0.002 | 0.052 | 3.55 | ACC |
| 219818_s_at | GPATCH1 | 8.83 | 0.002 | 0.052 | 2.28 | ACC |
| 202496_at | EDC4 | 8.80 | 0.002 | 0.052 | 2.08 | ACC |
| 222843_at | FIGNL1 | 8.78 | 0.002 | 0.052 | 6.15 | ACC |
| 230142_s_at | CIRBP | 8.77 | 0.002 | 0.052 | 15.08 | ACC |
| 224982_at | AKT1S1 | 8.73 | 0.002 | 0.052 | 2.10 | ACC |
| 228392_at | ZNF302 | 8.70 | 0.002 | 0.052 | 10.59 | ACC |
| 1557558_s_at | LOC100129196 | 8.66 | 0.002 | 0.052 | 1.83 | ACC |
| 242563_at | 8.66 | 0.002 | 0.052 | 2.62 | ACC | |
| 224709_s_at | CDC42SE2 | 8.63 | 0.002 | 0.052 | 2.40 | ACC |
| 228138_at | ZNF498 | 8.60 | 0.002 | 0.052 | 3.01 | ACC |
| 221818_at | INTS5 | 8.58 | 0.004 | 0.068 | 1.60 | ACC |
| 219947_at | CLEC4A | 8.55 | 0.002 | 0.052 | 2.62 | ACC |
| 229473_at | MAMDC4 | 8.54 | 0.002 | 0.052 | 23.81 | ACC |
| 223589_at | ZNF416 | 8.51 | 0.002 | 0.052 | 2.04 | ACC |
| 227413_at | UBLCP1 | 8.50 | 0.002 | 0.052 | 1.83 | ACC |
| 224639_at | SPPL3 | 8.49 | 0.002 | 0.052 | 2.47 | ACC |
| 214550_s_at | TNPO3 | 8.46 | 0.002 | 0.052 | 2.82 | ACC |
| 202892_at | CDC23 | 8.43 | 0.002 | 0.052 | 2.93 | ACC |
| 224687_at | ANKIB1 | 8.41 | 0.002 | 0.052 | 1.73 | ACC |
| 225899_x_at | FLJ45445 | 8.38 | 0.002 | 0.052 | 3.93 | ACC |
| 208779_x_at | DDR1 | 8.37 | 0.002 | 0.052 | 4.56 | ACC |
| 235241_at | SLC38A9 | 8.29 | 0.002 | 0.052 | 5.12 | ACC |
| 232810_at | AIG1 | 8.29 | 0.002 | 0.052 | 2.18 | ACC |
| 206854_s_at | MAP3K7 | 8.26 | 0.002 | 0.052 | 1.79 | ACC |
| 202726_at | LIG1 | 8.23 | 0.002 | 0.052 | 3.73 | ACC |
| 39313_at | WNK1 | 8.23 | 0.002 | 0.052 | 2.98 | ACC |
| 238775_at | 8.20 | 0.002 | 0.052 | 2.87 | ACC | |
| 239264_at | 8.15 | 0.002 | 0.052 | 2.89 | ACC | |
| 220795_s_at | BEGAIN | −7.25 | 0.002 | 0.052 | 2.37 | Normal |
| 208991_at | STAT3 | −7.32 | 0.002 | 0.052 | 1.82 | Normal |
| 231773_at | ANGPTL1 | −7.39 | 0.004 | 0.068 | 3.91 | Normal |
| 202359_s_at | SNX19 | −7.42 | 0.002 | 0.052 | 1.72 | Normal |
| 225029_at | LOC550643 | −7.47 | 0.004 | 0.068 | 1.61 | Normal |
| 221885_at | DENND2A | −7.53 | 0.004 | 0.068 | 1.39 | Normal |
| 224281_s_at | NGRN | −7.55 | 0.002 | 0.052 | 1.71 | Normal |
| 209612_s_at | ADH1B | −7.58 | 0.002 | 0.052 | 4.90 | Normal |
| 223582_at | GPR98 | −7.67 | 0.002 | 0.052 | 7.42 | Normal |
| 224997_x_at | H19 | −7.74 | 0.002 | 0.052 | 5.38 | Normal |
| 224710_at | RAB34 | −7.89 | 0.004 | 0.068 | 3.42 | Normal |
| 206050_s_at | RNH1 | −7.89 | 0.002 | 0.052 | 1.82 | Normal |
| 224061_at | INMT | −8.05 | 0.002 | 0.052 | 7.80 | Normal |
| 200059_s_at | RHOA | −8.17 | 0.002 | 0.052 | 1.56 | Normal |
| 202524_s_at | SPOCK2 | −8.17 | 0.002 | 0.052 | 3.33 | Normal |
| 225185_at | MRAS | −8.22 | 0.002 | 0.052 | 3.62 | Normal |
| 211959_at | IGFBP5 | −8.28 | 0.002 | 0.052 | 5.16 | Normal |
| 200006_at | PARK7 | −8.29 | 0.002 | 0.052 | 1.38 | Normal |
| 209960_at | HGF | −8.32 | 0.002 | 0.052 | 5.05 | Normal |
| 214610_at | CYP11B1 | −8.43 | 0.002 | 0.052 | 3.16 | Normal |
| 202291_s_at | MGP | −8.61 | 0.002 | 0.052 | 3.63 | Normal |
| 201601_x_at | IFITM1 | −8.69 | 0.002 | 0.052 | 3.17 | Normal |
| 203088_at | FBLN5 | −8.78 | 0.002 | 0.052 | 3.74 | Normal |
| 214091_s_at | GPX3 | −8.85 | 0.002 | 0.052 | 5.14 | Normal |
| 212203_x_at | IFITM3 | −8.85 | 0.002 | 0.052 | 2.14 | Normal |
| 210058_at | MAPK13 | −8.95 | 0.002 | 0.052 | 2.87 | Normal |
| 221622_s_at | TMEM126B | −8.97 | 0.002 | 0.052 | 1.66 | Normal |
| 37022_at | PRELP | −8.98 | 0.002 | 0.052 | 3.26 | Normal |
| 226224_at | FOXK2 | −9.05 | 0.002 | 0.052 | 2.31 | Normal |
| 201315_x_at | IFITM2 | −9.13 | 0.002 | 0.052 | 2.61 | Normal |
| 206294_at | HSD3B2 | −9.18 | 0.002 | 0.052 | 4.55 | Normal |
| 217845_x_at | HIGD1A | −9.20 | 0.002 | 0.052 | 2.05 | Normal |
| 202224_at | CRK | −9.20 | 0.002 | 0.052 | 1.75 | Normal |
| 203225_s_at | RFK | −9.22 | 0.002 | 0.052 | 1.83 | Normal |
| 212361_s_at | ATP2A2 | −9.25 | 0.002 | 0.052 | 2.24 | Normal |
| 201445_at | CNN3 | −9.77 | 0.002 | 0.052 | 2.11 | Normal |
| 205952_at | KCNK3 | −9.89 | 0.002 | 0.052 | 2.70 | Normal |
| 225987_at | STEAP4 | −10.04 | 0.002 | 0.052 | 5.61 | Normal |
| 218706_s_at | GRAMD3 | −10.20 | 0.002 | 0.052 | 2.66 | Normal |
| 225148_at | RPS19BP1 | −10.25 | 0.002 | 0.052 | 2.61 | Normal |
| 203650_at | PROCR | −10.61 | 0.002 | 0.052 | 2.77 | Normal |
| 221486_at | ENSA | −10.97 | 0.002 | 0.052 | 1.81 | Normal |
| 225809_at | PARM1 | −11.82 | 0.002 | 0.052 | 5.99 | Normal |
| 239451_at | −13.35 | 0.002 | 0.052 | 4.12 | Normal | |
| 227654_at | FAM65C | −13.36 | 0.002 | 0.052 | 4.64 | Normal |
| 61297_at | CASKIN2 | −13.73 | 0.002 | 0.052 | 2.00 | Normal |
| 209505_at | NR2F1 | −13.78 | 0.002 | 0.052 | 3.89 | Normal |
| 212103_at | KPNA6 | −14.60 | 0.002 | 0.052 | 1.74 | Normal |
| 201348_at | GPX3 | −15.03 | 0.002 | 0.052 | 5.23 | Normal |
| 236677_at | NGB | −19.10 | 0.002 | 0.052 | 6.46 | Normal |
Figure 1.

The top 10 pathway maps enriched for differentially expressed genes between ACC and normal center on cell cycle control, particularly the G2/M transition.
Figure 2.

Various aspects of cell cycle control dominate the top 10 maps enriched for differentially expressed genes between high (grades 3 and 4) and low grade (grades 1 and 2) ACC.
Metacore was used to examine the data for evidence of specific transcription factor involvement. We determined that Sp1, HNF4α, p53, and c-myc play a role in the transcriptional program of ACC. In particular, we observed that the majority of genes repressed by p53 are over-expressed, while expression genes enhanced by p53 are reduced in ACC samples (Figure 3). Most genes that are targets of HNF4α are increased in their expression, while targets of Sp1 are primarily repressed. Targets of c-myc are dysregulated but not in an obviously coherent fashion.
Figure 3.

p53 regulation of differentially expressed genes in ACC is aberrant. Genes that should be negatively regulated by p53, as indicated by the red arrows, are predominantly over-expressed, indicated by red circles as adjacent to the gene names. Blue circles indicate appropriate under-expression(A). Genes that should be positively regulated by p53, indicated by the green arrows, are often under-expressed as indicated by the blue circles next to the gene name (B).
Survival analysis
Our analysis identified perturbations of the p53 pathway and significant dysregulation of the G2/M transition. Subsequently, we decided to examine genes showing coordinate expression with CDK1/p34, the primary cyclin-dependent kinase of the G2/M transition, for association with survival. We identified PTTG1 as showing coordinate expression with CDK1 and found over-expression to inversely correlate with survival (Figure 4). Median survival for patients with tumors expressing high PTTG1 levels (log2 value of PTTG1 to average beta-actin > −3.04) was 1.83 years compared to 9.0 years if tumors expressed lower levels (p<0.0001). This association was replicated in our analysis of the Giordano dataset (Figure 5).7 While the difference in survival is not significant (Figure 5A), we observed that the mean expression of PTTG1 did differ significantly based on cluster membership which the authors reported had a survival difference (Figure 5B). This suggested that the signal in this data set was attenuated. Looking at the survival data, it became clear that the cohort of patients analyzed lacked long-term survivors, thus explaining the results (Figure 5C). When we analyzed the two data sets together, the significant correlation with survival remained (p=0.004, Figure 5D).
Figure 4.

Expression of high levels of PTTG1 is associated with poor survival in ACC. Hazard ratio by logrank was 3.38 (confidence interval 2.26-13.11)
Figure 5.

Expression of high levels of PTTG1 is associated with poor survival in the data from Giordano et al.7 A and B) Kaplan Meier analysis of survival based on PTTG1 expression was not different (p=0.204, hazard ratio by logrank was 1.87, 95% confidence interval 0.72-4.82). However, the authors did identify two cohorts of patients having differences in survival based on gene expression analysis. The mean expression level of PTTG1 was significantly higher in the cluster exhibiting poor survival (student’s t-test, p = 0.0249). C) The cohort of patients presented in this report have significantly better survival that that of the cohort of patients of Giordano, et al., with the Giordano cohort having fewer long-term survivors, possibly due to the referral nature of this center’s practice. D) Combining the data from both cohorts demonstrates a significant association of PTTG1 levels with survival. Hazard ratio by logrank was 3.38 (95% confidence interval 2.26-13.11)
Pathway-based treatment studies
Several chemotherapeutic agents target proteins involved in the G2/M transition. The lack of association between the proteins involved in the G2/M transition with either aneuploidy or cell cycle perturbations in our data suggested to us the possibility that the up-regulation of the G2/M pathway was indicative of vulnerability in the pathway. To investigate whether PTTG1/securin could represent a novel therapeutic target, we treated two ACC cell lines, SW-13 and H295R, with the histone deacytlase inhibitor, vorinostat, which has previously been shown to decrease PTTG1 expression and securin levels in colorectal cells.xvii Vorinostat inhibited cell growth with IC50 values of 1.69 M and 0.891 M, for SW-13 and H295R, respectively. Vorinostat also resulted in a concentration dependent decrease in securin protein levels in both cell lines (Figure 6).
Figure 6.
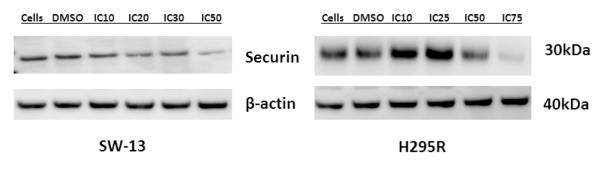
Exposure of ACC cell lines to vorinostat results in a reduction in the levels of securin protein. The ACC cell lines, SW-13 and H295R were exposed to concentrations of vorinostat that resulted in the inhibition of growth of the percentage of cells indicated. Securin levels decreased as the concentration of vorinostat increased.
Discussion
In this study of 44 ACC tumors, we implicate aberrations in the p53 pathway and dysregulation of cell cycle progression though G2/M to be involved in the pathogenesis of ACC. We examined genes showing coordinate expression with the primary cyclin-dependent kinase of the G2/M transition, CDK1/p34, for interaction with p53 and association with survival. PTTG1 was coordinately expressed with CDK1. Over-expression of PTTG1 was observed in 84 % of ACC samples and was significantly associated with poor survival (P <0.0001). We applied our analysis to the previously published data of Giordano, et al.7 treating this data as a validation set. When we combined our data with that of the Giordano set, our findings remained. Due to the absence of annotation with survival information, our findings linking PTTG1 to survival could not be verified by analysis of other published datasets including that of deReynies et al.6 PTTG1 over-expression has been reported in multiple tumor types including those of the pituitary, breast, thyroid, ovarian, uterine, colon, and lung,xviii and has been associated with increased invasion and vascularity.xix It has also been implicated as a “signature gene” for metastatic disease.xx
PTTG1 encodes the protein securin. Securin suppresses both the transcriptional activity of p53 and p53 mediated apoptosis.xxi Securin is involved in G2M transition, regulating the transition into M-phase and sister chromatid separation.xxii Securin is also involved in the nonhomologous end-joining DNA repair pathway.22 PTTG1 also interacts with both Sp1, and c-myc, two of the other specific transcription factors identified by our analysis to be involved in ACC pathogenesis. PTTG1 and Sp1 act coordinately to increase cyclin D and promote G1/S phase transition independent of p21.xxiii Sp1 also binds a PTTG1 promotor sequence thereby regulating PTTG1 expression.23 Furthermore, PTTG1 serves as transcription activator of the c-myc oncogene.xxiv Taken together, these findings suggest how PPTG1 expression may influence ACC progression.
In order to study whether targeting PTTG1/securin could have therapeutic efficacy, we used the vorinostat, a histone deacetylase, HDAC, inhibitor, vorinostat. We chose a HDAC inhibitor because they have been shown to decrease PTTG1 gene expression and securin protein levels in colorectal cell lines.17 Vorinostat is currently approved to treat cutaneous T-cell lymphoma thus making it an attractive agent for rapid clinical translation. Treating two ACC cell lines with vorinostat decreased securin levels and inhibited cell growth. PTTG1/securin has been targeted, in vitro and in vivo, with short interfering RNA (si-RNA) with resulting inhibition of tumor growth.xxv Because of the indirect mechanism of action of vorinostat on securin levels, we cannot rule out additional contributions of HDAC inhibition to the observed loss in viability. Nevertheless, our findings suggest that drugs targeting PTTG1/securin should be investigated for a potential therapeutic utility in ACC.
In summary, our expression profiling analyses in ACC have identified the G2/M transition and in particular, sister chromatid adhesion and separation, as perturbed in ACC. The finding of p53 transcriptional enrichment highlights the importance of this pathway in ACC. Increased expression of PTTG1, which plays a role in both sister chromatid adhesion and p53 regulation, was associated with poor prognosis in our samples. Taken together, these results suggest ACC pathogenesis is driven in part by deficiencies in p53 pathway function, with vulnerabilities in the G2/M transition that may expose viable therapeutic targets, including potentially PTTG1. Further investigation into the role PTTG1 over-expression in the pathogenesis of ACC and validation of PTTG1/securin as a prognostic marker or potential therapeutic target is warranted.
Acknowledgements
Support provided by the ATAC Research Fund and the Kirsten’s Legacy Fund.
The authors are grateful for the adrenal samples provided by Drs. Janice Paseika (Calgary, AB), Andrea Frilling (London, England), S. Michael Roe (Chattangooga, TN) and Jeffrey Van Lier Ribbink (Scottsdale, AZ). The authors also thank Jung-Han Kim, M.D., Erica Dastrup, Kathleen Schwartz, David Decker, and Aditi Bapat, Ph.D. for technical assistance.
Footnotes
Publisher's Disclaimer: This is a PDF file of an unedited manuscript that has been accepted for publication. As a service to our customers we are providing this early version of the manuscript. The manuscript will undergo copyediting, typesetting, and review of the resulting proof before it is published in its final citable form. Please note that during the production process errors may be discovered which could affect the content, and all legal disclaimers that apply to the journal pertain.
References
- i.Bilimoria KY, Shen WT, Elaraj D, Bentrem DJ, Winchester DJ, Kebebew E, et al. Adrenocortical carcinoma in the United States: treatment utilization and prognostic factors. Cancer. 2008;113:3130–6. doi: 10.1002/cncr.23886. [DOI] [PubMed] [Google Scholar]
- ii.Demeure MJ, Somberg LB. Functioning and nonfunctioning adrenocortical carcinoma. Surg Oncol Clin North Am. 1998;7:791–805. [PubMed] [Google Scholar]
- iii.Terzolo M, Berruti A. Adjunctive treatment of adrenocortical carcinoma. Curr Opin Endocrrinol Diabetes Obes. 2008;15:221–6. doi: 10.1097/MED.0b013e3282fdf4c0. [DOI] [PubMed] [Google Scholar]
- iv.Fassnacht M, Terzolo M, Allolio B, Baudin E, Haak H, Berruti A, et al. Combination chemotherapy in advanced adrenocortical carcinoma. N Engl J Med. 2012;366:2189–97. doi: 10.1056/NEJMoa1200966. [DOI] [PubMed] [Google Scholar]
- v.de Fraipont F, El Atifi M, Cherradi N, Le Moigne G, Defaye G, Houlgatte R, et al. Gene expression profiling of human adrenocortical tumors using complementary deoxyribonucleic Acid microarrays identifies several candidate genes as markers of malignancy. J Clin Endocrinol Metab. 2005;90:1819–29. doi: 10.1210/jc.2004-1075. [DOI] [PubMed] [Google Scholar]
- vi.de Reyniès A, Assie G, Rickman DS, Tissier F, Groussin L, Rene-Corail F, et al. Gene expression profiling reveals a new classification of adrenocortical tumors and identifies molecular predictors of malignancy and survival. J Clin Oncol. 2009;27:1108–15. doi: 10.1200/JCO.2008.18.5678. [DOI] [PubMed] [Google Scholar]
- vii.Giordano TJ, Kuick R, Else T, Gauger PG, Vinco M, Bauersfeld J, et al. Molecular classification and prognostication of adrenocortical tumors by transcriptome profiling. Clin Cancer Res. 2009;15:668–76. doi: 10.1158/1078-0432.CCR-08-1067. [DOI] [PMC free article] [PubMed] [Google Scholar]
- viii.Velazquez-Fernandez D, Laurell C, Geli J, Hoog A, Odeberg J, Kjellman M, et al. Expression profiling of adrenocortical neoplasms suggests a molecular signature of malignancy. Surgery. 2005;138:1087–94. doi: 10.1016/j.surg.2005.09.031. [DOI] [PubMed] [Google Scholar]
- ix.Fassnacht M, Johanssen S, Quinkler M, Bucsky P, Willenberg HS, Beuschlein F, et al. Limited prognostic value of the 2004 International Union Against Cancer staging classification for adrenocortical carcinoma: proposal for a Revised TNM Classification. Cancer. 2009;115:243–50. doi: 10.1002/cncr.24030. [DOI] [PubMed] [Google Scholar]
- x.Weiss LM. Comparative histologic study of 43 metastasizing and nonmetastasizing adrenocortical tumors. Am J Surg Pathol. 1984;8:163–9. doi: 10.1097/00000478-198403000-00001. [DOI] [PubMed] [Google Scholar]
- xi.Reich M, Liefeld T, Gould J, Lerner J, Tamayo P, Mesirov JP. GenePattern 2.0. Nat Genet. 2006;38:500–1. doi: 10.1038/ng0506-500. [DOI] [PubMed] [Google Scholar]
- xii.Irizarry RA, Hobbs B, Collin F, Beazer-Barclay YD, Antonellis KJ, Scherf U, et al. Exploration, normalization, and summaries of high density oligonucleotide array probe level data. Biostatistics. 2003;4:249–64. doi: 10.1093/biostatistics/4.2.249. [DOI] [PubMed] [Google Scholar]
- xiii.Johnson WE, Li C, Rabinovic A. Adjusting batch effects in microarray expression data using empirical Bayes methods. Biostatistics. 2007;8:118–27. doi: 10.1093/biostatistics/kxj037. [DOI] [PubMed] [Google Scholar]
- xiv.Pfaffl MW. A new mathematical model for relative quantification in real-time RT-PCR. Nucleic Acids Res. 2001;29:e45. doi: 10.1093/nar/29.9.e45. [DOI] [PMC free article] [PubMed] [Google Scholar]
- xv.Subramanian A, Tamayo P, Mootha VK, Mukherjee S, Ebert BL, Gillette MA, et al. Gene set enrichment analysis: a knowledge-based approach for interpreting genome-wide expression profiles. Proc Natl Acad Sci U S A. 2005;102:15545–50. doi: 10.1073/pnas.0506580102. [DOI] [PMC free article] [PubMed] [Google Scholar]
- xvi.Carter SL, Eklund AC, Kohane IS, Harris LN, Szallasi Z. A signature of chromosomal instability inferred from gene expression profiles predicts clinical outcome in multiple human cancers. Nat Genet. 2006;38:1043–8. doi: 10.1038/ng1861. [DOI] [PubMed] [Google Scholar]
- xvii.Hernandez A, Lopez-Lluch G, Navas P, Pintor-Toro JA. HDAC and Hsp90 inhibitors down-regulate PTTG1/securin but do not induce aneuploidy. Genes Chromosomes Cancer. 2009;48:194–201. doi: 10.1002/gcc.20630. [DOI] [PubMed] [Google Scholar]
- xviii.Tong Y, Eigler T. Transcriptional targets for pituitary tumor-transforming gene-1. J Mol Endocrinol. 2009;43:179–85. doi: 10.1677/JME-08-0176. [DOI] [PubMed] [Google Scholar]
- xix.Heaney AP, Singson R, McCabe CJ, Nelson V, Nakashima M, Melmed S. Expression of pituitary-tumour transforming gene in colorectal tumours. Lancet. 2000;355:716–9. doi: 10.1016/S0140-6736(99)10238-1. [DOI] [PubMed] [Google Scholar]
- xx.Heaney AP, Singson R, McCabe CJ, Nelson V, Nakashima M, Melmed S. Expression of pituitary-tumour transforming gene in colorectal tumours. Lancet. 2000;355:716–9. doi: 10.1016/S0140-6736(99)10238-1. [DOI] [PubMed] [Google Scholar]
- xxi.Bernal JA, Luna R, Espina A, Lazaro I, Ramos-Morales F, Romero F, et al. Human securin interacts with p53 and modulates p53-mediated transcriptional activity and apoptosis. Nat Genet. 2002;32:306–11. doi: 10.1038/ng997. [DOI] [PubMed] [Google Scholar]
- xxii.Bernal JA, Roche M, Mendez-Vidal C, Espina A, Tortolero M, Pintor-Toro JA. Proliferative potential after DNA damage and non-homologous end joining are affected by loss of securin. Cell Death Differ. 2008;15:202–12. doi: 10.1038/sj.cdd.4402254. [DOI] [PubMed] [Google Scholar]
- xxiii.Tong Y, Tan Y, Zhou C, Melmed S. Pituitary tumor transforming gene interacts with Sp1 to modulate G1/S cell phase transition. Oncogene. 2007;26:5596–605. doi: 10.1038/sj.onc.1210339. [DOI] [PMC free article] [PubMed] [Google Scholar]
- xxiv.Pei L. Identification of c-myc as a down-stream target for pituitary tumor-transforming gene. J Biol Chem. 2001;276:8484–91. doi: 10.1074/jbc.M009654200. [DOI] [PubMed] [Google Scholar]
- xxv.Cho-Rok J, Yoo J, Jang YJ, Kim S, Chu IS, Yeom YI, et al. Adenovirus-mediated transfer of siRNA against PTTG1 inhibits liver cancer cell growth in vitro and in vivo. Hepatology. 2006;43:1042–52. doi: 10.1002/hep.21137. [DOI] [PubMed] [Google Scholar]