

Abstract
Genistein is a soy derived isoflavone. It has wide variety of therapeutic effects against certain diseases including cancer. Although toxic effects of genistein have been studied, its effect on the gene expression and the reason behind toxicity have not been identified yet. In the present study, genistein was administered to age and body weight matched Swiss mice at the doses of 125, 250, 500 and 1000 mg/kg. The biomarkers of hepatotoxicity in serum, liver histology, oxidative stress parameters in tissue homogenates, and global gene expression were examined. Elevated alanine aminotransferase (ALT), aspartate aminotransferase (AST), and alkaline phosphatase (ALP) levels and degenerated liver tissue were observed in 500, and 1000 mg/kg genistein treated groups. Oxidative stress was significant at these doses as considerable increase in lipid peroxidation (LPO) and decrease in total glutathione (GSH) were observed. Gene expression analysis showed 40 differentially expressed genes at twofold change and P < 0.05. Differentially expressed genes were corresponding to different biologically relevant pathways including metabolic and oxidative stress pathways. In 500 mg/kg group, Cyp4a14, Sult1e1, Gadd45g, Cidec, Mycs, and so forth genes were upregulated. These results suggested that the higher dose of genistein can produce several undesirable effects by affecting multiple cellular pathways.
1. Introduction
Genistein is a major soy isoflavone which occurs naturally in diet. A wide variety of soy derived food products contain an ample amount of genistein. Genistein has numerous beneficial effects like bone health improvement [1], antilipogenic [2], antitumor [3], antioxidant [4], anticarcinogenic [5], and estrogenic [6]. Recent evidence suggested that genistein is a potential candidate for cancer chemotherapy [7]. In the USA, the average daily dietary intake of isoflavones is 1.1–1.3 mg/day while it varies between 10 and 110 mg/day in China and Japan [8]. Due to high production of soy based foodstuffs in Asia, Asian population is incessantly exposed to isoflavones. Indeed, potential chemopreventive effects amplified the soy consumption. Despite having useful therapeutic properties, genistein is receiving attention as a major environmental contaminant on the basis of increasing conventional acute, subchronic, and chronic safety studies in various animal models [9]. Genistein exerts adverse effects on reproductive system of different rodent models [10] and elevates the relative uterine weight and downregulates the progesterone receptor in uterine epithelia [11]. Several in vitro studies reported its clastogenic and mutagenic potential [12–14]. Genistein induces chromosomal breakage [15] and micronucleus [16] formation in different cell lines. It affects cell growth and proliferation [17]. It induces apoptosis in nerve cells at high doses through intracellular calcium ion release and p42/44 mitogen-activated protein kinase [18]. Genistein is capable of transforming cells [19] which lead to different kinds of cancer during developmental stage of animals [20–22].
Although effects of genistein in different in vitro and in vivo models have been studied, early induced gene biomarker and the reason behind the toxicity have not been identified yet. In the present study, oligonucleotide microarray has been employed for a better understanding of gene expression signatures. In addition, effect of genistein on antioxidant status of liver was assessed in dose-dependent manner. Acute doses of genistein (125, 250, 500, and 1000 mg/kg) were administered in Swiss albino mice through intraperitoneal route. Doses and route of exposure of genistein were based on the reported literature [7]. After considering the body surface area index [23], doses were selected which were also corresponding to the human exposure of isoflavonoids [8].
2. Materials and Methods
2.1. Animals and Drug Administration
25–30 gm, 10–12-week-old male Swiss albino mice (Mus musculus) were obtained from Laboratory Animal Division, Central Drug Research Institute, Lucknow. Animals were randomly allocated to the following groups:
-
Group I: vehicle treated animals (control),
-
Group II: genistein 125 mg/kg treated,
-
Group III: genistein 250 mg/kg treated,
-
Group IV: genistein 500 mg/kg treated,
-
Group V: genistein 1000 mg/kg treated.
Each group contains six animals. All animal procedures were performed in compliance with institutional animal ethics guidelines (113/09/Toxicol./IAEC dated 10.7.09). Animals were acclimatized to optimal conditions of temperature (25 ± 2°C) and light/dark cycle (12 hr each) before drug administration. Genistein was dissolved in DMSO and intraperitoneally (IP) administered to Swiss albino mice. DMSO treated animals were used as control. Food and water were supplied ad libitum. Animals were sacrificed after 24 hr of treatment.
2.2. Chemicals and Biochemicals
Genistein (5,7-dihydroxy-3-(4-hydroxyphenyl)-4H-1-benzopyran-4-one, CAS number 446-72-0), serum bovine albumin, HEPES, EDTA, EGTA, DTT, PMSF, protease inhibitor cocktail, Ponceau S stain, and Bradford reagent were procured from Sigma, St. Louis, USA. DMSO, KCl, MgCl2, and H2O2 were purchased from Merck, India. ALT, AST, and ALP estimation kits were purchased from Beckman Coulter, Ireland. TRIzol, First-Strand Synthesis Supermix for qRT-PCR and SYBR GreenER qPCR Supermix Universal kit were purchased from Invitrogen, California, USA. Primary antibodies such as rabbit polyclonal IgG SOD1, actin, and secondary antibody goat anti-rabbit IgG-HRP were procured from Santa Cruz Biotechnology, California. Purified mouse anti-Hsp70 antibody was purchased from BD Biosciences, USA. Enhanced chemiluminescent (ECL) kit was procured from GE Healthcare, UK.
2.3. Blood Collection and Serum Biochemistry
During autopsy blood was withdrawn from each animal and allowed to stand undisturbed for 30 min. The serum was separated and levels of ALT, AST, and ALP were estimated using an automated biochemical analyzer (Beckman Coulter, California, USA).
2.4. Liver Tissue Processing and Histology
A part of liver tissue was snap-frozen in liquid N2 within 2 min of sacrifice and subsequently stored at −80°C for further use in RNA and protein isolation and the second part was frozen for different enzymatic assays. Another part of tissue was fixed in 10% formal saline for histological investigations. Fixed liver tissues were washed overnight, dehydrated through graded alcohols, and embedded in paraffin wax. Serial sections of 5 μm thickness were stained with hematoxylin and eosin (H and E) for histological examinations.
2.5. Liver Tissue Biochemistry
Liver tissue homogenates were used for antioxidant enzymatic assays. Malondialdehyde (MDA) concentration (a measure of lipid peroxidation, LPO), total glutathione content (GSH), and antioxidant enzymes activities (superoxide dismutase, catalase, glutathione peroxidase, and glutathione reductase) were estimated using standard tests [24–29]. Lowry method was used to estimate the total protein content with serum bovine albumin as a standard [30]. Readings of all assays were taken in spectrophotometer (Powerwave XS, BIO-TEK, USA).
2.6. RNA Isolation, cDNA Labeling, and Hybridization
50 mg frozen liver tissue was crushed in liquid N2 and immediately homogenized (Heidolph, Germany) in 1 ml TRIzol to isolate total RNA. After quantification from spectrophotometer (Amersham Biosciences, UK) and running on formaldehyde gel, RNA samples with approximately 2 : 1 ratio of 28S : 18S rRNA and 260/280 values ≥ 1.8 were used for gene expression analysis. Equal amounts of RNA from individuals of the same group were pooled to eliminate interindividual variations. RNA samples were labeled using the T7 promoter based-linear amplification to generate labeled complementary RNA (Agilent Quick-Amp Labeling Kit). Quality control (QC) was performed using nanodrop and cRNA was purified using Qiagen's RNeasy minikit. The amplified and labeled cRNA was hybridized to mouse 60 K whole genome arrays using Agilent's In Situ Hybridization kit (Agilent microarray services, Genotypic Technology, Bangalore, India).
2.7. Scanning and Microarray Data Analysis
The arrays were washed with buffers and subsequently scanned with confocal laser scanner to collect raw data. Intensity values were extracted and percentile shift normalization was performed by using GeneSpring GX 11.0 software. It is a global normalization, where the locations of all spot intensities in an array are adjusted. This normalization takes each column in an experiment independently and computes the percentile of expression values for this array, across all spots (where n has a range from 0 to 100 and n = 75 is the median). It subtracts this value from the expression value of each entity. Analysis was done with respect to control samples and statistically significant difference between control and genistein administered mice was deduced with two sample t-tests and probes with P < 0.05 and twofold differential expression at all doses were identified. Raw and log-transformed data have been submitted to Gene Expression Omnibus database (http://www.ncbi.nlm.nih.gov/geo/query/acc.cgi?acc=GSE23523) and conform to MIAME guidelines developed by Microarray Gene Expression Data (MGED) Society.
2.8. Clustering Algorithm and Pathway Analysis
Clustering algorithm was applied for the identification of patterns in gene expression data. Hierarchical clustering was used to join data in a single group having the most similar expression profiles. Average linkage method was used to measure the pair-wise distance between entities in two clusters and application of Pearson uncentered correlation measured the similarity or difference between entities. Significant pathways for the differentially regulated genes were obtained using Biointerpreter (Genotypic Technology, Bangalore, India). Pathways that show P < 0.05 for differentially regulated genes were taken into consideration.
2.9. Quantitative Real Time PCR Analysis
Real time PCR analysis was performed according to the supplier protocol (Invitrogen, California, USA) using Superscript III First-Strand Synthesis Supermix for qRT-PCR and SYBR GreenER qPCR Supermix Universal kit in 20 μL volumes per well of 96-well clear optical reaction plates. The components of reaction were SYBR Green PCR Master Mix (Invitrogen, California, USA), cDNA template, forward and reverse primers (Table 1), and nuclease-free water (Sigma, USA). PCR reactions were performed in Light Cycler 480 Real Time PCR instrument and analyzed according to accompanying software instructions (Roche Diagnostics Ltd., Switzerland). Beta-actin was used as an internal control and used to normalize ratios between samples. For primer pair, melting curve analysis was performed according to the instrument software instructions. Program was an initial incubation of 50°C for 2 min hold (UDG incubation) and 95°C for 10 min followed by 40 cycles at 95°C for 15 s, 60°C for 60 s. Relative change in mRNA level between control and treated groups were calculated by using 2−ΔΔCT method.
Table 1.
List of primers used in quantitative real time polymerase chain reaction.
| Gene | Forward primer (5′-3′) | Reverse primer (5′-3′) |
|---|---|---|
| Actb | GGCTGTATTCCCCTCCATCG | CCAGTTGGTAACAATGCCATGT |
| Sod1 | TTTTTGCGCGGTCCTTTCCTG | GGTTCACCGCTTGCCTTCTGCT |
| Cat1 | AGCGACCAGATGAAGCAGTG | TCCGCTCTCTGTCAAAGTGTG |
| Gpx1 | ATGTCGCGTCTCTCTGAGG | CCGAACTGATTGCACGGGAA |
| Gr | GGCAACAGGGTGATGATCTTC | CTGGAAAGTTCGGTCACATCC |
| Sult3a1 | AGATGTGGTAGGAAGCCTTTGG | CTTGTCTCACAACAGCATCCA |
| Cyp4a14 | GTCTCTCGGGGAGCAATATACG | ACCAATCCAGGGAGCAAAGAA |
| H2-t24 | TCGGCAATACTACAACAGCTCT | ATCGTAGCCATACTGCCAATG |
| Adrbk2 | AGGAGGGTTTGGGGAAGTTTA | CATGATCCTCTCGTTCAAAGCC |
| Elovl3 | TTCTCACGCGGGTTAAAAATGG | GAGCAACAGATAGACGACCAC |
| Olfr1274 | GTTCCTGCTTACGATGATGGC | GCAAGGGAATGGACAAAACCT |
| Spn | AACCATCAAATGTAGCCAGTGAC | GGTCTCGTTAGAGCTTGTTGTC |
| Gemin6 | GCCAACATTGTCCTCGTAAACT | TGTGGTCCCCTTCACTTATGG |
2.10. Western Blot Analysis
Proteins were isolated from liver tissue using modified protocol [31]. Tissues from control and treatment groups were homogenized with 5–10 volumes of lysis buffer (200 mM HEPES, 10 mM KCl, 1.5 mM MgCl2, 1 mM EDTA, 1 mM EGTA, 1 mM DTT, 2 mM PMSF, and 1X protease inhibitor cocktail). Cellular debris was spun down at 20,000 g for 30 min at 4°C and supernatants were used as whole protein extract. Isolated proteins were quantified using Bradford reagent. 50 μg protein from each sample was separated on 15% SDS-PAGE and transferred on to a nitrocellulose membrane using a semidry electroblotting apparatus (GE Healthcare, UK). Transfer was examined by Ponceau S stain and washed with triple distilled water until the stain disappeared. Membrane was overnight blocked in 5% nonfat dried milk at 4°C. Blocking membrane was washed with 0.1% PBST and probed with primary antibodies (actin, SOD1, and Hsp70). After primary antibody incubation further washing was done in 0.1% PBST. Membrane was incubated in HRP conjugated secondary antibody and washed again. Enhanced chemiluminescent detection system was used to develop the blots. Blots were further used for densitometric analysis and normalization.
2.11. Statistical Analysis
Data were expressed as mean ± standard error of means (SEM). Group means were compared by one-way analysis of variance (ANOVA) followed by Newman-Keuls multiple comparison test. The differences in data obtained were considered statistically significant when P < 0.05.
3. Results
3.1. Level of Serum Biomarkers
A significant increase in serum ALT (P < 0.01), AST (P < 0.05), and ALP (P < 0.05) level was found in higher doses (Groups IV and V) of genistein as compared to control (Group I). However, serum ALT, AST, and ALP level did not change in Group II and III animals as compared to control (Figures 1(a), 1(b), and 1(c)).
Figure 1.
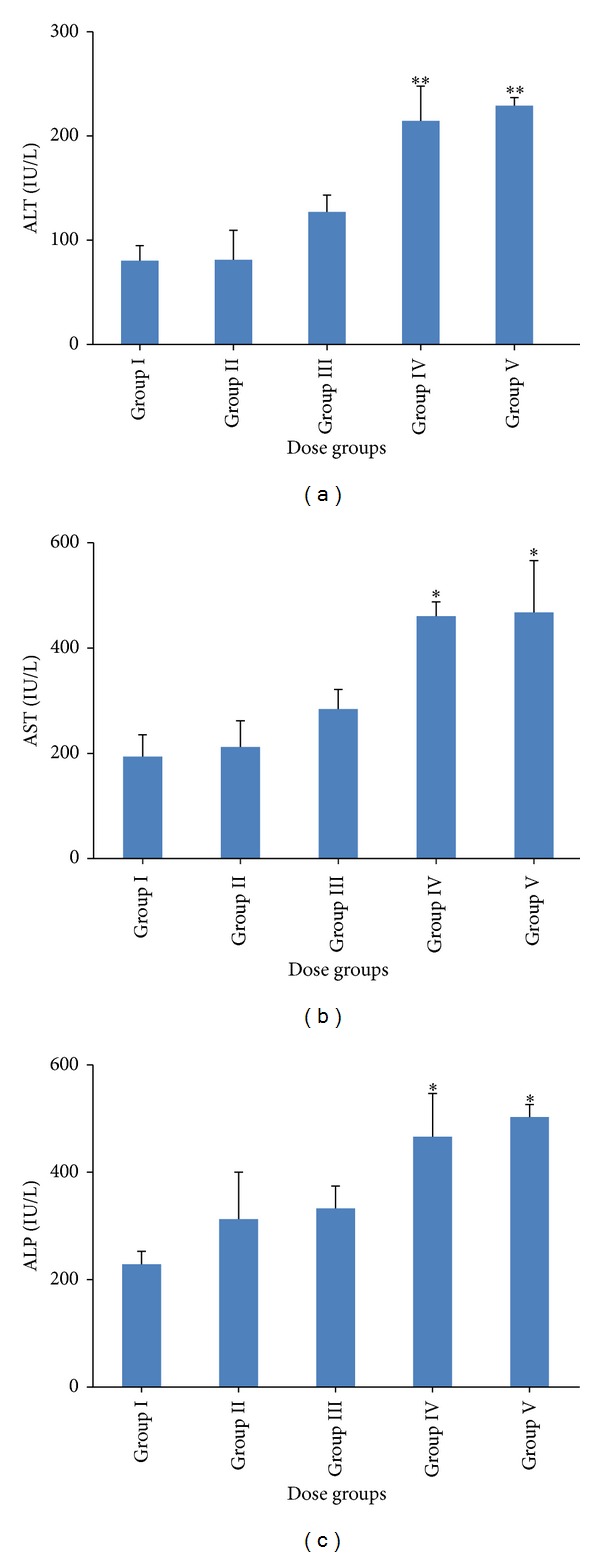
Level of serum biomarkers of hepatotoxicity: bar diagrams are showing the levels of (a) alanine amino transferase (ALT), (b) aspartate amino transferase (AST), and (c) alkaline phosphatase (ALP) following the administration of genistein at different doses (i.e., Group I: vehicle treated control, Group II: 125 mg/kg, Group III: 250 mg/kg, Group IV: 500 mg/kg, and Group V: 1000 mg/kg). The asterisks indicate the significance of differences (*P < 0.05, **P < 0.01, and ***P < 0.001) in comparison to control.
3.2. Histological Examination of Liver Tissue
Liver sections of Group II and Group III animals showed well distributed normal hepatocytes, central vein, bile duct, and hepatic artery with no histological alterations as compared to control (Group I). In the liver sections of Group IV and Group V animals, hydropic changes were observed in hepatocytes (Figures 2(a), 2(b), 2(c), 2(d), and 2(e)); these changes were characterized by ballooning and degeneration.
Figure 2.
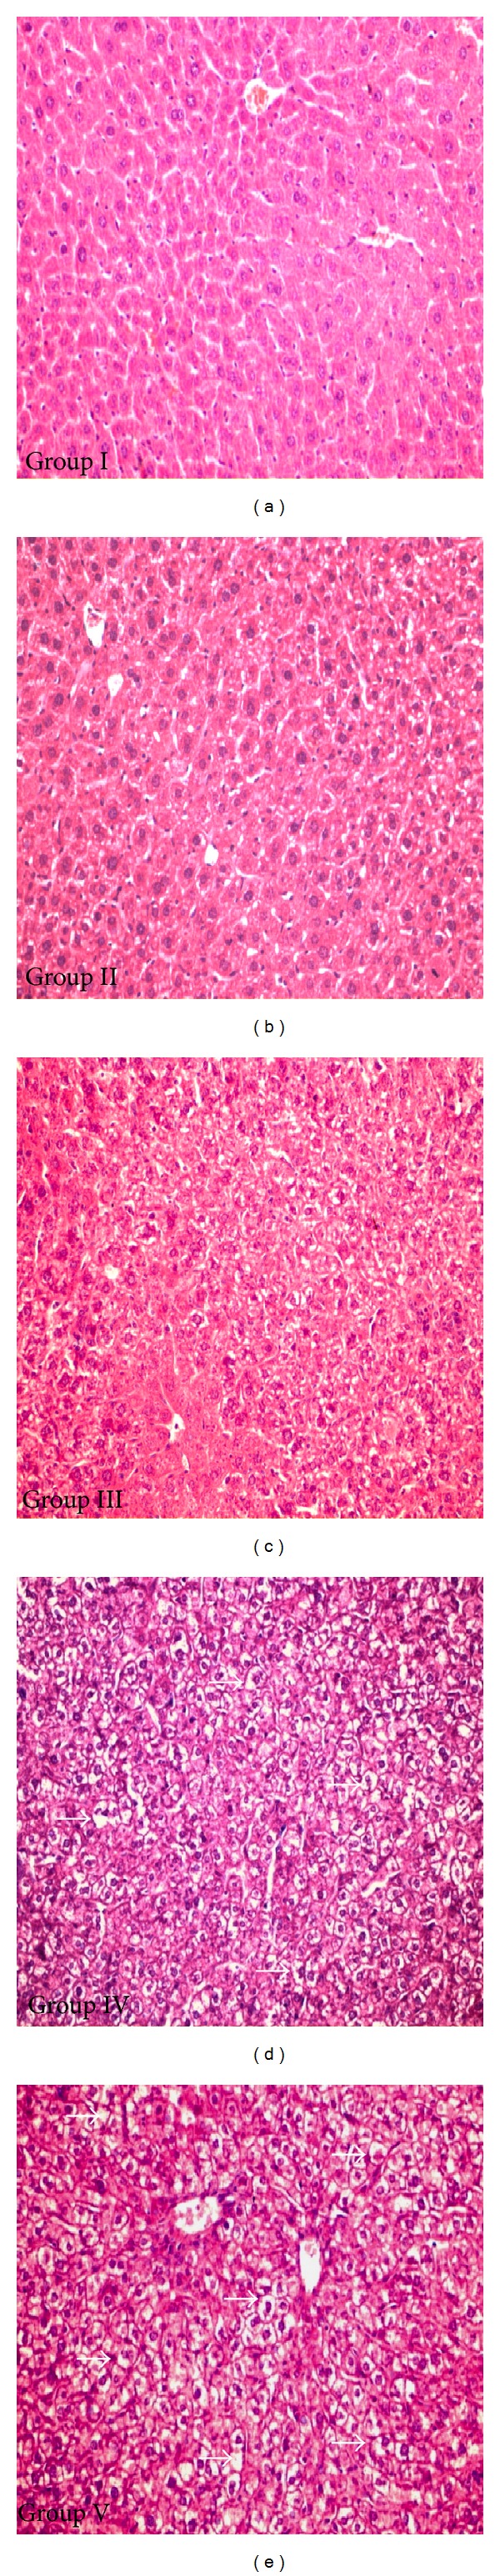
Histological examination of liver sections: photomicrograph of transverse sections of mice liver. (a) Group I: vehicle treated control, (b) Group II: 125 mg/kg, (c) Group III: 250 mg/kg, (d) Group IV: 500 mg/kg, and (e) Group V: 1000 mg/kg. Hydropic changes and degeneration of cytoplasm within hepatocytes were observed in Group IV 500 mg/kg and Group V 1000 mg/kg genistein treated animals. Arrows indicate the degenerated hepatocytes in 500 and 1000 mg/kg genistein treated groups.
3.3. Lipid Peroxidation Level
Malondialdehyde (MDA), a secondary product of lipid peroxidation, was not altered in Group II and III animals as compared to control (Group I). However, a significant increase in MDA concentration was observed in the liver of Group IV and V (P < 0.05) genistein treated animals (Figure 3(a)) as compared to control.
Figure 3.
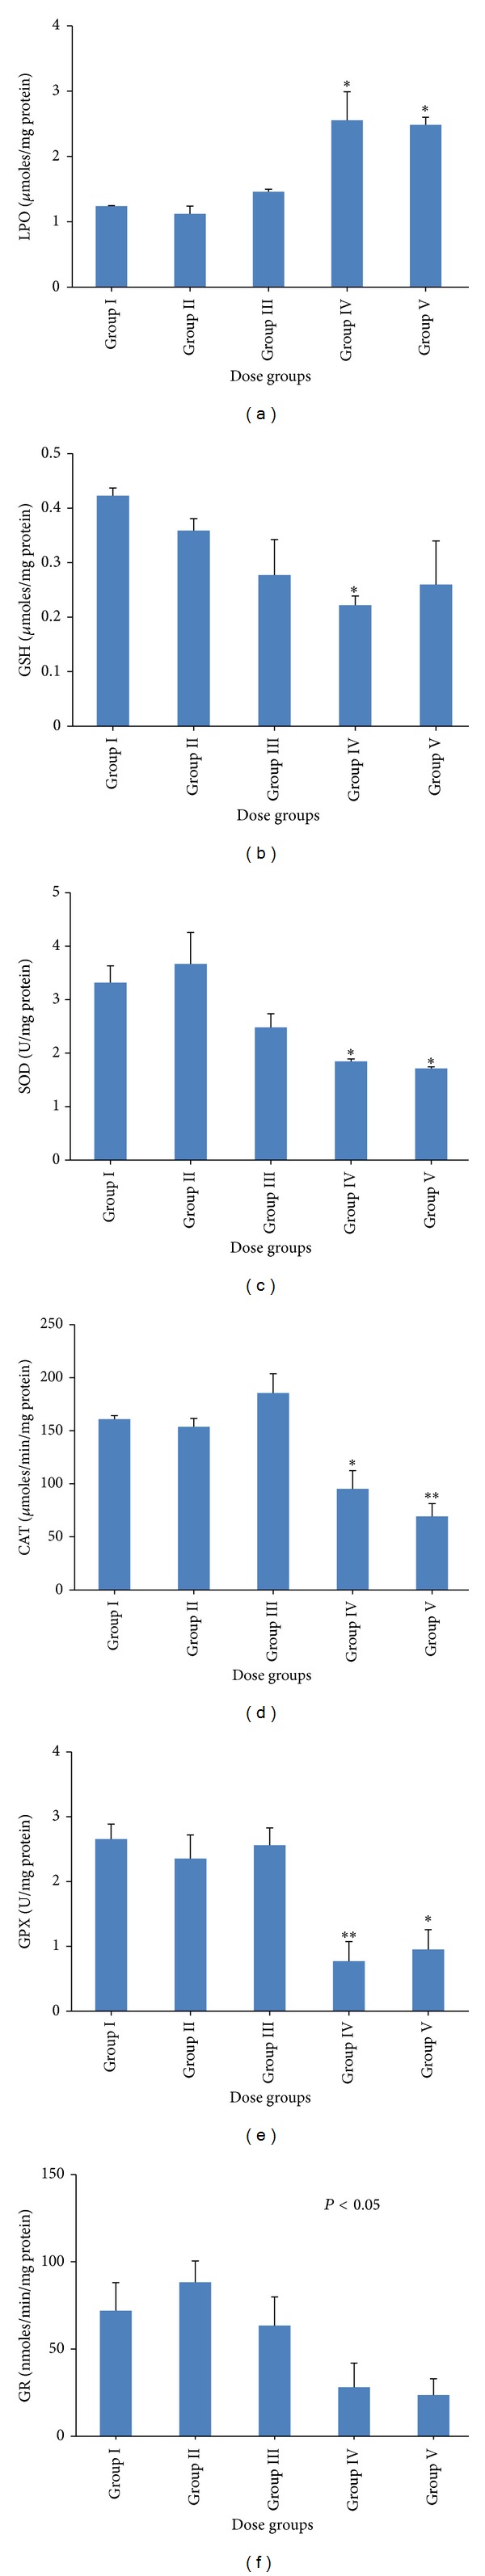
Level of oxidative stress parameters: bar diagrams are showing (a) lipid peroxidation level, (b) total glutathione content, (c) superoxide dismutase (SOD) activity, (d) catalase (CAT) activity, (e) glutathione peroxidase (GPX) activity, and (f) glutathione reductase (GR) activity in mice liver following the administration of genistein at different doses (i.e., Group I: vehicle treated control, Group II: 125 mg/kg, Group III: 250 mg/kg, Group IV: 500 mg/kg, and Group V: 1000 mg/kg).
3.4. Total Glutathione Estimation
Total glutathione content in higher treatment groups (Group IV; P < 0.05 and Group V) was significantly decreased as compared to control (Group I). In other dose groups (Groups II and III), glutathione content did not change as compared to control (Figure 3(b)).
3.5. Activity, mRNA, and Protein Level of SOD
In Group IV and V genistein treated animals, SOD activity (Figure 3(c); P < 0.05) was decreased significantly; however, no significant changes were observed in Group II and III genistein treated animals as compared to control group. SOD1 protein level (Figures 5(a) and 5(b)) was decreased in Group IV and V animals as compared to control; however, no significant change was observed in Group II and III animals. In lower treatment groups (Groups II and III), SOD1 mRNA (Figure 4(a)) level was increased; however, in the highest treatment group (Group V) mRNA level was decreased. In Group IV animals, SOD1 mRNA level did not change as compared to control (Group I).
Figure 5.
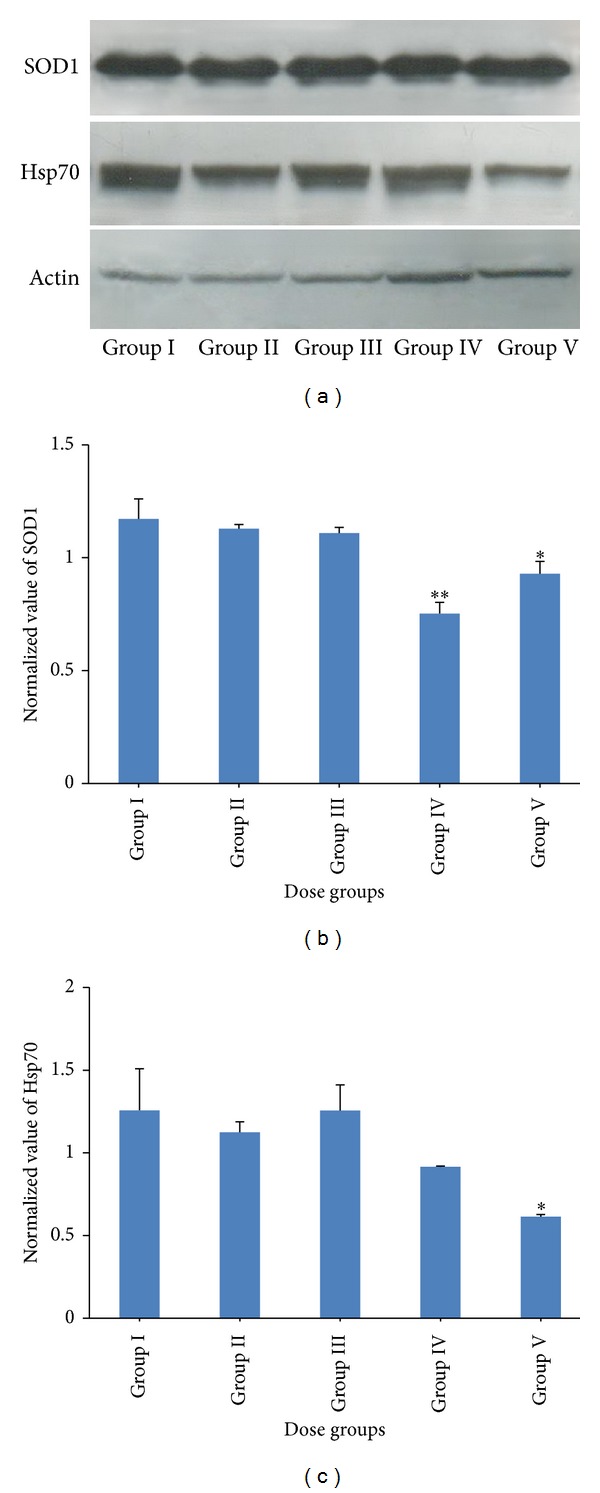
Western blot analysis of SOD1 and Hsp70. (a) Western blots of SOD1, Hsp70, and actin proteins. (b, c) Bar diagrams are showing the relative band intensity of (b) SOD1 and (c) Hsp70 after normalization with actin. Bars: I: vehicle treated control, II: 125 mg/kg, III: 250 mg/kg, IV: 500 mg/kg, and V: 1000 mg/kg.
Figure 4.
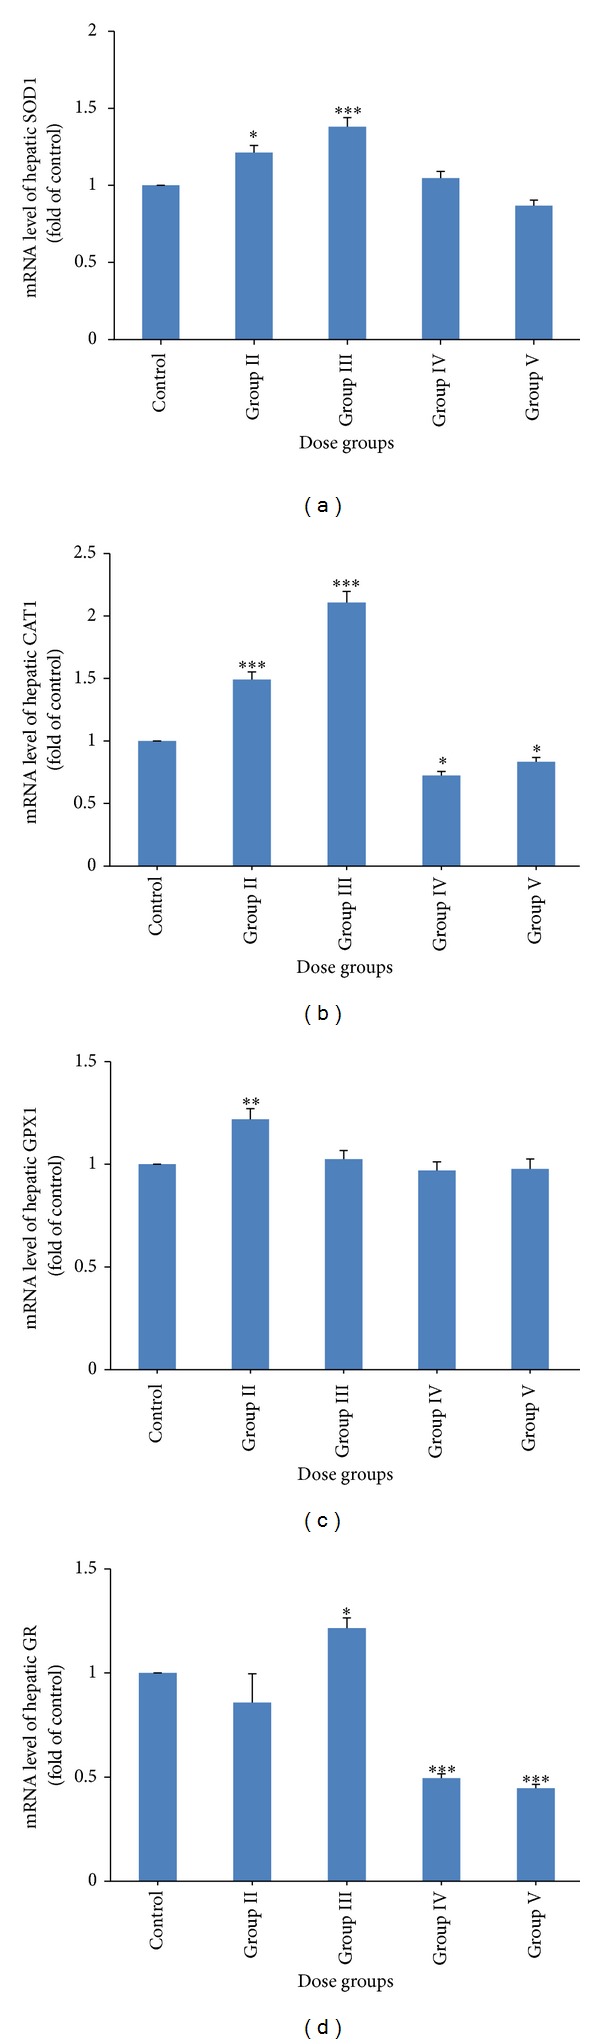
Quantitative real time PCR analysis of stress regulated genes: (a) SOD1, (b) CAT1, (c) GPX1, and (d) GR genes in the mice liver treated with different doses of genistein (control, 125, 250, 500, and 1000 mg/kg). Bars: I: control, II: 125 mg/kg, III: 250 mg/kg, IV: 500 mg/kg, and V: 1000 mg/kg.
3.6. Activities and mRNA Level of CAT, GPX, and GR
In higher dose groups of genistein (Groups IV and V), CAT and GPX activities (Figures 3(d) and 3(e)) were significantly decreased. CAT and GPX activities did not alter in lower treatment groups (Groups I and II) of genistein as compared to control. A decrease in GR activity (Figure 3(f)) was found in Group IV and V animals. In lower treatment groups (Groups I and II), GR activity did not change as compared to control.
In Group IV and V animals, a significant decrease in CAT1 and GR mRNA level was found; however, GPX1 mRNA did not change in these groups as compared to control (Figures 4(b), 4(c), and 4(d)). CAT1 mRNA level was significantly increased in lower treatment groups (Groups II and III) (Figure 4(b)). GPX1 mRNA level was increased in Group II animals; however, it did not change in Group III animals as compared to control (Figure 4(c)). GR mRNA level did not change in Group II animals; however, it was increased in Group III animals (Figure 4(d)).
3.7. Protein Level of Hsp70
Protein level of Hsp70 was decreased during the genistein treatment (Figure 5(a)). Densitometry analysis and normalization with actin showed the maximum decrease in Group IV and V (P < 0.05) genistein treated groups as compared to control (Figure 5(c)).
3.8. Differential Gene Expression Analysis
Following genistein exposure, mRNA expression in mice liver was assessed with 60,000 unique probes. A statistical stringent criterion (twofold change and P < 0.05) identified 40 differentially expressed probes consisting of 20 upregulated and 20 downregulated probes (Table 2). Few differentially expressed probes have no sequence similarity with any known gene and have not been assigned any biological function. Moreover, real time PCR analysis of selected genes (Table 1) showed similar trend of regulation as found in differential expression to microarray results.
Table 2.
List of differentially expressed genes identified at P < 0.05 and twofold change.
| Gene symbol | Regulation | Group II | Group III | Group IV | Gene ontology |
|---|---|---|---|---|---|
| Sult3a1 | Up | 5.58 | 7.64 | 8.27 | Sulfotransferase activity, transferase activity, amine sulfotransferase activity |
| Hamp2 | Up | 5.08 | 3.51 | 2.05 | Killing of cells of another organism, defense response to bacterium, cellular iron ion homeostasis, extracellular region, hormone activity, defense response to fungus |
| Cyp4a14 | Up | 4.30 | 2.20 | 4.41 | Oxidoreductase activity, metal ion binding, heme binding, alkane 1-monooxygenase activity, electron carrier activity, monooxygenase activity |
| Extl3 | Up | 2.79 | 3.55 | 2.53 | Transferase and glucuronyl-galactosyl-proteoglycan 4-alpha-N-acetylglucosaminyltransferase activity, metal ion binding, intrinsic to endoplasmic reticulum membrane, manganese ion binding |
| Prei4 | Up | 2.36 | 2.19 | 3.99 | Catalytic and hydrolase activity, glycerol-phosphodiester phosphodiesterase activity, phosphoric diester hydrolase activity, lipid, carbohydrate and glycerol metabolic process |
| H2-T24 | Up | 2.04 | 3.09 | 2.10 | Molecular function, cellular component, biological process, integral to membrane |
| Adrbk2 | Up | 2.08 | 3.55 | 2.44 | Protein amino acid phosphorylation, beta-adrenergic receptor kinase activity, signal transducer activity, G-protein coupled receptor and protein serine/threonine kinase activity |
| Gm4976 | Up | 2.10 | 3.38 | 2.85 | Hydrolase activity |
| Mup20 | Down | −3.43 | −2.50 | −4.58 | Pheromone binding |
| Hspa1a | Down | −3.97 | −4.56 | −3.73 | Response to stress, nucleotide binding, response to heat, cytoplasmic part, DNA repair, telomere maintenance, ATP binding |
| Reg3b | Down | −6.02 | −2.84 | −2.94 | Acute-phase response, inflammatory response, sugar binding |
| Rps6kb1 | Down | −10.12 | −9.44 | −10.73 | Protein amino acid phosphorylation, protein kinase B signaling cascade, transferase activity and kinase activity, germ cell development |
| Olfr1274 | Down | −10.80 | −10.91 | −10.32 | Olfactory receptor activity, integral to membrane, sensory perception of smell, signal transducer activity, G-protein coupled receptor activity |
| Spn | Down | −10.55 | −10.14 | −9.85 | Defense response to bacterium, integral to membrane, T cell costimulation, positive regulation of T cell proliferation, negative regulation of T cell proliferation, positive regulation of tumor necrosis factor biosynthetic process |
| Elovl3 | Down | −2.66 | −2.91 | −3.30 | Endoplasmic reticulum, fatty acid and lipid biosynthetic process, integral to membrane |
| Gemin6 | Down | −11.48 | −10.75 | −11.28 | Spliceosomal complex, RNA splicing, protein binding, mRNA processing |
3.9. Affected Pathways and Cluster Analysis
Differentially regulated genes were clustered using hierarchical clustering to identify significant gene expression patterns. The most similar expression profiles are joined together to form a group. These were further joined in a tree structure, until all data forms a single group. Genes were classified based on functional category and pathways using Gene Spring GX Software and Genotypic Biointerpreter-Biological Analysis Software. Major pathways were identified that showed signs of genistein induced perturbations including oxidative stress, metabolic, inflammatory, and MAPK kinase related pathways (Figure 6; see Table S1 in supplementary material available online at http://dx.doi.org/10.1155/2014/619617). We further analyzed the differentially regulated genes of Group IV (500 mg/kg genistein) animals to detect the changes at transcript level and found that a large number of genes related to cancer pathways were upregulated; however, the metabolic pathway related genes were majorly downregulated (Figure 7).
Figure 6.
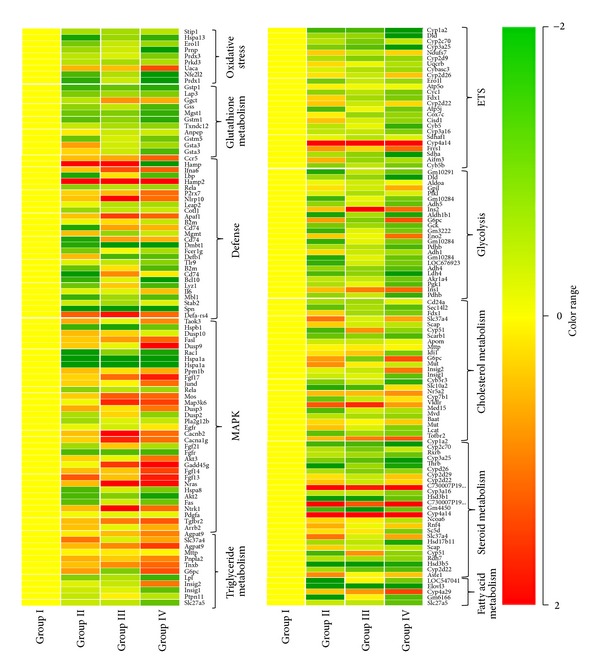
Cluster analysis of differentially expressed genes: a portion of the k-means clusters of differentially regulated genes (oxidative stress, glutathione metabolism, defense, MAPK, triglyceride, ETS, glycolysis, cholesterol, steroid, and fatty acid related genes) following the administration of genistein at different doses 125 mg/kg (Group II), 250 mg/kg (Group III), and 500 mg/kg (Group IV) involved in different pathways as compared to vehicle treated control (Group I).
Figure 7.
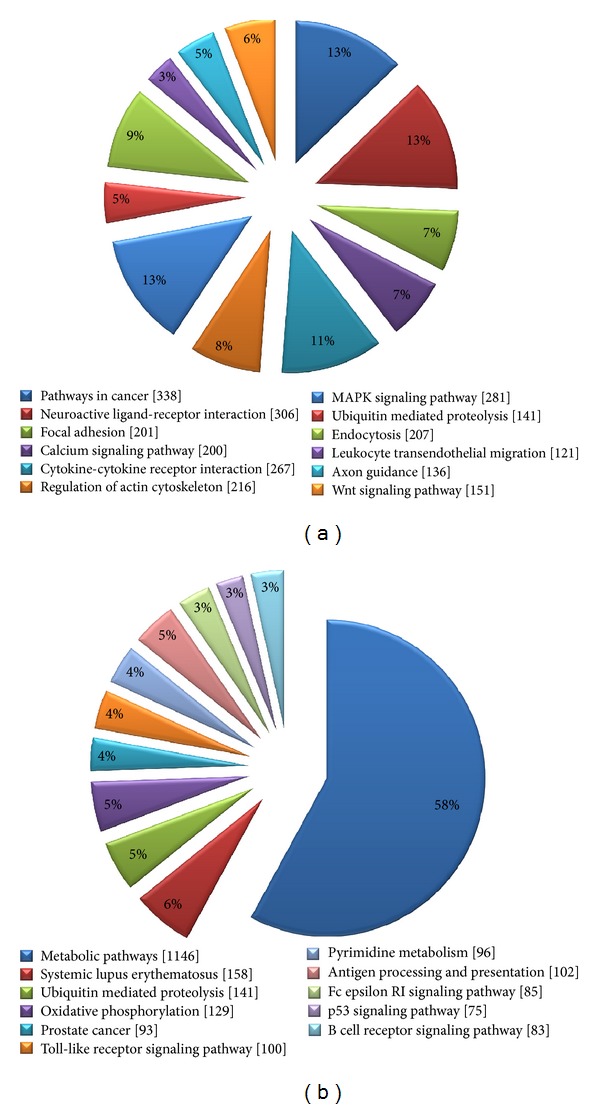
Pathway analysis: pie chart is showing the significant pathways of (a) upregulated and (b) downregulated genes obtained after using Biointerpreter software in 500 mg/kg genistein (Group IV) treated animals. Pathways were identified after applying the criterion of P < 0.05. Number within the square bracket [] specifies the number of genes in the pathway in genome.
4. Discussion
In the present study, effects of genistein on the mice liver were evaluated. Acute doses of genistein were intraperitoneally administered. We observed hepatotoxicity in 500 and 1000 mg/kg genistein treated animals in terms of elevated serum ALT, AST, and ALP level. These three parameters (ALT, AST, and ALP) are established hepatotoxicity biomarkers and utilized to monitor acute liver injury [32]. Few other flavonoids have already been reported to induce significant hepatic damage during intraperitoneal exposure. Galati et al. found the 4-fold increased plasma ALT level after 24 hr when tea polyphenols like EGCG (120 mg/kg), propyl gallate (170 mg/kg), gallic acid (500 mg/kg), and tannic acid (120 mg/kg) were administered intraperitoneally in CD-1 mice [33]. In our previous study [34], acute doses of apigenin (100 and 200 mg/kg) elevated the serum biomarkers level (ALT, AST, and ALP) in Swiss albino mice. In the present study, we observed the histological alterations which were characterized by ballooning and degeneration of hepatocytes in higher doses (500 and 1000 mg/kg) further confirm the hepatotoxicity at these doses. Unaffected liver histoarchitecture in 125 and 250 mg/kg doses supported the serum findings evocative of nontoxic effects of genistein at these doses. This may be due to the acute treatment of genistein. Previous investigators also accounted for negative correlation between altered serum markers and histological changes [32].
By knowing the fact that the flavonoids may act as prooxidant and may generate oxidative stress which might be the reason for hepatotoxicity, we examined the activity and expression of major antioxidant enzymes. One of the consequences of oxidative stress is the elevation in LPO level. In our study, a significant increase in LPO at higher doses (500 and 1000 mg/kg) rendered a clear indication of ROS generation. Other flavonoids have also been reported to increase LPO level during ROS generation [35]. In the present study, decreased activity and expression of SOD, CAT, GPX, and GR in higher treatment groups (500 and 1000 mg/kg) might be the consequence of decreased de novo synthesis of enzymes [36] or irreversible inactivation of enzymes from increased free radical generation [37] through genistein metabolism. Decrease in GR along with GSH suggested the overall reduction in GSH/GSSG ratio which may shift the biological system towards different biological states like proliferation, differentiation, apoptosis, or necrosis [38]. Furthermore, the dose-dependent reduction in Hsp70 expression by genistein indicated the apoptosis induction [39]. It has been reported that the Hsp synthesis is blocked by quercetin (a flavonoid) [40].
Microarray analysis was performed for 125, 250, and 500 mg/kg genistein treated animals to find out the earlier changes in gene biomarkers before the onset of the liver injury. Genomic markers are more reliable in short term acute toxicity studies where the phenotypic signs and symptoms may have not been fully developed [41]. In the present study, 40 differentially regulated genes were identified at twofold change and P < 0.05. To obtain the profoundness of gene expression results, we grouped genes under selected functional categories: (i) stress and glutathione metabolism related genes, (ii) defense and MAPK pathway related genes, (iii) ETS and glycolysis pathway related genes, and (iv) fatty acid, cholesterol, steroid, and triglyceride metabolism related genes.
(i) Stress and Glutathione Metabolism Related Genes. The most striking finding of our study is the massive downregulation of oxidative stress and glutathione metabolism related genes. For example, Nuclear Factor (Erythroid-Derived 2)-Like 2 (NRF2), Glutathione S-transferase pi 1 (GSTP1), Microsomal glutathione S-transferase 1 (MGST1) were down regulated. Expression of different isoforms of peroxiredoxins, for example, PRDX3, was also decreased. PRDX3 is located in mitochondria and guards emergent tumor cells against apoptosis [42]. It is reported that the absence or low level of PRDX3 declines the ability of mitochondria to neutralize ROS and potentiates early apoptosis in MCF7 cells when exposed to PP2 (a derivative of pyrimidine) [43]. In the present study, its downregulation indicated the induction of apoptosis in mice liver cells. Moreover, we found the decreased mRNA expression of Prnp, Stip1, Hsp70, and Sod genes. Stip1 provides potential to germ cells to survive in stress conditions [44] and exist in a macromolecular complex with the proteins of Hsp70 and 90 families [45]. Prnp, a cellular prion protein, cooperates with Stip1 and regulates superoxide dismutase activity in neuronal cell lines [46]. Coordinated downregulation of these genes suggested the augmentation of stress within liver cells. Furthermore, downregulation of glutathione synthetase gene which is involved in GSH biosynthesis corroborated the finding of GSH depletion in higher doses of genistein.
(ii) Defense and MAPK Pathway Related Genes. Genistein modulated the expression of defense and MAPK related pathway genes. Administration of 500 mg/kg genistein induced the transcriptional upregulation of certain immunomodulatory genes, for example, interferons (Ifna6), interleukins (Il6), and chemokines receptor (Ccr5) genes. In previous reports, IL-6 was upregulated in intravesical bacillus Calmette-Guerin (BCG) therapy of superficial bladder cancer [47] and IFN-α6 expression was increased with other subtypes of interferon alpha (IFN-α2, IFN-α4, IFN-α5, IFN-α7, and IFN-α10) in HIV-1 patients at different stages [48]. Similarly, CCR5 expression was increased in adult rats infected with Borna disease virus (BDV) [49]. Chemokines and their receptors participate in many pathophysiologic conditions, such as inflammation and autoimmunity. In the present study, upregulation of P2RX7 indicated the regulation of immune function and neurotransmitter release by genistein. P2RX7 is a purinergic ATP-binding calcium channel expressed in microglial cells and considered a candidate gene in type I diabetes [50]. The upregulation of fibroblast growth factor 17 (FGF17) and epidermal growth factor receptor (EGFR) by genistein clearly indicated the stimulation of different signaling pathways which have been known to be involved in cancer. FGF17 either enhances cellular proliferation or inhibits apoptosis [51] and EGFR induces signaling pathway in different kinds of cancer, namely, lung and anal cancer [52]. We found the downregulation of apoptosis-inducing factor (AIF) which pointed towards apoptosis induction. AIF is a caspase-independent apoptosis effector and protects neurons from oxidative stress-induced apoptosis in vivo [53].
(iii) ETS and Glycolysis Pathway Related Genes. mRNA of genes involved in ETS and glycolysis pathways were differentially expressed by genistein treatment. Cyp4a14 was induced more than 4.4-fold in 500 mg/kg genistein treated animals. Cyp4a14 is a member of cytochrome family CYP450 and plays a key role in metabolism of endogenic substances and xenobiotics [54]. It is reported that these proteins may interact with flavonoids by three ways: flavonoids can induce biosynthesis of certain CYPs, flavonoids can modulate enzymatic activity of CYPs, and flavonoids can be metabolized by several CYPs [54]. During metabolism, cytochrome P450 produces other metabolites having biological activities unlike from parent compound [55]. Thus, it can be speculated that genistein metabolites rather than the parent compound might have mediated the biological response. We found that the succinate dehydrogenase complex, subunit A (SDH A) was downregulated more than twofold in 500 mg/kg genistein dose group. SDH A accepts electrons from succinate during the conversion of succinate to fumarate in citric acid cycle. Its downregulation clearly indicated the impairment in metabolic regulation at a high dose of genistein. In the present study, differential regulation of other genes like Ndufs7, Cyc1, and Cyb5 of electron transport chain might have induced the premature electron leakage which ensued in oxidative stress.
(iv) Fatty Acid, Cholesterol, Steroid, and Triglyceride Metabolism Related Genes. It is well recognized that CYP450 genes do not only participate in xenobiotic metabolism but are also involved in fatty acid, cholesterol, steroid, and triglyceride metabolism. In the present study, differential expression of CYP450 family genes like Cyp4a29, Cyp7b1, Cyp4a14, Cyp2d10, Cyp2d26, Cyp7b1, Cyp3a25, Cyp2d9, and Cyp3a41b by different doses of genistein suggested the comparable regulation mechanism by CYP enzymes that might be involved in oxidative stress related metabolic pathways. We found the differential expression in solute carrier family genes (Slc27a5, Slc10a2, and Slc37a4) which have been reported to be involved in vacuole formation in hepatocytes through transport of fatty acids [56]. Lower doses of genistein were not toxic; however, higher doses potentially induced the hepatocellular vacuolization. In the present study, upregulation of Sult1e1, a phase 2 metabolism gene, indicated the possibility of sulfation of genistein. This might have contributed the resistance against this compound and conferred the glutathione depletion by enhancing the alternative route of genistein detoxification. Moreover, genistein modulated the steroid, fatty acid, and triglyceride metabolic pathways by regulating the mRNA expression of different enzymes (Hsd3b1, Hsd3b7, Hsd17b4, Hsd3b5, and Hsd17b11) and receptors (RXR-α).
In conclusion, elevated level of traditional serum biomarkers, degenerated hepatocytes, altered oxidative stress parameters, and differentially regulated genes are apparent indication of hepatotoxicity in genistein (500 and 1000 mg/kg) treated animals. Upregulation of cancer related pathways indicated the genistein induced perturbation which may lead to the several deleterious effects. This evidence suggested that there is a need to limit and regulate the dose of genistein in dietary supplements and in cancer therapeutics.
Supplementary Material
Reply- Table S1. List of differentially expressed genes under selected functional categories. Genes were grouped under functional categories to obtain the profoundness of gene expression results. (i) Stress and glutathione metabolism related genes, (ii) Defense and MAPK pathway related genes, (iii) ETS and glycolysis pathway related genes, (iv) Fatty acid, cholesterol, steroid and triglyceride metabolism related genes.
Acknowledgments
This work was supported by a grant from the Council of Scientific and Industrial Research under network Project NWP0034. Author Prabhat Singh has received fellowship from Department of Biotechnology, Government of India. Authors are thankful to Genotoxicity Lab members for their technical support.
Abbreviations
- ALT:
Alanine amino transferase
- AST:
Aspartate amino transferase
- ALP:
Alkaline phosphatase
- ROS:
Reactive oxygen species
- LPO:
Lipid peroxidation
- GSH:
Reduced glutathione
- GSSG:
Oxidized glutathione
- PP2:
4-Amino-5-(4-chlorophenyl)-7-(t-butyl) pyrazolo [3,4-d] pyrimidine
- IP:
Intraperitoneal
- MIAME:
Minimum Information About a Microarray Experiment
- MGED:
Microarray Gene Expression Data
- ETS:
Electron transport system.
Conflict of Interests
The authors declare that there is no conflict of interests regarding the publication of this paper.
References
- 1.Reinwald S, Mayer LP, Hoyer PB, Turner CH, Barnes S, Weaver CM. A longitudinal study of the effect of genistein on bone in two different murine models of diminished estrogen-producing capacity. Journal of Osteoporosis. 2010;2010:14 pages. doi: 10.4061/2010/145170.145170 [DOI] [PMC free article] [PubMed] [Google Scholar]
- 2.Borradaile NM, de Dreu LE, Wilcox LJ, Edwards JY, Huff MW. Soya phytoestrogens, genistein and daidzein, decrease apolipoprotein B secretion from HepG2 cells through multiple mechanisms. Biochemical Journal. 2002;366(2):531–539. doi: 10.1042/BJ20020046. [DOI] [PMC free article] [PubMed] [Google Scholar]
- 3.Cohen LA, Zhao Z, Pittman B, Scimeca JA. Effect of intact and isoflavone-depleted soy protein on NMU-induced rat mammary tumorigenesis. Carcinogenesis. 2000;21(5):929–935. doi: 10.1093/carcin/21.5.929. [DOI] [PubMed] [Google Scholar]
- 4.Rüfer CE, Kulling SE. Antioxidant activity of isoflavones and their major metabolites using different in vitro assays. Journal of Agricultural and Food Chemistry. 2006;54(8):2926–2931. doi: 10.1021/jf053112o. [DOI] [PubMed] [Google Scholar]
- 5.Sarkar FH, Adsule S, Padhye S, Kulkarni S, Li Y. The role of Genistein and synthetic derivatives of isoflavone in cancer prevention and therapy. Mini-Reviews in Medicinal Chemistry. 2006;6(4):401–407. doi: 10.2174/138955706776361439. [DOI] [PubMed] [Google Scholar]
- 6.Degen GH, Janning P, Diel P, Bolt HM. Estrogenic isoflavones in rodent diets. Toxicology Letters. 2002;128(1–3):145–157. doi: 10.1016/s0378-4274(02)00009-7. [DOI] [PubMed] [Google Scholar]
- 7.Messing E, Gee JR, Saltzstein DR, et al. A phase 2 cancer chemoprevention biomarker trial of isoflavone G-2535 (genistein) in presurgical bladder cancer patients. Cancer Prevention Research. 2012;5(4):621–630. doi: 10.1158/1940-6207.CAPR-11-0455. [DOI] [PMC free article] [PubMed] [Google Scholar]
- 8.Song WO, Chun OK, Hwang I, et al. Soy isoflavones as safe functional ingredients. Journal of Medicinal Food. 2007;10(4):571–580. doi: 10.1089/jmf.2006.0620. [DOI] [PubMed] [Google Scholar]
- 9.McClain RM, Wolz E, Davidovich A, Pfannkuch F, Bausch J. Subchronic and chronic safety studies with genistein in dogs. Food and Chemical Toxicology. 2005;43(10):1461–1482. doi: 10.1016/j.fct.2005.02.017. [DOI] [PubMed] [Google Scholar]
- 10.Cederroth CR, Zimmermann C, Beny J-L, et al. Potential detrimental effects of a phytoestrogen-rich diet on male fertility in mice. Molecular and Cellular Endocrinology. 2010;321(2):152–160. doi: 10.1016/j.mce.2010.02.011. [DOI] [PubMed] [Google Scholar]
- 11.Cimafranca MA, Davila J, Ekman GC, et al. Acute and chronic effects of oral genistein administration in neonatal mice. Biology of Reproduction. 2010;83(1):114–121. doi: 10.1095/biolreprod.109.080549. [DOI] [PMC free article] [PubMed] [Google Scholar]
- 12.Constantinou A, Kiguchi K, Huberman E. Induction of differentiation and DNA strand breakage in human HL-60 and K-562 leukemia cells by genistein. Cancer Research. 1990;50(9):2618–2624. [PubMed] [Google Scholar]
- 13.Kulling SE, Rosenberg B, Jacobs E, Metzler M. The phytoestrogens coumoestrol and genistein induce structural chromosomal aberrations in cultured human peripheral blood lymphocytes. Archives of Toxicology. 1999;73(1):50–54. doi: 10.1007/s002040050585. [DOI] [PubMed] [Google Scholar]
- 14.Salti GI, Grewal S, Mehta RR, Das Gupta TK, Boddie AW, Jr., Constantinou AI. Genistein induces apoptosis and topoisomerase II-mediated DNA breakage in colon cancer cells. European Journal of Cancer. 2000;36(6):796–802. doi: 10.1016/s0959-8049(00)00017-4. [DOI] [PubMed] [Google Scholar]
- 15.Snyder RD, Gillies PJ. Reduction of genistein clastogenicity in Chinese hamster V79 cells by daidzein and other flavonoids. Food and Chemical Toxicology. 2003;41(10):1291–1298. doi: 10.1016/s0278-6915(03)00117-0. [DOI] [PubMed] [Google Scholar]
- 16.di Virgilio AL, Iwami K, Wätjen W, Kahl R, Degen GH. Genotoxicity of the isoflavones genistein, daidzein and equol in V79 cells. Toxicology Letters. 2004;151(1):151–162. doi: 10.1016/j.toxlet.2004.04.005. [DOI] [PubMed] [Google Scholar]
- 17.Chen A-C, Donovan SM. Genistein at a concentration present in soy infant formula inhibits Caco-2BBe cell proliferation by causing G2/M cell cycle arrest. Journal of Nutrition. 2004;134(6):1303–1308. doi: 10.1093/jn/134.6.1303. [DOI] [PubMed] [Google Scholar]
- 18.Linford NJ, Yang Y, Cook DG, Dorsa DM. Neuronal apoptosis resulting from high doses of the isoflavone genistein: role for calcium and p42/44 mitogen-activated protein kinase. Journal of Pharmacology and Experimental Therapeutics. 2001;299(1):67–75. [PubMed] [Google Scholar]
- 19.Tsutsui T, Tamurai Y, Yagi E, et al. Cell-transforming activity and mutagenicity of 5 phytoestrogens in cultured mammalian cells. International Journal of Cancer. 2003;105(3):312–320. doi: 10.1002/ijc.11046. [DOI] [PubMed] [Google Scholar]
- 20.Allred CD, Allred KF, Ju YH, Virant SM, Helferich WG. Soy diets containing varying amounts of genistein stimulate growth of estrogen-dependent (MCF-7) tumors in a dose-dependent manner. Cancer Research. 2001;61(13):5045–5050. [PubMed] [Google Scholar]
- 21.Ju YH, Allred CD, Allred KF, Karko KL, Doerge DR, Helferich WG. Physiological concentrations of dietary genistein dose-dependently stimulate growth of estrogen-dependent human breast cancer (MCF-7) tumors implanted in athymic nude mice. Journal of Nutrition. 2001;131(11):2957–2962. doi: 10.1093/jn/131.11.2957. [DOI] [PubMed] [Google Scholar]
- 22.Rao CV, Wang CX, Simi B, et al. Enhancement of experimental colon cancer by genistein. Cancer Research. 1997;57(17):3717–3722. [PubMed] [Google Scholar]
- 23.Freireich EJ, Gehan EA, Rall DP, Schmidt LH, Skipper HE. Quantitative comparison of toxicity of anticancer agents in mouse, rat, hamster, dog, monkey, and man. Cancer Chemotherapy Reports. 1966;50(4):219–244. [PubMed] [Google Scholar]
- 24.Ellman GL. Tissue sulfhydryl groups. Archives of Biochemistry and Biophysics. 1959;82(1):70–77. doi: 10.1016/0003-9861(59)90090-6. [DOI] [PubMed] [Google Scholar]
- 25.Kakkar P, Das B, Viswanathan PN. A modified spectrophotometric assay of superoxide dismutase. Indian Journal of Biochemistry and Biophysics. 1984;21(2):130–132. [PubMed] [Google Scholar]
- 26.Mohandas J, Marshall JJ, Duggin GG. Low activities of glutathione-related enzymes as factors in the genesis of urinary bladder cancer. Cancer Research. 1984;44(11):5086–5091. [PubMed] [Google Scholar]
- 27.Ohkawa H, Ohishi N, Yagi K. Assay for lipid peroxides in animal tissues by thiobarbituric acid reaction. Analytical Biochemistry. 1979;95(2):351–358. doi: 10.1016/0003-2697(79)90738-3. [DOI] [PubMed] [Google Scholar]
- 28.Sinha AK. Colorimetric assay of catalase. Analytical Biochemistry. 1972;47(2):389–394. doi: 10.1016/0003-2697(72)90132-7. [DOI] [PubMed] [Google Scholar]
- 29.Wendel A. Glutathione peroxidase. Methods in Enzymology. 1981;77(C):325–333. doi: 10.1016/s0076-6879(81)77046-0. [DOI] [PubMed] [Google Scholar]
- 30.Lowry OH, Rosebrough NJ, Farr AL, Randall RJ. Protein measurement with the Folin phenol reagent. The Journal of Biological Chemistry. 1951;193(1):265–275. [PubMed] [Google Scholar]
- 31.Ghribi O, DeWitt DA, Forbes MS, Herman MM, Savory J. Co-involvement of mitochondria and endoplasmic reticulum in regulation of apoptosis: changes in cytochrome c, Bcl-2 and Bax in the hippocampus of aluminum-treated rabbits. Brain Research. 2001;903(1-2):66–73. doi: 10.1016/s0006-8993(01)02406-4. [DOI] [PubMed] [Google Scholar]
- 32.Ozer J, Ratner M, Shaw M, Bailey W, Schomaker S. The current state of serum biomarkers of hepatotoxicity. Toxicology. 2008;245(3):194–205. doi: 10.1016/j.tox.2007.11.021. [DOI] [PubMed] [Google Scholar]
- 33.Galati G, Lin A, Sultan AM, O’Brien PJ. Cellular and in vivo hepatotoxicity caused by green tea phenolic acids and catechins. Free Radical Biology and Medicine. 2006;40(4):570–580. doi: 10.1016/j.freeradbiomed.2005.09.014. [DOI] [PubMed] [Google Scholar]
- 34.Singh P, Mishra SK, Noel S, Sharma S, Rath SK. Acute exposure of apigenin induces hepatotoxicity in Swiss mice. PLoS ONE. 2012;7(2, article e31964) doi: 10.1371/journal.pone.0031964. [DOI] [PMC free article] [PubMed] [Google Scholar]
- 35.Gupta YK, Sharma M, Chaudhary G. Pyrogallol-induced hepatotoxicity in rats: a model to evaluate antioxidant hepatoprotective agents. Methods and Findings in Experimental and Clinical Pharmacology. 2002;24(8):497–500. doi: 10.1358/mf.2002.24.8.705070. [DOI] [PubMed] [Google Scholar]
- 36.Limaye PV, Raghuram N, Sivakami S. Oxidative stress and gene expression of antioxidant enzymes in the renal cortex of streptozotocin-induced diabetic rats. Molecular and Cellular Biochemistry. 2003;243(1-2):147–152. doi: 10.1023/a:1021620414979. [DOI] [PubMed] [Google Scholar]
- 37.Blum J, Fridovich I. Inactivation of glutathione peroxidase by superoxide radical. Archives of Biochemistry and Biophysics. 1985;240(2):500–508. doi: 10.1016/0003-9861(85)90056-6. [DOI] [PubMed] [Google Scholar]
- 38.Werner P, Cohen G. Glutathione disulfide (GSSG) as a marker of oxidative injury to brain mitochondria. Annals of the New York Academy of Sciences. 1993;679:364–369. doi: 10.1111/j.1749-6632.1993.tb18323.x. [DOI] [PubMed] [Google Scholar]
- 39.Nylandsted J, Rohde M, Brand K, Bastholm L, Elling F, Jäättelä M. Selective depletion of heat shock protein 70 (Hsp70) activates a tumor-specific death program that is independent of caspases and bypasses Bcl-2. Proceedings of the National Academy of Sciences of the United States of America. 2000;97(14):7871–7876. doi: 10.1073/pnas.97.14.7871. [DOI] [PMC free article] [PubMed] [Google Scholar]
- 40.Elia G, Santoro MG. Regulation of heat shock protein synthesis by quercetin in human erythroleukaemia cells. Biochemical Journal. 1994;300(1):201–209. doi: 10.1042/bj3000201. [DOI] [PMC free article] [PubMed] [Google Scholar]
- 41.Irwin RD, Boorman GA, Cunningham ML, Heinloth AN, Malarkey DE, Paules RS. Application of toxicogenomics to toxicology: basic concepts in the analysis of microarray data. Toxicologic Pathology. 2004;32(supplement 1):72–83. doi: 10.1080/01926230490424752. [DOI] [PubMed] [Google Scholar]
- 42.Noh DY, Ahn SJ, Lee RA, Kim SW, Park IA, Chae HZ. Overexpression of peroxiredoxin in human breast cancer. Anticancer Research B. 2001;21(3):2085–2090. [PubMed] [Google Scholar]
- 43.Liu X, Feng R, Du L. The role of enoyl-CoA hydratase short chain 1 and peroxiredoxin 3 in PP2-induced apoptosis in human breast cancer MCF-7 cells. The FEBS Letters. 2010;584(14):3185–3192. doi: 10.1016/j.febslet.2010.06.002. [DOI] [PubMed] [Google Scholar]
- 44.Mizrak SC, Bogerd J, Lopez-Casas PP, Párraga M, del Mazo J, de Rooij DG. Expression of stress inducible protein 1 (Stip1) in the mouse testis. Molecular Reproduction and Development. 2006;73(11):1361–1366. doi: 10.1002/mrd.20548. [DOI] [PubMed] [Google Scholar]
- 45.Lassle M, Blatch GL, Kundra V, Takatori T, Zetter BR. Stress-inducible, murine protein mSTI1. Characterization of binding domains for heat shock proteins and in vitro phosphorylation by different kinases. The Journal of Biological Chemistry. 1997;272(3):1876–1884. doi: 10.1074/jbc.272.3.1876. [DOI] [PubMed] [Google Scholar]
- 46.Sakudo A, Lee D-C, Li S, et al. PrP cooperates with STI1 to regulate SOD activity in PrP-deficient neuronal cell line. Biochemical and Biophysical Research Communications. 2005;328(1):14–19. doi: 10.1016/j.bbrc.2004.12.132. [DOI] [PubMed] [Google Scholar]
- 47.Bevers RFM, de Boer EC, Kurth K-H, Schamhart DHJ. BCG-induced interleukin-6 upregulation and BCG internalization in well and poorly differentiated human bladder cancer cell lines. European Cytokine Network. 1998;9(2):181–186. [PubMed] [Google Scholar]
- 48.Lehmann C, Taubert D, Jung N, et al. Preferential upregulation of interferon-α subtype 2 expression in HIV-1 patients. AIDS Research and Human Retroviruses. 2009;25(6):577–581. doi: 10.1089/aid.2008.0238. [DOI] [PubMed] [Google Scholar]
- 49.Rauer M, Pagenstecher A, Schulte-Mönting J, Sauder C. Upregulation of chemokine receptor gene expression in brains of Borna disease virus (BDV)-infected rats in the absence and presence of inflammation. Journal of NeuroVirology. 2002;8(3):168–179. doi: 10.1080/13550280290049741. [DOI] [PubMed] [Google Scholar]
- 50.Elliott JI, Higgins CF. Major histocompatibility complex class I shedding and programmed cell death stimulated through the proinflammatory P2X7 receptor: a candidate susceptibility gene for NOD diabetes. Diabetes. 2004;53(8):2012–2017. doi: 10.2337/diabetes.53.8.2012. [DOI] [PubMed] [Google Scholar]
- 51.Guddo F, Vignola AM, Saetta M, et al. Upregulation of basic fibroblast growth factor in smokers with chronic bronchitis. European Respiratory Journal. 2006;27(5):957–963. doi: 10.1183/09031936.06.00057205. [DOI] [PubMed] [Google Scholar]
- 52.Walker F, Abramowitz L, Benabderrahmane D, et al. Growth factor receptor expression in anal squamous lesions: modifications associated with oncogenic human papillomavirus and human immunodeficiency virus. Human Pathology. 2009;40(11):1517–1527. doi: 10.1016/j.humpath.2009.05.010. [DOI] [PubMed] [Google Scholar]
- 53.van Empel VPM, Bertrand AT, van der Nagel R, et al. Downregulation of apoptosis-inducing factor in harlequin mutant mice sensitizes the myocardium to oxidative stress-related cell death and pressure overload-induced decompensation. Circulation research. 2005;96(12):e92–e101. doi: 10.1161/01.RES.0000172081.30327.28. [DOI] [PubMed] [Google Scholar]
- 54.Hodek P, Trefil P, Stiborová M. Flavonoids-potent and versatile biologically active compounds interacting with cytochromes P450. Chemico-Biological Interactions. 2002;139(1):1–21. doi: 10.1016/s0009-2797(01)00285-x. [DOI] [PubMed] [Google Scholar]
- 55.Breinholt V, Lauridsen ST, Dragsted LO. Differential effects of dietary flavonoids on drug metabolizing and antioxidant enzymes in female rat. Xenobiotica. 1999;29(12):1227–1240. doi: 10.1080/004982599237903. [DOI] [PubMed] [Google Scholar]
- 56.Hirsch D, Stahl A, Lodish HF. A family of fatty acid transporters conserved from mycobacterium to man. Proceedings of the National Academy of Sciences of the United States of America. 1998;95(15):8625–8629. doi: 10.1073/pnas.95.15.8625. [DOI] [PMC free article] [PubMed] [Google Scholar]
Associated Data
This section collects any data citations, data availability statements, or supplementary materials included in this article.
Supplementary Materials
Reply- Table S1. List of differentially expressed genes under selected functional categories. Genes were grouped under functional categories to obtain the profoundness of gene expression results. (i) Stress and glutathione metabolism related genes, (ii) Defense and MAPK pathway related genes, (iii) ETS and glycolysis pathway related genes, (iv) Fatty acid, cholesterol, steroid and triglyceride metabolism related genes.