

Abstract
The chromatin template imposes an epigenetic barrier during the process of somatic cell reprogramming. Here, using fibroblasts derived from macroH2A double knockout mice we show that these histone variants act cooperatively as a barrier to induced pluripotency. Through manipulation of macroH2A isoforms, we further demonstrate that macroH2A2 is the predominant barrier to reprogramming. Genomic analyses reveal that macroH2A1 and macroH2A2, together with H3K27me3, co-occupy pluripotency genes in wild type fibroblasts. In particular, we find macroH2A isoforms to be highly enriched at target genes of the K27me3 demethylase, Utx, which are reactivated early in iPS reprogramming. Finally, while macroH2A double knockout induced pluripotent cells are able to differentiate properly in vitro and in vivo, such differentiated cells retain the ability to return to a stem-like state. Therefore, we propose that macroH2A isoforms provide a redundant silencing layer or terminal differentiation ‘lock’ at critical pluripotency genes that presents as an epigenetic barrier when differentiated cells are challenged to reprogram.
MacroH2A isoforms are unique H2A histone variants due to the presence of a 30kDa non-histone domain (macro domain) at their C-termini1. MacroH2A variants are generally considered transcriptionally repressive in nature due to their association with forms of condensed chromatin such as the inactive X chromosome (Xi)2-6, and inactive genes7-10. MacroH2A1 and macroH2A2 isoforms are encoded by two distinct genes (H2AFY and H2AFY2, respectively), and macroH2A1 is alternatively spliced, resulting in two macroH2A1 isoforms, macroH2A1.1 and macroH2A1.2, that differ by only one exon in the macro domain11.
The pluripotent stem cell state is under the control of a highly regulated transcriptional circuitry12, that is complemented by chromatin regulation13. Embryonic stem cell (ESC) chromatin is considered to be more ‘open’ than that of its differentiated progeny, with robust chromatin remodeling activities to allow for efficient chromatin reorganization that occurs during lineage specification14-16. In keeping with this, deposition of macroH2A1 is globally enriched in differentiated cells as compared to their pluripotent counterparts17.
Two recent studies have probed macroH2A isoforms in the context of ESC pluripotency via RNA interference. Both demonstrated that macroH2A isoforms are dispensable for self-renewal, however they conflicted on the role of macroH2A during differentiation. While one study showed that loss of macroH2A isoforms inhibits proper differentiation18, another reported that macroH2A-deficient ESCs executed X inactivation efficiently and were able to effectively differentiate towards multiple lineages19. Thus, the role of macroH2A in ESC differentiation remains ambiguous, as it has yet to be examined in the context of genetically deficient mice8,20.
MacroH2A isoforms have also been studied in the context of reprogramming via somatic cell nuclear transfer (SCNT). Intriguingly, macroH2A is rapidly removed from the mammalian somatic cell nucleus upon transplantation into mouse oocytes21-23. Using an alternative system of SCNT, Gurdon and colleagues implicated macroH2A as a factor conferring resistance to Xi reactivation of differentiated mammalian nuclei when transferred into Xenopus oocytes24.
Pluripotent cells can also be generated via ectopic expression of key pluripotency-related transcription factors (TFs) in somatic cells in order to generate induced pluripotent stem cells (iPSC)25 However, the epigenome imparts a barrier during the reprogramming process towards pluripotency26,27. We previously hypothesized that histone variants may act as an epigenetic barrier during somatic cell reprogramming because they are generally incorporated into chromatin in a replication-independent manner, and thus may mark particular genomic regions in fully differentiated cells27.
Here, we have examined the contribution of macroH2A isoforms via induced pluripotency using genetically engineered mouse models deficient for both macroH2A1 and macroH2A2. We find that while macroH2A isoforms act cooperatively, macroH2A2 acts as the predominant epigenetic barrier when somatic cells are challenged to reprogram. During normal ESC differentiation and in development, macroH2A isoforms are globally incorporated into chromatin, and deposited at pluripotency genes, such as the Oct4 locus, a master regulator of pluripotency28. While we demonstrate that macroH2A isoforms are not required for inactivating the pluripotency genes (due to redundant silencing mechanisms), we find that macroH2A and its highly associated histone modification, H3K27me3, are enriched at a set of Utx target genes required for the early stages of induced pluripotency. We suggest that the presence of macroH2A at these genes acts to prevent re-activation of critical pluripotency genes in differentiated cells, thus creating a barrier to reprogramming.
Results
macroH2A is dynamic during differentiation and reprogramming
We investigated the levels of both macroH2A1 and macroH2A2 isoforms in the histone and chromatin fractions of ESCs induced to differentiate by multiple methods. We observed increased macroH2A1 and macroH2A2 in the histone fraction of ESCs differentiated by retinoic acid (RA) (Fig. 1a), which was corroborated by quantitative mass spectrometry (qMS)29 (Fig. 1b). Using embryoid body (EB) formation assays, we detected similar global histone changes in the chromatin fraction (Fig. 1c). We also observed similar results by comparing ESCs with distinct differentiated cell types such as mouse embryonic fibroblasts (MEFs) and dermal fibroblasts (DFs) (Fig. 1d). Collectively, these data suggest that macroH2A isoforms are specifically deposited into chromatin upon differentiation as well as during mouse development. Of note, we also observed a decrease in H2A.Z levels in these studies, suggesting that macroH2A and H2A.Z histone variants might have distinct roles during ESC differentiation.
Figure 1. macroH2A chromatin deposition increases upon differentiation and is lost upon reprogramming.
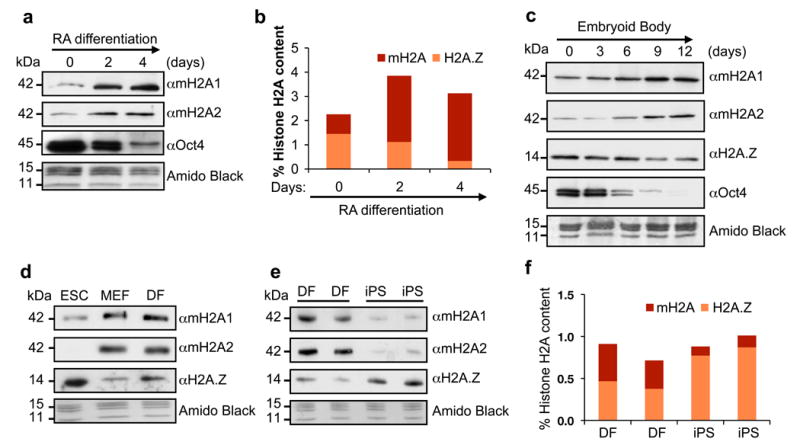
(a) Acid extracted histones from RA-differentiated CCE ESCs probed for macroH2A isoforms. Chromatin-bound Oct4 is used to confirm differentiation; Amido Black of core histones used for loading. (b) Histone H2A variant composition as analyzed by qMS during ESC RA-induced differentiation. Values represented as percentage of total H2A; two biological replicates, 6 technical replicates shown. (c) Chromatin fraction of EB time course (E14 ESCs) used to probe H2A variants. Oct4 is used to confirm differentiation; Amido Black of core histones used for loading. (d) Chromatin fraction of CCE ESC, MEFs and DFs probed for H2A variants. (e) Wt mouse DFs and their iPS-reprogrammed counterparts probed for H2A variants. (f) qMS analysis of macroH2A and H2A.Z using histones isolated from cells used in (e).
Next we questioned whether macroH2A isoforms are removed from the chromatin fraction upon somatic cell reprogramming. Therefore, we used the Cre-excisable Stemcca polycistronic lentivirus encoding Oct4, Sox2, Klf4, and Myc (OSKM)30 to reprogram multiple batches of DFs isolated from wild type (wt) Sv/129 mice. We observed that macroH2A1 and macroH2A2 levels are lower in the chromatin fraction of iPSCs when compared to the DFs, while H2A.Z levels are increased (Fig. 1e), and qMS analysis confirmed our immunoblot results (Fig. 1f). Together, these results suggest that low levels of macroH2A contribute to the pluripotent state and that macroH2A isoforms might act as a barrier to iPS reprogramming in somatic cells.
Characterization of macroH2A knockout dermal fibroblasts
In order to address this hypothesis, we isolated DFs from both wt and macroH2A1- and macroH2A2-deficient newborn mice (double knockout mice) (Fig. 2a; Supplementary Fig. S1a). These double knockout (dKO) mice are viable and free of obvious developmental defects (J.R.P., manuscript in preparation). Both male and female DFs were isolated in order to account for any potential sex differences that might be revealed during iPS reprogramming, since macroH2A coats the Xi in differentiated female cells (Fig. 2a).
Figure 2. macroH2A deficiency improves iPS reprogramming efficiency.
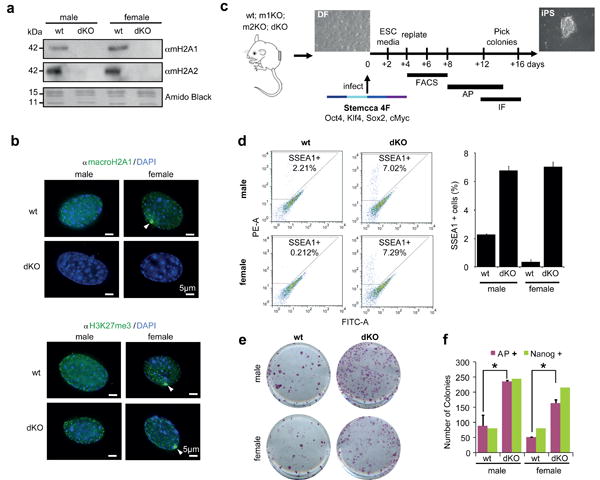
(a) Chromatin extracts from wt and dKO DFs probed for macroH2A1 and macroH2A2; Amido Black of core histones used for loading. (b) IF of macroH2A1 (top) and H3K27me3 (bottom) in wt and dKO male and female DFs. Note loss of macroH2A staining in dKO cells and enrichment of H3K27me3 at the Xi (white arrows) in female cells of both wt and dKO genotypes. DAPI used to stain DNA; Scale bar, 5μm. (c) Experimental scheme of iPS reprogramming from DF (wt, m1KO, m2KO and dKO) to iPS colonies, using a polycistronic lentiviral vector (Stemcca) encoding four factors (4F): Oct4, Sox2, Klf4, and Myc. Reprogramming efficiency was analyzed by FACS analysis of SSEA1 positive cells, alkaline phosphatase (AP) staining of iPS colonies, and IF for Nanog; time frame of experiments shown. (d) FACS plots for SSEA1-PE stained DFs showing increased percentage of SSEA1 positive cells in dKO (male and female) at 8 days post-infection; quantitation on the right. (e) Representative wells of AP positive iPS colonies, indicating increased reprogramming efficiency in dKO DFs at 14 days post-infection. (f) Number of colonies (AP and Nanog positive) obtained at day 14 post-infection; mean ± s.d. (n=3); unpaired Student's test (two tailed) p<0.05 (asterisk): p=0.05, male DFs (wt vs dKO); p=0.02, female DFs (wt vs dKO); Representative of 6 experiments with 4 biological replicates.
Next, we examined the staining pattern of macroH2A1 in the DFs. As expected, wt cells have macroH2A staining throughout the nucleus and an obvious Xi was observed in female cells. In contrast, no detectable nuclear staining was observed in the dKO cells of either sex (Fig. 2b). We also examined the staining pattern of H3K27me3, a facultative heterochromatic mark that tracks with macroH2A genomic binding and is enriched on the Xi6,7,9. Both female cells of wt and dKO origin retain an Xi as evidenced by H3K27me3 (Fig. 2b). These results are consistent with studies showing that loss of macroH2A1 does not reactivate the Xi31.
Because the efficiency of reprogramming can be affected by the proliferation rates of the starting somatic cells32, we examined the growth properties of wt and dKO DFs. Using proliferation assays, as well as 5-ethynyl-2′-deoxyuridine (EdU) incorporation studies to detect cells in S phase, we did not find significant differences between wt and dKO DFs (Supplementary Fig. S1b, c). Thus, any potential differences observed upon reprogramming are not due to the initial proliferative state of the DFs.
iPS reprogramming is enhanced in the absence of macroH2A
Using these well-characterized DFs, we performed iPS studies using Stemcca polycistronic lentivirus encoding OSKM (Fig. 2c). By performing FACS analysis for Stage Specific Embryonic Antigen-1 (SSEA1), we observed a notable increase in the SSEA1+ population in macroH2A dKO cells early in the reprogramming process (4-8 days) (Fig. 2d). This suggests that loss of macroH2A isoforms facilitates the early stages of reprogramming. Alkaline phosphatase (AP) staining, which marks undifferentiated ES-like cells, demonstrated enhanced reprogramming in macroH2A dKO cells (Fig. 2e, f). These results were corroborated by an independent reprogramming protocol via 4 Factor (4F) OSKM reprogramming with individual retroviral plasmids33, or through the expression of a Stemcca lentiviral vector encoding 3F OSK (excluding cMyc) (Supplementary Fig. S2).
Next, reprogrammed colonies were stained for markers of pluripotency, including Oct4 and Nanog (Supplementary Fig. S3). Nanog staining demonstrates bona fide pluripotency of the iPSC colonies, as it is not encoded by Stemcca. By counting Nanog positive colonies, we confirmed enhanced reprogramming in the absence of macroH2A isoforms (Fig. 2f). Of note, a tandem staining protocol of AP staining followed by Nanog immunofluorescence demonstrated that the majority of AP positive colonies were fully reprogrammed (Fig. 2f).
Collectively, these studies suggest that loss of macroH2A isoforms enhances iPS reprogramming. We note here that although macroH2A was reported to be a barrier to Xi reactivation in SCNT studies by Gurdon and colleagues24, we show here that macroH2A acts as a barrier to iPS reprogramming independent of its role in X inactivation, as male and female cells reprogram with similar efficiencies (Fig. 2 d-f).
macroH2A2 is the predominant barrier to reprogramming
We next inquired which macroH2A variants play a role in the reprogramming process. In order to address this question, we utilized DFs derived from both single (macroH2A1- or macroH2A2-deficient) and dKO mice (Fig. 3a). While both single KOs showed a trend toward increased reprogramming, we only observed a significant increase in reprogramming in the dKO DFs (Fig. 3b). This suggests that macroH2A1 and macroH2A2 act cooperatively in the reprogramming process.
Figure 3. macroH2A2 is the predominant epigenetic barrier in reprogramming.
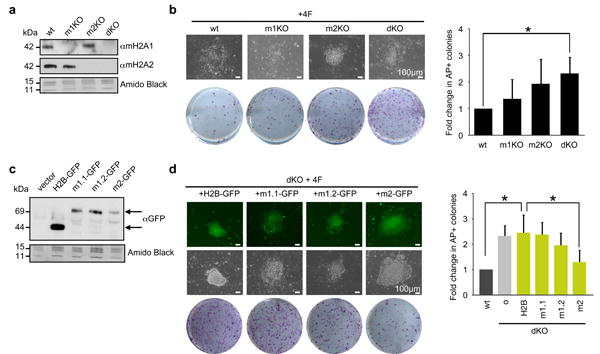
(a) Chromatin extracts from wt, macroH2A1 -/- (m1KO), macroH2A2 -/- (m2KO) and dKO DFs probed with macroH2A1 and macroH2A2 antibodies. Amido Black of core histones used for loading. (b) Representative wells of AP positive iPS colonies at 12 days post-infection, bright field image of single colonies shown; Scale bar, 100μm. Quantitation of fold-change in AP positive colonies over wt (shown right); mean ± s.d. (n=4); p value (asterisk): p=0.002 (wt vs dKO). (c) Chromatin extracts from dKO DFs expressing GFP-tagged macroH2A isoforms (top arrow), H2B-GFP (bottom arrow) and vector alone blotted for GFP. Amido Black of core histones used for loading. (d) Representative wells of AP positive iPS colonies at 12 days post-infection, bright field and fluorescence image of individual dKO colonies expressing H2B-GFP and macroH2A GFP-tagged isoforms; Scale bar, 100μm. Quantitation of fold-change in AP positive colonies over wt (shown right); [o] represents uninfected; mean ± s.d. (n=3); unpaired Student's test (two tailed) p value (asterisk): p=0.007 (wt vs dKO+H2B); p=0.036 (dKO+H2B vs dKO+m2).
In order to tease apart the role of the macroH2A1 splice variants, macroH2A1.1 and macroH2A1.2 and investigate barrier function by all individual macroH2A isoforms, we ectopically expressed macroH2A1.1, macroH2A1.2, and macroH2A2 as GFP-fusion proteins into dKO DFs (Fig. 3c and Supplementary Fig. S4a-c). Compared to canonical histone H2B, macroH2A2 significantly suppressed the enhanced reprogramming phenotype. While macroH2A1.1 had no effect, macroH2A1.2 showed a slight decrease in reprogramming efficiency (Fig. 3d). These data again suggest that macroH2A2 acts as the predominant epigenetic barrier, with a potential contribution from macroH2A1.2. Intriguingly, the expression of multiple macroH2A variants simultaneously in dKO DFs (mH2A1.1 + mH2A1.2, mH2A1.2 + macroH2A2, all three isoforms) did not show significant barrier function, although mH2A1.2 + macroH2A2 displayed a slight decrease in AP-positive colonies (Supplementary Fig. S4d, e). This might be due to competition between variants or to deregulation of incorporation into chromatin when variants are simultaneously overexpressed. In addition, because only macroH2A1.1 has the ability to bind ADP-ribose34, this function may prevent macroH2A1.1 from being involved in creating a barrier for iPS reprogramming and, in turn, inhibit macroH2A1.2 or macroH2A2 function.
macroH2A co-localizes genomically with H3K27me3 domains
In order to gain insights into the mechanism by which macroH2A isoforms inhibit reprogramming, we hypothesized that their absence might alter the histone post-translational modification (PTM) landscape. By qMS analysis we show that iPS reprogramming affects wt and dKO PTM changes similarly, including a striking increase of H3K27ac and decrease of H3K27me3 levels (Fig. 4a; Supplementary Fig. S5). H3K27me3 and macroH2A occupancy have similar patterns by ChIP-chip analysis3,5, and recently, H3K27me3 demethylation (via Utx) was shown to be a key step in iPS reprogramming35. Therefore, we further dissected the interplay between macroH2A and H3K27 PTMs.
Figure 4. macroH2A isoforms and H3K27me3 occupy pluripotency genes in DFs.
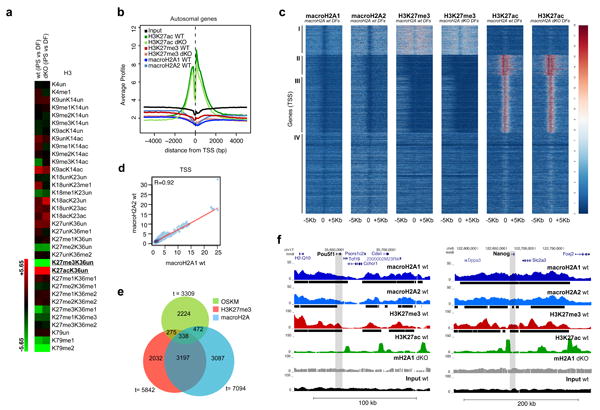
(a) qMS heatmap with H3 PTMs comparing iPS cells with DFs, in wt and mH2A dKO cells. H3K27me3 and H3K27ac are amongst the most striking changes upon reprogramming. Two technical replicates run for each of two biological samples. (b) Average signal (100bp window) of the ChIP-seq read counts normalized to total number of reads (counts per million reads), plotted against the distance (-5Kb, +5Kb), from the nearest annotated (USCS mm9) Transcription Start Site (TSS) of all autosomal genes. c) Heatmap of all annotated TSS (-5Kb, +5Kb) based on macroH2A1, macroH2A2, H3K27me3 and H3K27ac enrichment in wt and mH2A dKO DFs, with k-means clustering of all samples (k=4) allowing for four distinct classes of genes (I, II, III, IV). (d) Correlation plot of macroH2A1 and macroH2A2 ChIP-seq reads at the TSS of autosomal genes in wt DFs. Pearson correlation value (R=0.92) indicates a strong correlation between macroH2A1 and macroH2A2. (e) Venn diagram representing genes enriched in H3K27me3, macroH2A-bound genes (combined macroH2A1 and macroH2A2 targets) and bound by at least one of the four (OSKM) factors37. (f) ChIP-seq profiles (UCSC browser) of two major pluripotency genes (Pou5f1 (Oct4) and Nanog) for macroH2A1, macroH2A2, H3K27me3 and H3K27ac; grey bar represents the gene body region. Chromatin ‘domains’ identified with Sicer annotated under each profile (black bar); macroH2A1 ChIP-seq in dKO DFs and Input used as controls.
We next investigated macroH2A1, macroH2A2, H3K27me3 and H3K27ac genomic occupancy by native chromatin immunoprecipitation followed by deep sequencing (ChIP-seq) in wt DFs (Supplementary Fig. S6). We also performed ChIP-seq for K27 PTMs in dKO DFs in order to examine any potential differences in their patterns in the absence of macroH2A (see below; Supplementary Fig. S6). Consistent with our previous macroH2A1 ChIP-seq studies in K562 cells, we observed that transcription start sites (TSSs) lack macroH2A isoforms, while macroH2A-containing nucleosomes are present at upstream regulatory regions and/or gene bodies, and that macroH2A1 and macroH2A2 form large domains10 (Fig. 4b; Supplementary Fig. S6b). We also observed that macroH2A1, macroH2A2 and H3K27me3 followed a similar occupancy pattern around TSSs, while H3K27ac was enriched at TSSs36 (Fig. 4b). Of note, macroH2A1 ChIP in macroH2A dKO cells was performed as a control, generating a very low number of unique alignments and an enrichment pattern similar to Input sample (Supplementary Fig. S6).
Based on the ChIP-seq signal around the TSS of the six different data sets (of all annotated autosomal genes), we were able to identify four distinct classes of genes (Fig. 4c). Class I in particular, consists of genes bound by macroH2A1 and macroH2A2 that are enriched for H3K27me3, and devoid of H3K27ac (Fig. 4c and Supplementary Fig. S7a; see below). In this class of genes, there is strong macroH2A enrichment both upstream and downstream of the TSS, which we have previously shown to associate with transcriptionally repressed genes10. Next, by comparing all ChIP-seq reads using a pair-wise correlation analysis, we observed a striking correlation between macroH2A1 and macroH2A2 (Pearson correlation R=0.92 for TSS; R=0.94 for genome-wide) (Fig. 4d and Supplementary Fig. S7b). We therefore combined macroH2A1 and macroH2A2 target genes (referred to as macroH2A-bound genes), for further analysis. Hierarchical clustering also confirmed a correlation between both macroH2A isoforms and H3K27me3, while none of these repressive marks positively correlate with H3K27ac (Supplementary Fig. S7b). Interestingly, we did not observe a significant difference in enrichment of H3K27me3 and H3K27ac in the absence of macroH2A, as calculated using a Pearson correlation for the samples in wt and macroH2A dKO DFs. (Fig. 4c, Supplementary Fig. S7c).
Collectively, global analysis of our ChIP-seq data demonstrates the following: i) a striking genome-wide correlation between macroH2A1 and macroH2A2, which correlates with H3K27me3 and ii) the absence of macroH2A isoforms does not globally alter H3K27 PTMs in the ground state of dermal fibroblasts.
macroH2A occupies genes encoding pluripotency regulators
In order to probe the role of macroH2A as a barrier to reprogramming, we queried its presence at genes bound by at least one of the 4F (OSKM) 37. These factors activate the ESC-specific transcriptional network through their binding mostly at promoter regions37. We found that macroH2A is present at ∼24% (810/3309) of OSKM-bound genes, while H3K27me3 occupies ∼18% (613/3309) in DFs (Fig. 4e).
Next, we investigated the profiles of the master regulators of pluripotency. By examining the Oct4 (Pou5f1) and Nanog loci, using the UCSC browser, a macroH2A/H3K27me3 domain is evident (Fig. 4f). Such domains often span large regions of up to 100-200kb, encompassing multiple genes and their regulatory regions. Next, we confirmed the macroH2A landscape at the Pou5f1 locus (which encodes Oct4) by ChIP-qPCR analysis. We observed a peak of macroH2A1 enrichment upstream of the transcriptional start site (TSS) at the enhancer elements of Pou5f1 (Supplementary Fig. S8a). The distal enhancer (-2Kb) is a site where the pluripotency TFs bind and regulate Oct4 expression in ESCs38. ChIP analysis of Oct4 itself, Nanog and Sox2 demonstrates distinct binding at the -2kb position in ESCs (Supplementary Fig. S8b). Furthermore, we performed ChIP analysis for macroH2A1 at the distal enhancer element in ESCs undergoing differentiation, which shows macroH2A1 deposition upon RA differentiation (Supplementary Fig. S8c), and is consistent with its global chromatin deposition (Fig. 1).
macroH2A is enriched at Utx target genes
The studies above suggested that macroH2A and H3K27me3 might work together in reinforcing silent states of pluripotency genes in differentiated cells. These data, combined with an SSEA1 positive population early in the reprogramming process in macroH2A dKO cells (Fig. 2d), led us to query published data sets describing genes induced early in reprogramming. Recently the H3K27me3 histone demethlyase, Utx, was described as a critical enzyme in the induction of iPS reprogramming35. Utx regulates the re-activation of a class of ∼1400 genes that are transcriptionally upregulated in the early stages of reprogramming. Of these genes a subset of ∼100 genes had aberrantly high levels of H3K27me3 in Utx depleted cells, suggesting their reactivation was inhibited by retention of H3K27me3.
By overlaying our ChIP-seq data onto Utx targets with aberrant H3K27me335, we found that Utx targets are composed primarily of Class I genes, which are enriched for macroH2A and H3K27me3 (Fig. 5a). Next, we compared macroH2A, H3K27me3 and H3K27ac ChIP-seq data sets with the gene sets that displayed either normal or aberrant H3K27me3 levels. In keeping with the findings of Hanna35, we find marked enrichment of H3K27me3 (88%) at the aberrantly methylated genes in wt DFs (Fig. 5b). Our analysis also revealed a striking enrichment of macroH2A-bound genes at these Utx target genes (75%), which contains TFs such as Sall1 and Sall4 (Fig. 5b). Using the UCSC browser, we observed distinct macroH2A/H3K27me3 domains at these pluripotency promoting factors (Fig. 5c).
Figure 5. macroH2A occupancy inhibits activation of Utx target genes required early in iPS reprogramming.

(a) Pie chart of Utx target genes with aberrant H3K27me3 methylation (in Utx KO)33 composed of the four classes of genes from Fig. 4c. (b) Comparison of genes marked by H3K27me3, H3K27ac and macroH2A-bound genes (combined macroH2A1 and macroH2A2 targets) in wt DFs and genes reactivated early in iPS reprogramming with normal H3K27me3 demethylation in Utx KO cells (top) versus genes that aberrantly retain H3K27me3 in Utx KO cells (bottom)35. MacroH2A is enriched in genes that are unable to demethylate H3K27me3 in the absence of Utx. (c) ChIP-seq profile (UCSC browser) of two genes bound by macroH2A1, macroH2A2 and H3K27me3 in DFs that are not properly demethylated in the absence of Utx during reprogramming (Sall1 and Sall4 - grey bar represents the gene body region). Chromatin ‘domains’ identified with Sicer annotated under each profile (black bar). MacroH2A1 ChIP-seq in dKO DFs and Input used as controls. (d) Time course analysis of mRNA expression of three Utx target genes (Fgf4, Sall1 and Sall4) during reprogramming shows delayed induction in wild type DFs as compared to macroH2A dKO DFs. Relative expression is plotted using ribosomal L7 as a house keeping gene, and compared to DFs at day 0, mean ± s.d. (n=3).
To address the role of macroH2A occupancy at these genes, we probed the kinetics of pluripotency gene activation during reprogramming. Using qRT-PCR analysis, we compared the activation of multiple Utx target genes that are also bound by macroH2A in both wt and mH2A dKO DFs. Indeed, the absence of macroH2A leads to a more robust, and in some cases, an earlier transcriptional activation of such genes (Fig. 5d). Collectively, our data suggests that macroH2A and H3K27me3 cooperate in repressing pluripotency factors in differentiated cells and must be removed upon reprogramming to reactivate a critical set of early iPS-induced genes.
Absence of macroH2A does not impair pluripotency
Next, we queried whether macroH2A isoforms play a significant role in differentiation. Therefore, as depicted in Fig. 2c, iPSC colonies were picked and expanded in order to generate both wt and dKO iPSC lines. These cells were treated with a Cre recombinase-expressing adenovirus to remove the Stemcca cassette (Supplementary Fig. S9a). Using these lines, we investigated pluripotency potential in the absence of macroH2A isoforms.
Both wt and dKO iPSCs grew similarly to ESCs, without signs of spontaneous differentiation (Fig. 6a; bright field). In addition, AP and Nanog positive staining was observed in both dKO and wt iPSCs (Supplementary Fig. S9b). Next, we examined the reactivation of the Xi, a hallmark of fully reprogrammed iPSCs39, through H3K27me3 staining. Neither the wt nor the dKO iPSCs (two female lines of each examined) showed evidence of an Xi (Supplementary Fig. S9b). Therefore, the dKO cells displayed ESC-like features such as self-renewal, expression of pluripotency markers, and showed no evidence of Xi chromosomes. These results are consistent with recently published studies whereby loss of macroH2A isoforms in ESCs (via shRNAs) did not show evidence of a compromised ESC state18,19.
Figure 6. macroH2A dKO iPS cells are pluripotent and retain stem-like plasticity.
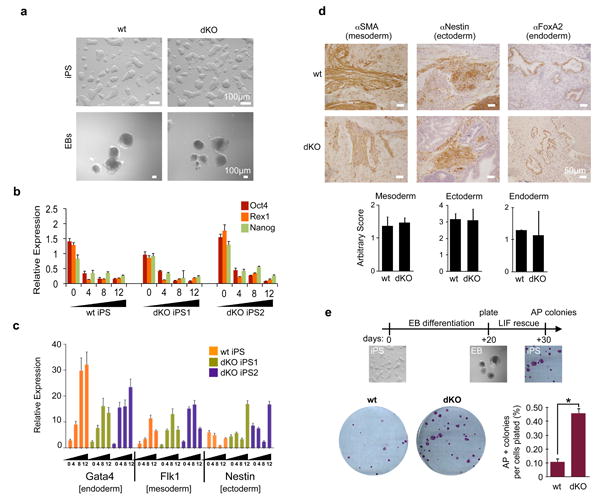
(a) Bright field of iPS cells and EBs (day 12) derived from wt and dKO DFs display no morphological differences; Scale bar, 100μm. (b) Expression of pluripotency regulators (Oct4, Rex1 and Nanog) was analyzed by qPCR during EB differentiation for the course of 12 days; relative expression is plotted using ribosomal L7 as a house-keeping gene, and compared to ESC levels, mean ± s.d. (n=3). (c) Expression of differentiation markers was analyzed by qPCR during EB differentiation showing up-regulation of lineage markers of all three germ layers. Relative expression is plotted using ribosomal L7 as a house-keeping gene, and compared to ESC levels, mean ± s.d. (n=3). (d) IHC of representative wt and dKO teratomas derived from iPSCs, probing for mesoderm (SMA), ectoderm (Nestin) and endoderm (FoxA2). Each cross section was scored by number of positively stained structures per slide, mean ± s.d. (n=3) Scale bar, 100μm. No statistical differences were observed upon quantification of staining (below). (e) Experimental scheme of LIF rescue analysis shown on top. Numbers of AP positive colonies were analyzed after 7-10 days. Quantification of AP positive colonies per number of cells plated, mean ± s.d. (n=3); unpaired Student's test (two tailed) p=0.0002 (asterisk); representative wells shown.
Next, the pluripotency of wt and macroH2A dKO iPSCs was challenged. Differentiation was induced via EB formation assays, and similar morphology was observed between the two genotypes (Fig. 6a). To further examine the EB differentiation, we dissected the gene expression profiles of both pluripotency genes and lineage markers of all three germ layers. Quantitative RT-PCR (qRT-PCR) demonstrated a drop in expression of pluripotency markers Nanog, Oct4 and Rex1 with similar kinetics in both wt and dKO cells (as to ESCs), suggesting that loss of macroH2A does not affect silencing of these genes (Fig. 6b). Although macroH2A is deposited at pluripotency genes (such as Pou5f1) during differentiation (Supplementary Fig. S8c), they are also silenced by additional mechanisms such as H3K27me3, as well as H3K9me3 and DNA methylation40,41. This suggests that macroH2A is not required for initial silencing of pluripotency genes, but may act to maintain silencing in coordination with other silencing mechanisms, akin to its role at the Xi4.
We also examined the kinetics of lineage marker expression towards the three germ layers upon EB differentiation. This analysis displayed remarkable similarity between wt and dKO iPSCs (Fig. 6c). We surveyed the expression of at least three markers of each lineage, endoderm, mesoderm and ectoderm (Fig. 6c, Supplementary Fig. S10a-c). Moreover, wt iPSCs show deposition of macroH2A1 and macroH2A2 in the chromatin fraction upon differentiation, with similar kinetics to ESCs (Fig. 1c), while macroH2A dKO cells display no signals, as expected (Supplementary Fig. S10d). Chromatin-bound levels of both Oct4 and H2A.Z decreased in a similar fashion in wt, dKO cells, and ESCs (Supplementary Fig. S10d; Fig. 1c).
Next, wt and dKO iPSCs were injected into immunodeficient mice for teratoma analysis. Here, we observed formation of all three germ layers from both wt and dKO cells by Hematoxylin and Eosin staining (Supplementary Fig. S10e). Using antibodies specific for mesodermal (Smooth-Muscle Actin), neuroectodermal (Nestin) and endodermal (FoxA2) lineages, we performed immunohistochemistry (IHC) and quantified positively stained structures in both wt and macroH2A dKO iPS-derived teratomas (Fig. 6d). No significant differences were observed between wt and macroH2A dKO cells for any of the lineage markers (Fig. 6d). Collectively, our pluripotency studies indicate that the absence of macroH2A isoforms does not compromise the self-renewal or differentiation potential of dKO iPSCs.
To assess the capacity of such differentiated cells to return back to an ESC-like state, differentiated EBs (day 20) were then challenged in ESC media in the presence of LIF. After one week, the number of colonies formed per cell plated was determined (Fig. 6e). Consistent with our iPS reprogramming studies, we find that EB differentiated cells lacking macroH2A showed an increased ability to form AP-positive colonies, even after a prolonged period of differentiation, suggesting they retain stem-like plasticity.
Discussion
In recent years, there has been an overwhelming interest in pluripotent ESCs because of their potential to understand developmental processes and treat human disease42. Therefore, the ability to reprogram somatic cells to a pluripotent state, particularly by iPSC methodologies, has generated much excitement43. Yet despite its potential impact, the molecular mechanisms of reprogramming, especially as they relate to chromatin biology, remain unclear.
Recent studies have begun to address the role of chromatin factors during reprogramming, such as Chd144,the BAF45 complex and Wdr546. Interestingly, many of the global PTM changes that we found by our qMS analysis of iPSCs versus DFs (Fig. 4a), have recently been described to be necessary for iPS reprogramming. These include loss of K79me2/3 (via antagonizing Dot1L methyltransferase)47, loss of K36me2/3 (mediated by Kdm2b)48, loss of H3K9me2/3 (via antagonizing Suv39H1 or G9a methyltransferases)47,49 and relevant to this study, loss of H3K27me3 (mediated by Utx)33. Moreover, increased global levels of acetylation such as H3K27ac and H3K9ac were also detected by qMS, and are modulated through inhibition of HDACs27 (Fig. 4a; Supplementary Fig. S5).
However, little is known of the role of histone variants in the context of iPS reprogramming. Here we demonstrate that macroH2A acts as a barrier to iPSC reprogramming. Our findings are consistent with the role of macroH2A in SCNT, albeit with differences depending on the recipient species22,24. First, macroH2A is rapidly removed from the mammalian somatic cell nucleus upon transplantation into mouse oocytes, suggesting that its presence creates a barrier to genome-wide reprogramming22. In the Xenopus model system, macroH2A presence correlates with a lack of Xi reactivation, suggesting it acts as a barrier at this specialized domain of heterochromatin24. Finally, Pasque et al. recently demonstrated an inhibitory role for macroH2A isoforms in iPS reprogramming using RNAi approaches50.
Here we have explored the genomic landscape of macroH2A and demonstrate that macroH2A1 and macroH2A2, along with H3K27me3, are physically present at pluripotency genes in differentiated cells. Notably, macroH2A deposition is significantly enriched at Utx target genes, which are critical during the early stages of reprogramming. In fact, in macroH2A dKO cells, the expression of SSEA1 (an early marker of reprogramming) was significantly increased when compared to wt fibroblasts (Fig. 2d). This suggests that loss of macroH2A isoforms facilitates the early stages of reprogramming upon ectopic OSKM (and OSK) expression, possibly by allowing for more efficient chromatin remodeling or facilitating demethylation of H3K27me3. Consistent with this, our kinetic studies during reprogramming suggest that Utx target genes are more efficiently reactivated in macroH2A dKO DFs than in wt cells.
Despite the strong correlation between macroH2A-bound genes and H3K27me3, the absence of macroH2A isoforms does not affect H3K27me3 localization in DFs, suggesting a redundancy between the two repressive modifications. Although the mechanism by which macroH2A gets deposited in chromatin is unknown (ATRX negatively regulates macroH2A deposition10), its chromatin incorporation may be important to stabilize H3K27me3 at pluripotency genes during reprograming, thus acting as a barrier. Alternatively, since aberrantly methylated Utx target genes are also bound by macroH2A1 and macroH2A2, it is possible that H3K27me3-containing nucleosomes are a flag for macroH2A deposition.
Here, we propose that macroH2A isoforms provide a redundant silencing layer at pluripotency genes that, in turn, presents as an epigenetic barrier when differentiated cells are challenged to reprogram (Fig. 7). Our data shows that macroH2A is not required for the initial silencing of pluripotency genes during differentiation, but is incorporated into pluripotency gene regulatory sites during the process. This is similar to the late deposition of macroH2A at the Xi, and suggests that formation of a multi-layered barrier prevents re-activation of unwanted genes in a somatic cell that might trigger alternative cell fates. In turn, we find that while cells derived from the genetically deficient macroH2A mouse model display enhanced reprogramming, they do not showed impaired differentiation. This is in contrast with a recent study where depletion of macroH2A isoforms in ESCs via RNAi showed differentiation defects18. These differences may be attributed to the approaches used (knockout vs. knockdown) or technicalities of the differentiation methods used.
Figure 7. The histone variant macroH2A acts as a barrier to somatic cell reprogramming.

macroH2A is enriched in somatic cells enabling pluripotency genes to be maintained in a repressed state in differentiated cells. This deposition is correlated with enrichment of the repressive mark H3K27me3. Upon over-expression of reprogramming factors in differentiated cells, macroH2A provides an extra layer of silencing at pluripotency genes, and therefore acts as a barrier to reprogramming. The histone demethylase Utx is required to remove H3K27me3 at a subset of genes, also bound by macroH2A, that need to be reactivated upon reprogramming. Differentiation of pluripotent stem cells is not impaired in the absence of macroH2A, as it likely acts as a final ‘lock’ upon other silencing mechanisms. However, differentiated cells (e.g. EBs) lacking macroH2A are more amenable to reactivation of the pluripotent state, further suggesting that its presence induces a barrier to reprogramming in differentiated cells.
In closing, deciphering the regulation of transcriptional programs during development by incorporation of histone variants may broaden our perspectives on cell identity, i.e., by restricting cellular plasticity in the case of macroH2A, or by modulating cellular memory, as has been suggested for the H3 variant H3.351. As macroH2A has been implicated as a tumor suppressor52,53, these new avenues may also enhance our understanding of cancer biology.
Methods
Cell culture
Dermal fibroblasts (DFs), mouse embryonic fibroblasts (MEFs), and HEK293 cells were grown in DMEM (CellGro) with 10% FBS and 1% Pen/Strep. CCE ESCs (ES cell line derived from a male 129/Sv mouse strain), E14 (ES cell line derived from a male 129/Ola mouse strain) and iPSCs were maintained in standard ES media (see Supplementary Materials and Methods for details).
Plasmids
The 4F (Oct4, Sox2, Klf4 and Myc) used for iPS reprogramming are encoded in a polycystronic lentiviral vector (Stemcca, kindly provided by Gustavo Mostoslavsky, Boston University). Human H2B-GFP is encoded in pLKO.1, and GFP-tagged rat macroH2A1.1, rat macroH2A1.2, and human macroH2A2 constructs were cloned into this same plasmid.
Differentiation procedures
For retinoic acid (RA) differentiation, ESCs were plated on 0.1% gelatin coated plates at a density of 5×10⁴. The next day, LIF was removed and 2uM of RA was administered. Embryoid bodies (EBs) were formed by plating 1×10⁶ cells into low attachment conditions (suspension culture) in ES media without LIF.
Dermal fibroblast isolation
Pregnant females of known genotype were individually caged on day E18.5. Pups were sacrificed following the IACUC guidelines (protocol # 803525, University of Pennsylvania), and skins were carefully removed and placed in sterile PBS. Pups were sexed by checking the presence of the male or female gonads and were grouped according to their sex. Skins were placed with the dermal side down into a sterile 35 mm Petri dish and floated in 0.25% trypsin-EDTA overnight in 4°C. The following day, the epidermis was removed and dermis was incubated in 0.2% collagenase in DMEM for 1 hour at 37°C. The dermis was shaken to release the fibroblasts, and this mixed cell population was pelleted and plated in DMEM with 10% FBS, 1% P/S, 2.5 units/ml Amphotericin B, and 2 mM L-Glutamine. Calcium was raised to 6 mM to induce calcium-dependent differentiation and detachment of contaminating keratinocytes.
iPS reprogramming
iPS reprogramming was performed as described31 with slight modifications. Early passage DFs were plated on DMEM with 10%FBS and 1% Pen/Strep one day before infection according to the well surface area (10,000 cells on a 24well plate, 50,000 cells on a 6 well plate or 500,000 on a 100mm dish). Cells were infected by adding ultra-concentrated virus, with fresh media and 8 ng/μl Polybrene (Millipore) overnight. For overexpression of the GFP-tagged histones, cells were plated as described above, and infected the following day. Two days later they were passaged and infected with 4F the following day. ESC media was added two days after infection, and 4-5 days post-infection the cells were trypsinized and re-plated onto 6-well plates with inactivated MEFs. Alkaline phosphatase (AP) staining was performed according to the manufacture's protocol (Stemgent). Immunofluorescence for Nanog was performed on 6-well plates after AP staining, as described below. SSEA1 staining was performed using a mouse monoclonal anti-SSEA-1 antibody conjugated to Phycoerythrin (PE), and was performed according to the manufacture's protocol (R&D). Staining was analyzed by FACS on a LSRII machine and data was analyzed with Flowjo.
Chromatin fractionation and histone acid extraction
Procedures performed as described10.
Quantitative Mass Spectrometry
Immunofluorescence and immunoblots
Immunoblots were performed as described10. For immunofluorescence, ESCs, iPSCs or DFs were plated on chamber glass slides pre-coated with Matrigel (BD Biosciences). Immunofluorescence was performed as described44. Fluorescently conjugated secondary antibodies were subsequently used Alexa-488/594 (Molecular Probes). Nuclei were counterstained with DAPI and slides were mounted in vectashield (Vector Laboratories). Images presented were acquired on a Zeiss Imager Z1 microscope via deconvolution of 20-30 Z-stack projections using the AxioVision 40 Version 4.8.1.0 software, or were taken from a single projection. For a full list of antibodies used, please see Supplementary Materials and Methods.
cDNA isolation and quantitative PCR
RNA was extracted with the QIAGEN RNeasy Mini Kit. A total of 1ug of RNA was used to synthesize cDNA using Superscript II and Oligo d(T) primers (Invitrogen). qPCR and mRNA analysis was carried out as described44. cDNA expression was normalized to L7 levels. Primer sequences are provided in Supplementary Materials and Methods.
Native Chromatin Immunoprecipitation and ChIP-seq
Native mH2A1 ChIP (Abcam, ab37264), H3K27me3 (Millipore, 07-449) and H3K27ac (Abcam 4729) was performed in wt and macroH2A dKO male DFs; macroH2A2 (Bernstein lab) was performed in wt and dKO female DFs. Input DNA was also prepared and subsequent sequencing on all samples was performed using Illumina Hi-Seq as described10. qPCR on ChIP DNA was performed as described above. Primer sequences are provided in Supplementary Materials and Methods.
ChIP-seq data analysis
Sequence reads were aligned to the mouse genome NCBI build 37 (UCSC, mm9) using Bowtie short read aligner55 (v 0.12.7), with the following parameters: seed of 50bp, maximum 2 mismatches, suppression (m) = 20, and reported alignments (k) = 20. Wiggle files (HAFEZ, unpublished pipeline D.H.), were generated using a 500bp window sliding 250bp, counting the number of aligned reads (5′ end of each aligned read), for both ChIP and Input samples. The number of alignments from each window was normalized to the total number of alignments and scaled by factor of 10(x002C6)7, to allow comparison between different samples. MACS software56 (v 1.4.1) was used to identify peaks (p value cutoff = 1.00e-04 (5e-5 for K27me3 and K27Ac; 5e-3 for mH2A1; 5e-4 for mH2A2), (bw) = 300). Genes bound by either macroH2A1, macroH2A2, H3K27me3 or H3K27ac were found by Peak2Gene57 software tool (www.cistrome.org), allowing a span of 5 kb upstream or downstream of the peak. Analysis of histone variants/chromatin modifications with enrichment in broad domains was performed using Sicer58 (Window 200bp, Gap 200bp, fragment size 150bp, p value cutoff=0.01).
TSS analysis
The relative positions of aligned reads to the TSS were generated using RefSeq gene annotations downloaded from the UCSC genome browser (mm9). Analysis of reads distribution around the TSS (+5Kb and -5Kb) was performed with a sliding window (100bp) using the SitePro tool from Cistrome57 (www.cistrome.org).
Correlation analysis of ChIP-seq data
Hierarchical clustering and correlation coefficient values between samples (genome scale or around the TSS) was performed using the integrative analysis tool from Cistrome57 (www.cistrome.org), with a size window of 100Kb. Heatmap of the enrichment of each sample in all annotated TSSs (+5Kb and -5Kb) was generated using Heatmap from Cistrome57 (www.cistrome.org) with Kmeans clustering of 4 classes calculated amongst all samples. TSS analysis of the four classes of genes was performed using the SitePro tool from Cistrome57 (www.cistrome.org) with 100bp resolution. Venn Diagrams and other comparative analysis were performed with an R script using macroH2A-bound genes (combined macroH2A1 and macroH2A2 targets) and the genes enriched in H3K27me3 and H3K27ac (our data sets), and previously published data on genes bound by OSKM37, and early reprogramming/Utx target genes35.
Data deposition
All ChIP-Seq data sets deposited to NCBI's Gene Expression Omnibus with the deposition number GSE40813.
Cross-linked ChIP-qPCR
Formaldehyde fixed ChIP was carried out essentially as described53 with the following antibodies: macroH2A1 (Abcam, ab37264), Nanog (Cosmo Bio, REC-RCAB0002P-F), Oct4 (Santa Cruz, sc8628), Sox2 (Santa Cruz, sc17320) and IgG (Millipore, 12-370).
Teratoma Formation
Three different dilutions of iPSCs were used to inject subcutaneously into NOD/SCID mice (0.1×10⁶, 0.5×10⁶, 1×10⁶) using a 1:1 solution of DMEM and Matrigel (BD Biosciences). After 6–8 weeks, teratomas were harvested and fixed in 10% formalin overnight. Samples were then embedded in paraffin, and sections were stained with hematoxylin and eosin (Histopathology Core, Mount Sinai School of Medicine). Immunohistochemistry (IHC) was performed using antibodies against alpha-SMA (mesoderm) and FoxA2 (endoderm) as described53. Nestin staining (ectoderm) was performed using M.O.M. kit (Vector labs). IHC images (10 per antibody stain, per section) were taken on a Nikon E-600 microscope with NIS Elements software (Nikon). Images were scanned and quantified for the number of individual structures/clusters of cells positive by HRP-staining. Three tumors were analyzed per condition.
LIF rescue assay
Differentiated EBs (day 20) were washed with PBS, trypsinized, and resuspended in ESC media. Cells were plated at 5,000, 10,000 or 15,000 cells per gelatinized plate. After 7–10 days, colonies were fixed and stained for AP (Stemgent). The number of colonies were counted and plotted as percentage of AP-positive colonies per cells plated.
Supplementary Material
Acknowledgments
The authors thank the MSSM ESC/iPS Shared Resource Facility, especially Sunita D'Souza and Vera Alexeeva. The authors also thank the MSSM Genomics Core Facility. The authors thank the following people for advice, reagents and technical support: Su-Yi Tsai, Michael Rendl, Yen-Sin Ang, Simona Podgrabinska, Suvandu Das, Mihaela Skobe, Dung-Fang Lee, Matthew O'Connell, Satish Mungamuri, Stuart Aaronson, Dannee Chen, Gustavo Mostoslavsky, Chiara Vardabasso, Valerie Gouon-Evans, Jacob Hanna and Elena Ezhkova. This work is supported by a Ph.D. fellowship from CONACyT (239663) to D.V-G., NIGMS grant GM078465 to I.R.L., NIGMS grant GM49351 to J.R.P., an NIH Innovator award (DP2OD007447) and NSF Faculty Early CAREER award to B.A.G., and NYSTEM IDEA Award C024285 and NCI/NIH R01CA154683 to E.B.
Footnotes
Author Contributions: A.G.M, K.R. and E.B. conceived of this study. A.G.M performed DF isolations, all iPS experiments, and ChIP. Z.A.Q. performed immunoblots, ESC differentiation, and qRT-PCR. A.G.M. and D.H. performed native ChIP-seq. Chip-seq analysis performed by A.G.M., D.H. and D.V-G.. K.R. performed immunoblots, ESC differentiation, and ChIP. N.A.L performed mouse husbandry and skin isolations, and C.C. generated KO mice with the support of J.R.P. C.S. performed teratoma experiments with support of I.R.L. G.L., S.L., and B.A.G. performed and analyzed qMS data. J.R.P. provided mice for these studies. A.G.M., K.R. Z.Q., D.H. and E.B. designed experiments and interpreted results. E.B. wrote the manuscript with contributions from A.G.M. and J.R.P., with input from all other coauthors.
Competing financial interests: The authors declare no competing financial interests.
References
- 1.Pehrson J, Fried V. MacroH2A, a core histone containing a large nonhistone region. Science. 1992;257:1398–1400. doi: 10.1126/science.1529340. [DOI] [PubMed] [Google Scholar]
- 2.Costanzi C, Stein P, Worrad D, Schultz R, Pehrson J. Histone macroH2A1 is concentrated in the inactive X chromosome of female preimplantation mouse embryos. Development. 2000;127:2283–2289. doi: 10.1242/dev.127.11.2283. [DOI] [PubMed] [Google Scholar]
- 3.Costanzi C, Pehrson J. Histone macroH2A1 is concentrated in the inactive X chromosome of female mammals. Nature. 1998;393:599–601. doi: 10.1038/31275. [DOI] [PubMed] [Google Scholar]
- 4.Csankovszki G, Panning B, Bates B, Pehrson J, Jaenisch R. Conditional deletion of Xist disrupts histone macroH2A localization but not maintenance of X inactivation. Nature genetics. 1999;22:323–324. doi: 10.1038/11887. [DOI] [PubMed] [Google Scholar]
- 5.Hernandez-Munoz I, et al. Stable X chromosome inactivation involves the PRC1 Polycomb complex and requires histone MACROH2A1 and the CULLIN3/SPOP ubiquitin E3 ligase. Proc Natl Acad Sci U S A. 2005;102:7635–40. doi: 10.1073/pnas.0408918102. [DOI] [PMC free article] [PubMed] [Google Scholar]
- 6.Heard E, Disteche C. Dosage compensation in mammals: fine-tuning the expression of the X chromosome. Genes & development. 2006;20:1848–1867. doi: 10.1101/gad.1422906. [DOI] [PubMed] [Google Scholar]
- 7.Buschbeck M, et al. The histone variant macroH2A is an epigenetic regulator of key developmental genes. Nature structural & molecular biology. 2009;16:1074–1079. doi: 10.1038/nsmb.1665. [DOI] [PubMed] [Google Scholar]
- 8.Changolkar L, et al. Genome-wide distribution of macroH2A1 histone variants in mouse liver chromatin. Molecular and cellular biology. 2010;30:5473–5483. doi: 10.1128/MCB.00518-10. [DOI] [PMC free article] [PubMed] [Google Scholar]
- 9.Gamble M, Frizzell K, Yang C, Krishnakumar R, Kraus W. The histone variant macroH2A1 marks repressed autosomal chromatin, but protects a subset of its target genes from silencing. Genes & development. 2010;24:21–32. doi: 10.1101/gad.1876110. [DOI] [PMC free article] [PubMed] [Google Scholar]
- 10.Ratnakumar K, et al. ATRX-mediated chromatin association of histone variant macroH2A1 regulates α-globin expression. Genes & development. 2012;26:433–438. doi: 10.1101/gad.179416.111. [DOI] [PMC free article] [PubMed] [Google Scholar]
- 11.Costanzi C, Pehrson J. MACROH2A2, a new member of the MARCOH2A core histone family. The Journal of biological chemistry. 2001;276:21776–21784. doi: 10.1074/jbc.M010919200. [DOI] [PubMed] [Google Scholar]
- 12.Macarthur B, Ma'ayan A, Lemischka I. Systems biology of stem cell fate and cellular reprogramming. Nature reviews. Molecular cell biology. 2009;10:672–681. doi: 10.1038/nrm2766. [DOI] [PMC free article] [PubMed] [Google Scholar]
- 13.Lessard J, Crabtree G. Chromatin regulatory mechanisms in pluripotency. Annual review of cell and developmental biology. 2010;26:503–532. doi: 10.1146/annurev-cellbio-051809-102012. [DOI] [PMC free article] [PubMed] [Google Scholar]
- 14.Meshorer E, et al. Hyperdynamic plasticity of chromatin proteins in pluripotent embryonic stem cells. Developmental cell. 2006;10:105–116. doi: 10.1016/j.devcel.2005.10.017. [DOI] [PMC free article] [PubMed] [Google Scholar]
- 15.Ahmed K, et al. Global chromatin architecture reflects pluripotency and lineage commitment in the early mouse embryo. PloS one. 2010;5 doi: 10.1371/journal.pone.0010531. [DOI] [PMC free article] [PubMed] [Google Scholar]
- 16.Gaspar-Maia A, Alajem A, Meshorer E, Ramalho-Santos M. Open chromatin in pluripotency and reprogramming. Nature reviews. Molecular cell biology. 2011;12:36–47. doi: 10.1038/nrm3036. [DOI] [PMC free article] [PubMed] [Google Scholar]
- 17.Pehrson JR, Costanzi C, Dharia C. Developmental and tissue expression patterns of histone macroH2A1 subtypes. J Cell Biochem. 1997;65:107–13. doi: 10.1002/(sici)1097-4644(199704)65:1<107::aid-jcb11>3.0.co;2-h. [DOI] [PubMed] [Google Scholar]
- 18.Creppe C, et al. MacroH2A1 regulates the balance between self-renewal and differentiation commitment in embryonic and adult stem cells. Molecular and cellular biology. 2012;32:1442–1452. doi: 10.1128/MCB.06323-11. [DOI] [PMC free article] [PubMed] [Google Scholar]
- 19.Tanasijevic B, Rasmussen T. X chromosome inactivation and differentiation occur readily in ES cells doubly-deficient for macroH2A1 and macroH2A2. PloS one. 2011;6 doi: 10.1371/journal.pone.0021512. [DOI] [PMC free article] [PubMed] [Google Scholar]
- 20.Boulard M, et al. Histone variant macroH2A1 deletion in mice causes female-specific steatosis. Epigenetics & chromatin. 2010;3:8. doi: 10.1186/1756-8935-3-8. [DOI] [PMC free article] [PubMed] [Google Scholar]
- 21.Chang CC, et al. A maternal store of macroH2A is removed from pronuclei prior to onset of somatic macroH2A expression in preimplantation embryos. Developmental biology. 2005;278:367–380. doi: 10.1016/j.ydbio.2004.11.032. [DOI] [PubMed] [Google Scholar]
- 22.Chang C, Gao S, Sung L, Corry G. Rapid elimination of the histone variant MacroH2A from somatic cell heterochromatin after nuclear transfer. Cell Reprogramming. 2010 doi: 10.1089/cell.2009.0043. [DOI] [PMC free article] [PubMed] [Google Scholar]
- 23.Nashun B, Yukawa M, Liu H, Akiyama T, Aoki F. Changes in the nuclear deposition of histone H2A variants during pre-implantation development in mice. Development. 2010;137:3785–3794. doi: 10.1242/dev.051805. [DOI] [PubMed] [Google Scholar]
- 24.Pasque V, Gillich A, Garrett N, Gurdon J. Histone variant macroH2A confers resistance to nuclear reprogramming. The EMBO journal. 2011;30:2373–2387. doi: 10.1038/emboj.2011.144. [DOI] [PMC free article] [PubMed] [Google Scholar]
- 25.Takahashi K, Yamanaka S. Induction of pluripotent stem cells from mouse embryonic and adult fibroblast cultures by defined factors. Cell. 2006;126:663–676. doi: 10.1016/j.cell.2006.07.024. [DOI] [PubMed] [Google Scholar]
- 26.Hochedlinger K, Plath K. Epigenetic reprogramming and induced pluripotency. Development. 2009;136:509–523. doi: 10.1242/dev.020867. [DOI] [PMC free article] [PubMed] [Google Scholar]
- 27.Ang YS, Gaspar-Maia A, Lemischka I, Bernstein E. Stem cells and reprogramming: breaking the epigenetic barrier? Trends in pharmacological sciences. 2011;32:394–401. doi: 10.1016/j.tips.2011.03.002. [DOI] [PMC free article] [PubMed] [Google Scholar]
- 28.Niwa H, Miyazaki J, Smith A. Quantitative expression of Oct-3/4 defines differentiation, dedifferentiation or self-renewal of ES cells. Nature genetics. 2000;24:372–376. doi: 10.1038/74199. [DOI] [PubMed] [Google Scholar]
- 29.Plazas-Mayorca M, et al. One-pot shotgun quantitative mass spectrometry characterization of histones. Journal of proteome research. 2009;8:5367–5374. doi: 10.1021/pr900777e. [DOI] [PMC free article] [PubMed] [Google Scholar]
- 30.Somers A, et al. Generation of transgene-free lung disease-specific human induced pluripotent stem cells using a single excisable lentiviral stem cell cassette. Stem cells. 2010;28:1728–1740. doi: 10.1002/stem.495. [DOI] [PMC free article] [PubMed] [Google Scholar]
- 31.Changolkar L, et al. Developmental changes in histone macroH2A1-mediated gene regulation. Molecular and cellular biology. 2007;27:2758–2764. doi: 10.1128/MCB.02334-06. [DOI] [PMC free article] [PubMed] [Google Scholar]
- 32.Ruiz S, et al. A high proliferation rate is required for cell reprogramming and maintenance of human embryonic stem cell identity. Current biology : CB. 2011;21:45–52. doi: 10.1016/j.cub.2010.11.049. [DOI] [PMC free article] [PubMed] [Google Scholar]
- 33.Tsai SY, et al. Oct4 and klf4 reprogram dermal papilla cells into induced pluripotent stem cells. Stem cells. 2010;28:221–228. doi: 10.1002/stem.281. [DOI] [PubMed] [Google Scholar]
- 34.Karras G, et al. The macro domain is an ADP-ribose binding module. The EMBO journal. 2005;24:1911–1920. doi: 10.1038/sj.emboj.7600664. [DOI] [PMC free article] [PubMed] [Google Scholar]
- 35.Mansour A, et al. The H3K27 demethylase Utx regulates somatic and germ cell epigenetic reprogramming. Nature. 2012;488:409–413. doi: 10.1038/nature11272. [DOI] [PubMed] [Google Scholar]
- 36.Creyghton MP, et al. Histone H3K27ac separates active from poised enhancers and predicts developmental state. Proc Natl Acad Sci U S A. 2010;107:21931–6. doi: 10.1073/pnas.1016071107. [DOI] [PMC free article] [PubMed] [Google Scholar]
- 37.Sridharan R, et al. Role of the murine reprogramming factors in the induction of pluripotency. Cell. 2009;136:364–377. doi: 10.1016/j.cell.2009.01.001. [DOI] [PMC free article] [PubMed] [Google Scholar]
- 38.Marson A, et al. Connecting microRNA genes to the core transcriptional regulatory circuitry of embryonic stem cells. Cell. 2008;134:521–533. doi: 10.1016/j.cell.2008.07.020. [DOI] [PMC free article] [PubMed] [Google Scholar]
- 39.Maherali N, et al. Directly reprogrammed fibroblasts show global epigenetic remodeling and widespread tissue contribution. Cell stem cell. 2007;1:55–70. doi: 10.1016/j.stem.2007.05.014. [DOI] [PubMed] [Google Scholar]
- 40.Feldman N, et al. G9a-mediated irreversible epigenetic inactivation of Oct-3/4 during early embryogenesis. Nature cell biology. 2006;8:188–194. doi: 10.1038/ncb1353. [DOI] [PubMed] [Google Scholar]
- 41.Athanasiadou R, et al. Targeting of de novo DNA methylation throughout the Oct-4 gene regulatory region in differentiating embryonic stem cells. PloS one. 2010;5 doi: 10.1371/journal.pone.0009937. [DOI] [PMC free article] [PubMed] [Google Scholar]
- 42.Murry C, Keller G. Differentiation of embryonic stem cells to clinically relevant populations: lessons from embryonic development. Cell. 2008;132:661–680. doi: 10.1016/j.cell.2008.02.008. [DOI] [PubMed] [Google Scholar]
- 43.Onder T, Daley G. New lessons learned from disease modeling with induced pluripotent stem cells. Current opinion in genetics & development. 2012 doi: 10.1016/j.gde.2012.05.005. [DOI] [PMC free article] [PubMed] [Google Scholar]
- 44.Gaspar-Maia A, et al. Chd1 regulates open chromatin and pluripotency of embryonic stem cells. Nature. 2009;460:863–868. doi: 10.1038/nature08212. [DOI] [PMC free article] [PubMed] [Google Scholar]
- 45.Singhal N, et al. Chromatin-Remodeling Components of the BAF Complex Facilitate Reprogramming. Cell. 2010;141:943–955. doi: 10.1016/j.cell.2010.04.037. [DOI] [PubMed] [Google Scholar]
- 46.Ang YS, et al. Wdr5 mediates self-renewal and reprogramming via the embryonic stem cell core transcriptional network. Cell. 2011;145:183–197. doi: 10.1016/j.cell.2011.03.003. [DOI] [PMC free article] [PubMed] [Google Scholar]
- 47.Onder T, et al. Chromatin-modifying enzymes as modulators of reprogramming. Nature. 2012;483:598–602. doi: 10.1038/nature10953. [DOI] [PMC free article] [PubMed] [Google Scholar]
- 48.Liang G, He J, Zhang Y. Kdm2b promotes induced pluripotent stem cell generation by facilitating gene activation early in reprogramming. Nature cell biology. 2012;14:457–466. doi: 10.1038/ncb2483. [DOI] [PMC free article] [PubMed] [Google Scholar]
- 49.Shi Y, et al. A combined chemical and genetic approach for the generation of induced pluripotent stem cells. Cell Stem Cell. 2008;2:525–528. doi: 10.1016/j.stem.2008.05.011. [DOI] [PubMed] [Google Scholar]
- 50.Pasque V, et al. Histone variant macroH2A marks embryonic differentiation in vivo and acts as an epigenetic barrier to induced pluripotency. J Cell Sci. 2012 doi: 10.1242/jcs.113019. [DOI] [PMC free article] [PubMed] [Google Scholar]
- 51.Ng R, Gurdon J. Epigenetic memory of an active gene state depends on histone H3.3 incorporation into chromatin in the absence of transcription. Nature cell biology. 2008;10:102–109. doi: 10.1038/ncb1674. [DOI] [PubMed] [Google Scholar]
- 52.Sporn J, et al. Histone macroH2A isoforms predict the risk of lung cancer recurrence. Oncogene. 2009;28:3423–3428. doi: 10.1038/onc.2009.26. [DOI] [PubMed] [Google Scholar]
- 53.Kapoor A, et al. The histone variant macroH2A suppresses melanoma progression through regulation of CDK8. Nature. 2010;468:1105–1109. doi: 10.1038/nature09590. [DOI] [PMC free article] [PubMed] [Google Scholar]
- 54.Chicas A, et al. H3K4 demethylation by Jarid1a and Jarid1b contributes to retinoblastoma-mediated gene silencing during cellular senescence. Proc Natl Acad Sci U S A. 2012;109:8971–6. doi: 10.1073/pnas.1119836109. [DOI] [PMC free article] [PubMed] [Google Scholar]
- 55.Langmead B, Trapnell C, Pop M, Salzberg SL. Ultrafast and memory-efficient alignment of short DNA sequences to the human genome. Genome Biol. 2009;10:R25. doi: 10.1186/gb-2009-10-3-r25. [DOI] [PMC free article] [PubMed] [Google Scholar]
- 56.Zhang Y, et al. Model-based analysis of ChIP-Seq (MACS) Genome Biol. 2008;9:R137. doi: 10.1186/gb-2008-9-9-r137. [DOI] [PMC free article] [PubMed] [Google Scholar]
- 57.Liu T, et al. Cistrome: an integrative platform for transcriptional regulation studies. Genome Biol. 2011;12:R83. doi: 10.1186/gb-2011-12-8-r83. [DOI] [PMC free article] [PubMed] [Google Scholar]
- 58.Zang C, et al. A clustering approach for identification of enriched domains from histone modification ChIP-Seq data. Bioinformatics. 2009;25:1952–1958. doi: 10.1093/bioinformatics/btp340. [DOI] [PMC free article] [PubMed] [Google Scholar]
Associated Data
This section collects any data citations, data availability statements, or supplementary materials included in this article.