Abstract
MAVEN is an open-source software program for interactive processing of LC-MS-based metabolomics data. MAVEN enables rapid and reliable metabolite quantitation from multiple reaction monitoring data or high-resolution full-scan mass spectrometry data. It automatically detects and reports peak intensities for isotope-labeled metabolites. Menu-driven, click-based navigation allows visualization of raw and analyzed data. Here we provide a User Guide for MAVEN. Step-by-step instructions are provided for data import, peak alignment across samples, identification of metabolites that differ strongly between biological conditions, quantitation and visualization of isotope-labeling patterns, and export of tables of metabolite-specific peak intensities. Together, these instructions describe a workflow that allows efficient processing of raw LC-MS data into a form ready for biological analysis.
Keywords: metabolomics, liquid chromatography-mass spectrometry, pathway visualization and mapping, stable isotope labeling, metabolic flux analysis, kinetic flux profiling
INTRODUCTION
Metabolomics, systems-level metabolite analysis, is playing an increasing role in biological (Nicholson and Lindon, 2008; Palsson, 2009) and pharmaceutical research (Xu et al., 2009; Wei, 2011). One sensitive and specific method of measuring metabolites is liquid chromatography–mass spectrometry (LC-MS). Metabolites are separated chromatographically based on polarity and ionized, and the resulting ions are separated and quantitated by mass spectrometry. For quantitation of known metabolites, one effective approach is multiple reaction monitoring (MRM, or targeted MS/MS) on a triple-quadrupole instrument. An equally effective alternative involves high-resolution, high-mass-accuracy full-scan mass spectrometry (high resolution MS), e.g., on a time-of-flight, Fourier transform ion cyclotron resonance, or Orbitrap instrument. This latter approach has the important advantage of also allowing the discovery and quantitation of unexpected metabolites.
In analyzing the data arising from either of these approaches, there are common challenges. One is to correct for retention-time drift across samples, so that peaks reflecting the same metabolite can be reliably aligned and grouped together. Another is to detect and quantitate all high-quality peaks while discarding noise and interferences. Yet another, which is more important for full-scan data, is figuring out which peaks arise from isotope-labeled forms of other peaks, or from adducts or fragmentation events. Completion of these basic data processing steps results in a table where rows correspond to metabolites (or isotope-labeled forms thereof), columns are biological samples, and entries are peak intensities. The resulting data table is in principle ready for biological analysis.
In practice, however, incorrect annotation of some peaks is common, especially in experiments with the additional complication of isotope labeling. Often these annotation errors become evident during initial biological analyses. Thus, a preferred workflow involves moving back-and-forth between raw data processing and subsequent analyses. Examples of such subsequent analyses include identification of metabolites that differ significantly across biological conditions and display of metabolite intensities or labeling patterns on pathway maps.
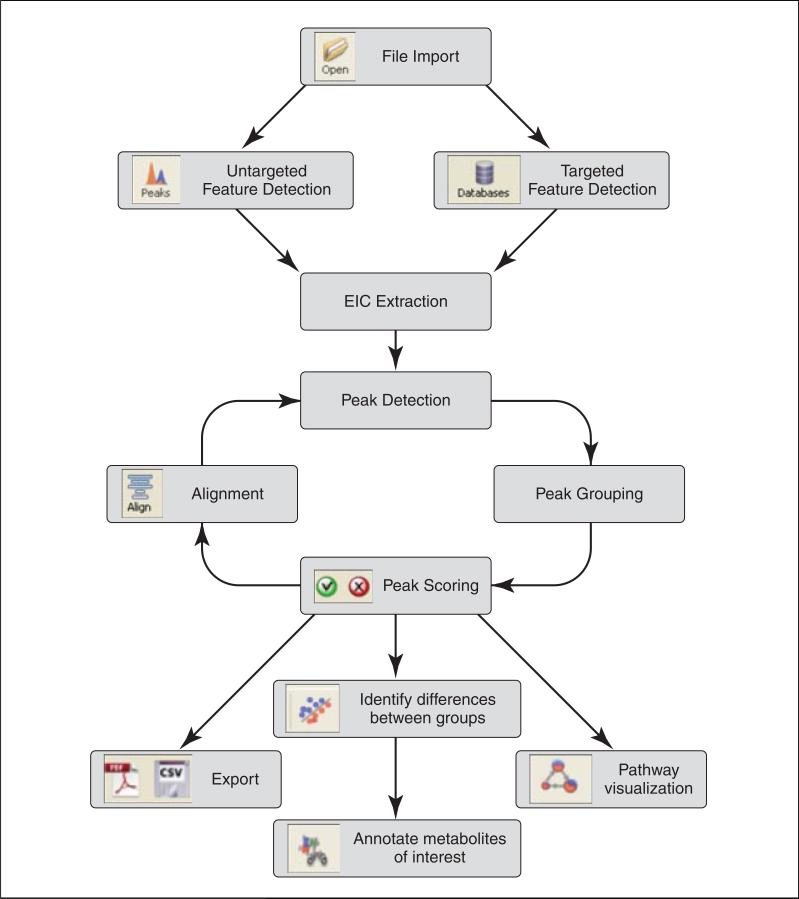
Academic and commercial software for such data processing tasks is available. A particularly important milestone in metabolomic software development was the open-source package XCMS (Smith et al., 2006). This software application, from the lab of Gary Siuzdak, implemented nonlinear retention time alignment, which in turn allowed reliable grouping of peaks and thereby identification of peaks that differ strongly across biological conditions. Building on XCMS, we have recently developed a software package MAVEN, with a similar workflow (Fig. 14.11.1) (Melamud et al., 2010). Advantages include faster processing speed, enhanced graphical displays, and automatic quantitation of isotope-labeled forms. Particularly important is the nearly instantaneous display of aligned extracted ion-chromatograms (EICs) from large numbers of samples simultaneously. Users can move from analysis to analysis with click-based navigation, allowing rapid transitions from raw data to biological interpretation, and back again to correct any annotation errors.
Figure 14.11.1.
MAVEN workflow. Multiple cycles of peak detection, grouping, quality scoring, and alignment may be performed prior to biological analyses such as pathway-based data visualization. The user can easily navigate back-and-forth from raw data analysis to biological analyses. Validated data tables can be readily exported to other software.
Here we provide a step-by-step user guide to MAVEN. The guide is broken into sections for (1) loading data into MAVEN, (2) peak alignment, (3) untargeted analysis of full-scan LC-MS data, (4) targeted metabolite quantitation, and (5) targeted analysis of full-scan LC-MS data with isotopic labeling. Uploading data and aligning peaks is a prerequisite to the subsequent analyses. Untargeted analysis is useful for identifying metabolites that differ between two or more sets of biological samples, for instance drug-treated versus control patient samples. Targeted metabolite quantitation is useful for building a comprehensive matrix of the quantitative response of known metabolites to a perturbation, with the resulting data often presented in a heat map as is commonly done for gene expression data. Analysis also of isotope labeling provides insight into metabolic pathway activities and is a prerequisite to quantitation of metabolic fluxes.
STRATEGIC PLANNING
Data conversion
MAVEN requires that LC-MS data be converted to the .mzXML file format prior to import. For most mass spectrometers, file converters are freely available and maintained through the Seattle Proteome Center–Institute for Systems Biology through their Trans-Proteomic Pipeline (Deutsch et al., 2010). For example, to convert .raw formatted files from Thermo Scientific Instruments to .mzXML format, the user would use the ReAdW.exe program with the following syntax:
ReAdW.exe --mzXML inflile.raw outfile.mzXML
Quantitation of known metabolites
To identify and quantify known metabolites, it is necessary to generate an LC method– specific file that contains the associated metabolite retention times. For MRM data, this file should also include the MRM scan parameters. MAVEN will use this file to retrieve peaks arising from the known compounds.
For full-scan LC-MS analysis, the basic format of the file is a spreadsheet where each row corresponds to one metabolite, and the columns are (A) compound name, (B) neutral molecular formula, (C) KEGG or HMDB ID, and (D) retention time in minutes. MAVEN will automatically calculate relevant exact ion masses from this information.
For MRM analysis, the columns are (A) polarity (±), (B) compound name, (C) category (i.e., “metabolite”), (D) precursor m/z (parent ion selected in Q1), (E) collision energy (in eV), (F) product m/z (daughter ion selected in Q3), and (G) expected retention time in minutes.
We include in the MAVEN download package two files of this sort, which can be used as templates. KNOWNS.csv provides exact masses and retention times for metabolomic analysis using the ultra-high-pressure, reversed-phase ion-pairing, negative-mode LCMS method described in Lu et al. (2010). SRM2.csv provides MRM parameters and retention times for metabolomic analysis using a similar LC method that runs at standard HPLC pressures, as described in Lu et al. (2008). The .csv files can be modified in most common spreadsheet programs such as Microsoft Excel or Open Office.
LOADING LC-MS DATA INTO MAVEN
This protocol covers the import of LC-MS data files to MAVEN, the first step in data processing. Prior to important, raw data should be converted to .mzXML as described in Strategic Planning, “Data Conversion,” above.
Necessary Resources
Hardware
Computer capable of running Microsoft Windows (XP, Vista, Windows 7), Mac OS X, or Linux (Ubuntu 10.× 64bit)
Software
MAVEN package, open-source, available for download through http://maven.princeton.edu
Files
LC/MS data files converted to .mzXML format
Sample data sets accessed through the Web link above, including “MC89 Mutant vs. Wildtype Yeast” and “KFP 20min Time Course C13 glucose”
Set parameters for filing loading
Click on the Options wrench and screwdriver icon along the top toolbar. With the Instrumentation tab selected, ensure Polarity/Ionization Mode is set to Auto Detect. If processing triple quadrupole (QQQ) data, set the Q1 and Q3 mass accuracy in amu (typically 0.5 to 1 amu).
Toggle to the File Import tab. Here the analyst has options to decrease file size during import either by centroiding the data or by eliminating data points that do not meet certain intensity criteria. For previously centroided data, leave the Centroid Scans box unchecked, and set Scan Filter Intensity Min Quantile Cutoff and Scan Filter: Minimum Intensity both to 0. Close the Options tab by clicking on the red X in the upper right-hand corner.
Load data
-
3
Click on the yellow Open file icon in the upper left corner. Navigate to the desired .mzXML files, and highlight all those intended for analysis including Blank and Quality Control samples. Click “Open.” The loading progress is displayed in the lower right hand corner.
-
4
If not already displayed, click the Show Samples widget along the right toolbar. It is also accessible by F2. A new Samples window will appear on the left-hand side, displaying all loaded samples. If the window is not immediately visible, unhide it by clicking on the Samples tab along the left-hand side of the MAVEN window.
-
5
Ensure there is a check mark displayed to the left of each sample name. Clicking to remove the check mark will remove the sample from both visual data displays and data processing.
-
6
MAVEN automatically assigns a color to each sample. These colors are used in visual displays such as extracted ion chromatograms (EICs) and bar charts. Colors may be re-assigned by double clicking on the color bar in the Samples tab, selecting a new color, and clicking OK.
-
7
The order in which samples are displayed will also be consistent throughout the analysis. Samples may be re-ordered by left-clicking and dragging the sample up or down within the Samples tab.
PEAK ALIGNMENT AND VISUALIZATION
This protocol covers peak detection, grouping across samples, nonlinear retention time alignment, and manual assessment of alignment. It also includes instructions for navigating the extracted ion chromatogram (EIC) window used for raw data visualization.
Necessary Resources
Hardware
Computer capable of running Microsoft Windows (XP, Vista, Windows 7), Mac OS X, or Linux (Ubuntu 10.× 64bit)
Software
MAVEN package, open-source, available for download through http://maven.princeton.edu
Files
LC-full-scan or QQQ MS data files converted to .mzXML, and loaded as in Basic Protocol 1
Select peaks to be used in the alignment process
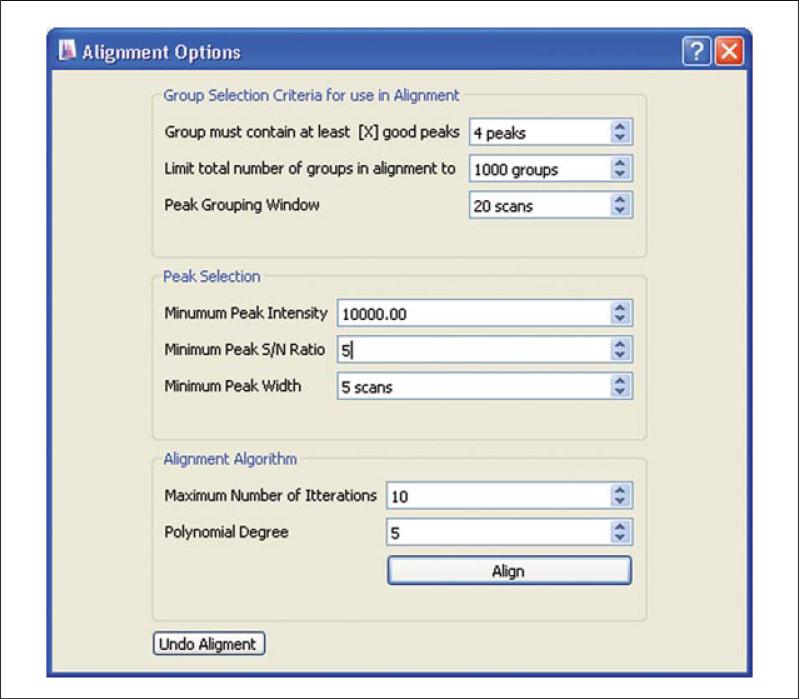
To begin the alignment process, left click the Align icon along the top toolbar. The Alignment Options box will display in a new window (Fig. 14.11.2). The alignment algorithm works by aligning high-quality peak groups. The term “peak group” or “group” is used in MAVEN to refer to the set of LC-MS peaks across multiple samples arising from the same metabolite ion. The entries in the Alignment Options window control the characteristics of peaks and peak groups used for alignment. The parameters entered in this window will only affect chromatographic alignment, not the number of EICs identified in subsequent processing.
Fill in the user settings under Group Selection Criteria for use in Alignment. There are three values here. The first, Groups must contain at least [X] good peaks refers to the number of samples in which a given peak must be found, for the associated peak group to be used during alignment. Select a value less than or equal to the number of samples. The second, Limit Total Number of Groups in Alignment to, controls the maximum number of groups used during alignment. Too high a number can result in slow alignment, with 1000 as an appropriate number. The third, Peak Grouping Window, is the most important, because it controls the chromatographic deviation that is allowed across runs. This window should be maintained as small as possible while still capturing all peaks within a group. For a typical UPLC system coupled to a MS scanning at 1 Hz, 20 scans are adequate. Larger windows are required if chromatographic reproducibility is poor.
Fill in the user settings under Peak Selection. These are self-explanatory metrics that relate to peak quality. As lower-quality peaks will still be detected and quantitated later (even if excluded here), err on the side of high-quality standards. Typical values for a Thermo Exactive instrument are provided in Figure 14.11.2. The minimum peak intensity metric, but not the other two values, is strongly instrument dependent.
Fill in user settings under Alignment Algorithm. MAVEN will iteratively fit a nonlinear model to chromatographically align the data. To avoid over-fitting, suggested starting conditions are less than 10 iterations with a polynomial degree of 3 to 5.
Click Align. MAVEN will extract ions, detect and group peaks, and align groups. The toolbar in the lower right corner indicates progress.
Figure 14.11.2.
Chromatographic alignment of data is accomplished within MAVEN by selecting high-intensity peaks, grouping across samples, then iteratively fitting a nonlinear retention time model.
Manually assess quality of alignment
-
6
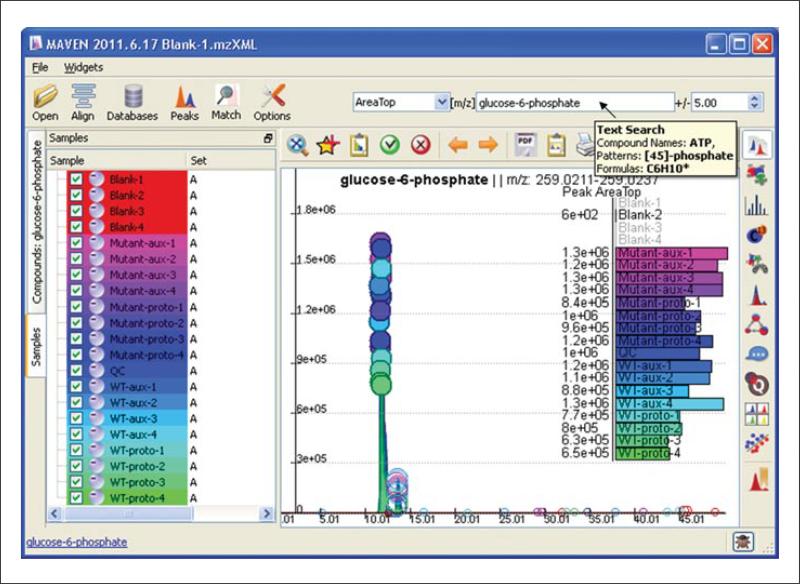
To assess quality of alignment, manually inspect EICs of some common metabolites. Locate the Text Search box in the upper right-hand corner (the second of the three white boxes, see Fig. 14.11.3). Start typing the name of a compound of interest in the box. A drop-down list of compounds will appear. From the list, select the compound of interest. If the name of the compound of interest is not in the database, enter the m/z value of compound directly into the search box. Once a compound or m/z is specified, MAVEN extracts the corresponding m/z plus or minus the ppm error specified in the rightmost box.
-
7
If no peak is immediately visible in the large EIC window, zoom out by clicking on the magnifying glass in the toolbar just above the EIC window. This will adjust the scale of the x axis to encompass the entire length of the chromatographic run. To zoom in on a retention time (RT), drag a box across the RT of interest. Dragging the mouse from left to right will zoom in on the selected area; dragging the mouse from right to left will zoom out chromatogram.
-
8
Locate the ppm (parts per million) box adjacent to the Text Search box in the upper right corner. The value defined should reflect the mass accuracy of the instrument. If no peak is visible in the EIC window, increase the ppm window. If an abundance of background signal is present, decrease the ppm window. The ppm window should be maintained as narrow as possible. An excessively large window increases the risk of compound mis-identification.
-
9
Note that there is a circle at the top of each EIC. The size of the circle represents an auto-generated quality score, with larger circles denoting higher quality.
-
10
Also note the bar graph in the EIC window. By default, the graph represents the peak intensity metric Area top, which is the average intensity of top three points of the peak. In our experience, this is a more robust metric of peak intensity than either height or peak area above baseline. The bar graph can be changed to show different data using the pull-down menu to the left of the Text Search box. Other options include peak height, peak area above baseline, peak quality, and retention time.
-
11
Repeat steps 6 to 10 with a few additional compounds. If misalignment of peaks is visible, reset the Alignment Criteria and repeat the alignment process. Parameters of particular interest are the Peak Grouping Window and Minimum Peak Intensity, which should be adjusted to include only consistently observed, high-intensity peaks.
-
12
Go to File, Save Project to save your workspace as a .mzroll file. The workspace may be reloaded in a later MAVEN session. To reopen the workspace at any time, launch MAVEN and load the appropriate .mzroll file from the File Load dialog (Ctrl+O).
Figure 14.11.3.
Basic MAVEN interface, where loaded samples are displayed in the samples tab, and glucose 6-phosphate and its isomers have been extracted with a 7.5-ppm window.
UNTARGETED ANALYSIS OF FULL-SCAN LC-MS DATA
This protocol is designed for analysis of LC-MS data when chromatographic retention times of known compounds have not been determined, or when looking primarily for novel or unanticipated compounds. The protocol generates a comprehensive list of LCMS peak groups and their intensities across samples. This comprehensive data matrix can be subjected to two-way comparisons (e.g., between Condition A and Condition B) in MAVEN to identify peaks that differ across the two conditions. Click-based navigation leads directly from such analyses to associated raw EICs and mass spectra. Database search tools to generate hypotheses regarding the associated peak identities are also provided. Alternatively, data may be exported for more intensive statistical analysis.
Necessary Resources
Hardware
Computer capable of running Microsoft Windows (XP, Vista, Windows 7), Mac OS X, or Linux (Ubuntu 10.× 64bit)
Software
MAVEN package, open-source, available for download through http://maven.princeton.edu
Microsoft Excel or equivalent program capable of reading .csv files
Files
LC-full-scan or QQQ MS data files converted to .mzXML, and loaded and aligned as in Basic Protocols 1 and 2
Peak detection
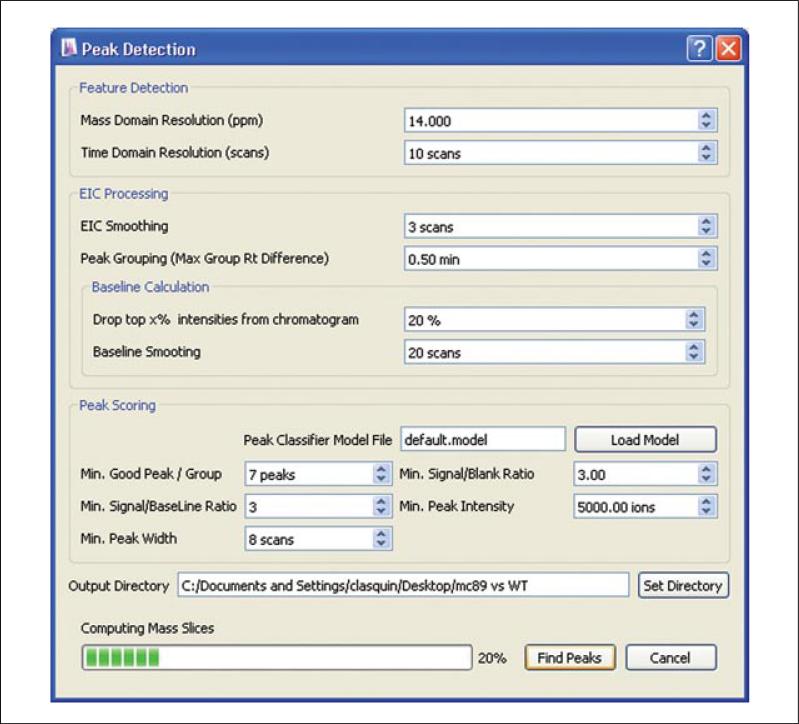
To detect mass spectral features (in substantially greater numbers than those used during Peak Alignment), select the Peaks/Feature Detection icon along the top toolbar. The Peak Detection window will appear (Fig. 14.11.4). MAVEN's peak-detection algorithm finds all ions that are observed in consecutive MS scans. Identical peaks are grouped across samples and their quality scored by a machine-learning algorithm. Entries in the Peak Detection window control the parameters used in these steps.
Fill in the user settings under Feature Detection. The Mass Domain Resolution setting should be set based on the inter-scan precision of the instrument. The entry is in ppm. A typical setting is 106 × Δm/m, where m/Δm is the mass resolving power. For example, a setting of 10 ppm would be appropriate for an Orbitrap instrument with 100,000 resolving power. As mass accuracy is superior to mass resolving power for many mass spectrometers, a somewhat lower value, but always greater than the instrument's mass accuracy, can be used. The Time Domain Resolution (scans) should be approximately equal to the average number of MS scans across a chromatographic peak.
Fill in the user settings under EIC Processing. Extracted ion chromatograms (EICs) from each individual sample are Gaussian smoothed; the parameter EIC smoothing determines the extent of this smoothing, with larger values resulting in more smoothing. For a typical Gaussian chromatographic peak shape, an EIC smoothing value of 3 is recommended. The Peak Grouping (Max Group RT Difference) determines the spread of retention times that are permitted in peaks that are grouped together across samples. This setting should be chosen based on chromatographic sharpness and reproducibility. Smaller windows are appropriate for sharper and more reproducible chromatography.
Fill in the user settings under Baseline Calculation. It is necessary to determine a baseline of each EIC, for both signal-to-noise and peak area calculations. To find the baseline, MAVEN first eliminates data points arising from genuine signal, using the simplifying heuristic of eliminating the highest x% of data points. The value of x is entered in the Drop top x% intensities from chromatogram box. A value of 20% is recommended. Once the high-intensity points are dropped, the remaining data are Gaussian smoothed. The parameter Baseline smoothing determines the extent of this smoothing, with larger values resulting in more smoothing. An appropriate value is the width of a typical peak, e.g., for our chromatography methods, 10 to 20 scans at 1 Hz. MAVEN defines the EIC baseline as the median of the Gaussian smoothed intensities.
Fill in user settings under Peak Scoring. Each peak is assigned a quantitative quality metric (“score”) by a machine-learning algorithm embedded in MAVEN. This score reflects the probability that the peak provides a quantifiable signal from a genuine analyte. The peak scoring algorithm can be retrained by the user, as described in Basic Protocol 4. The parameters entered in Peak Scoring provide the user with a convenient way, without retraining the model, to set expectations for peak prevalence across samples and for minimum intensities and widths of high-quality peaks. If no model has previously been trained, load default.model from the Program files → Maven folder. Enter the Min. Good Peaks/Group (minimum number of samples in the group that must contain a good peak at this m/z and retention time). This number must be less than or equal to the number of LC-MS runs being analyzed, and generally should be less than or equal to the number of replicates of a given biological condition, to avoid failing to identify peaks that appear in one biological condition but not another (such peaks may be particularly biologically interesting). The Min. Signal/Baseline Ratio is similar to signal-to-noise, with the baseline (as calculated above) used as a noise estimate. Recommended values range from 3 to 5. If Blanks were loaded, a Min. Signal/Blank Ratio may also be specified, similarly to Min. Signal/Baseline Ratio. This is valuable for eliminating peaks that also appear in the blanks. For Min. Peak Width, enter number of measurements required to integrate across a peak, typically at least five. For Min. Peak Intensity, enter a value below which peaks are reliably not quantifiable; too high a value will risk losing potentially valuable data.
Specify the output directory for the resulting .csv spreadsheet file. If directory is not specified, computational results will be displayed in a new window, and can be saved to the disk at a later time.
Click Find Peaks. MAVEN will write a results file to the specified directory named allslices.csv, with peak groups as rows, samples as columns, and peak intensities as entries. In addition, the file contains columns for the number of good peaks identified across all samples (goodPeakCount), median m/z, median RT, and probability that the peak is high quality (ranging from 0 to 1). The output file allows further data analysis outside of MAVEN.
Figure 14.11.4.
Peak Detection box in MAVEN and associated user settings.
Manual data inspection
-
8
When processing is complete, a new window will appear along the bottom of the screen displaying abbreviated results, with peak groups as rows and m/z, retention time, quality score, etc., as columns. A new Detected Features icon will also appear at the bottom of the right toolbar. Click on the icon to hide or unhide the table. The peak table may be sorted by quality, intensity, S/N, etc., by clicking on the corresponding column.
-
9
Highlight rows to visually inspect different peak groups.
-
10
At any point in the analysis, peak groups may be “bookmarked.” A list of bookmarked peak groups is easily exported as raw data in a .csv format. In addition, the associated EIC graphs can be exported (exactly as they appear in the EIC window) as a .pdf. Features may be bookmarked in a number of ways. With the group selected in the EIC window, you may either (1) click on the yellow star icon next to the magnifying glass, or (2) click on the green check mark (Ctrl + G) to mark the peak as good or the red X (or Ctrl + B) to mark the peak as bad. A peak group can also be bookmarked from within the table by right-clicking on any group and marking as good or bad. Bookmarked peaks are listed in a new table along with a green check mark or red X if designated. These bookmarked peak groups may also be used for subsequent analyses, including generating a scatter plot or training a new model for peak quality scoring.
Identifying peaks that differ across biological conditions
-
11
With the Samples tab selected along the left of the screen, look for the Set column. Note that all samples initially default to Set A. Differentiate the sets by double clicking in the Set column and entering a text label for each set. If signals should be normalized by a scaling factor (e.g., dilution factor, mass of tissue extracted, volume of cells extracted, etc.), change the linear scaling factor accordingly. The observed mass spectrometry signal will be multiplied by the entered scaling factor. For example, if protein concentration is 2 for one sample and 1 for another, enter 0.5 as the scaling factor for the first sample. After scaling factors are entered, peak detection must be repeated before the factor will be applied to the EIC table and corresponding scatter plot.
-
12
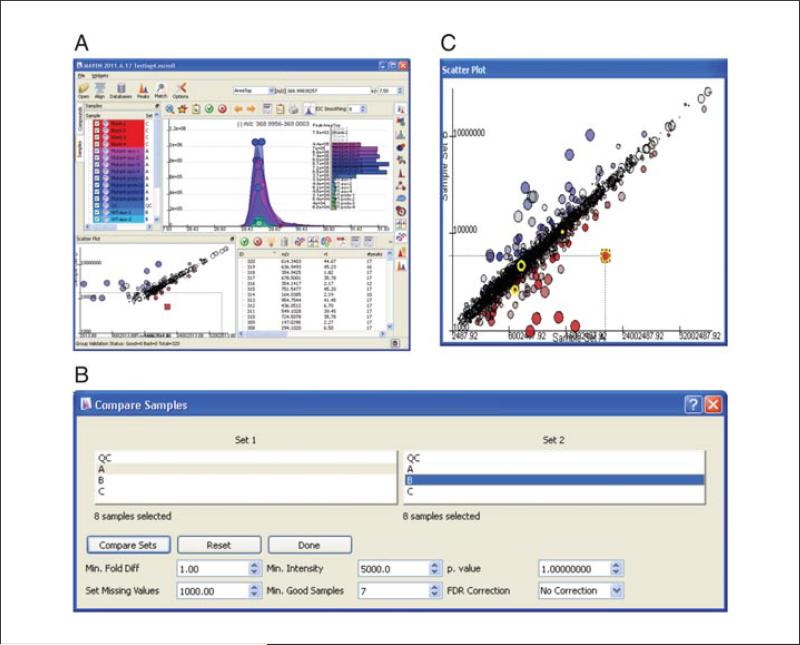
Select the Show Scatter Plot icon in the toolbar above the EIC table. A new window appears displaying options for comparing the two Sets that have been specified in the Samples tab. Highlight the two sets for comparison in the Set 1 and Set 2 boxes.
-
13
Generate a scatter plot with all data to check for systematic errors (e.g., one set has consistently higher intensities than the other). Each point on the scatter plot will represent the mean AreaTop of a peak group for Set A versus Set B. To view all data, set the Minimum Fold Difference to 1.00, leave p. value cutoff at 1.0, and leave No Correction in the FDR correction window. For missing peaks, where intensity was previously recorded as zero, replace the zero value with the lower limit of detection to prevent overestimation of fold differences. For an Orbitrap instrument, a typical lower limit of detection is 1000. Also specify a Min. Intensity cut-off. Only peak groups where the median peak exceeds this intensity will be displayed. This cut-off may be set somewhat higher than the Min. Peak Intensity used during peak detection, to focus on peaks that are of substantial intensity in at least one biological condition. The Min. Good Samples should be less than or equal to the number of LC-MS files in the smaller sample set.
-
14
Click Compare Sets. A scatter plot will appear in a new window. To view the plot in a larger window, either click and drag from the Scatter Plot label above the graph or click the pop-out icon in the upper right corner of the Scatter Plot window (once the box has been popped out, as in Figure 14.11.5C, the icon disappears). Once unnested, the scatter plot can be expanded. The data are displayed on a log10 scale. If the sample sets being compared are similar, most data will fall on the diagonal (line of unity). The size of each circle represents the fold change between the two sets.
-
15
Single click on a peak in the scatter plot to display the corresponding EICs. Note that when a peak is selected, other data points, reflecting co-eluting peaks, are highlighted in yellow. These peaks are potential adducts, fragments, or isotopic variants.
-
16
Display only peaks that differ significantly between Sets A and B by adding a Minimum Fold Difference and p. value (significance level) cut-off. The p. value can be corrected for multiple comparison testing by making a selection from the FDR Correction box. Options include applying Bonferroni, Holm-Bonferroni, or Benjamini-Hochberg methods. Click Compare Sets to generate another plot.
-
17
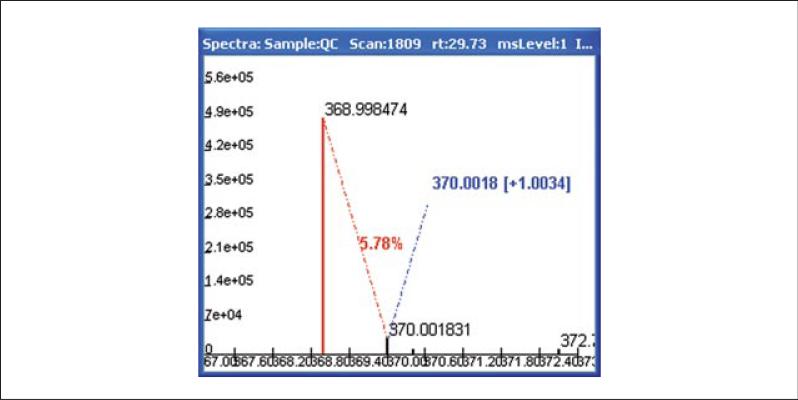
To investigate the mass spectra of features of interest, with the peaks displayed in the EIC window, click on the Show Spectra widget. A new box displaying the spectrum will appear (Fig. 14.11.6). Similarly to the scatter plot, the box may be dragged apart from the other windows and expanded. The sample for which the spectrum is displayed is identified across the top of the window.
-
18
Double click on the base ion of interest. It will be highlighted in red. Move the cursor to the M+1 or 13C peak. MAVEN calculates the Δm/z between the two peaks, and the relative abundance of the M+1 peak. Accuracy of the measured mass should be determined by comparing the observed Δm to the theoretical Δm between 12C and 13C of 1.003355. Similarly investigate the rest of the isotopic signature for clues of its identity, and for adducts and fragments.
-
19
Rescaling the window is possible by right clicking in the spectrum window. In this way, the spectrum may also be exported to the clipboard for further analysis or alternative displays.
Figure 14.11.5.
Generating a scatter plot to compare groups. (A) Rename Set name in Samples tab to reflect sample groupings. (B) Adjust parameters for pair-wise comparison of grouped data. (C) View results as scatter plot, where the size of each circle represents the fold change between the two samples sets.
Figure 14.11.6.
Sample spectrum displaying isotopic pattern associated with highlighted peak of interest from Figure 14.11.5C. Δm/z between 12C and 13C peaks is close to the expected value of 1.003355. The intensity of the 13C peak is displayed (5.78%).
Formula identification and database search
-
20
Exact ion masses may be used to calculate elemental composition or matched to databases. Click on the Show Match Compound widget, and a Compound Search box appears. Then click on an EIC of interest. The list is populated with compounds in KEGG matching the exact mass of the EIC within the error specified within the Compound Search window. Search results from KEGG are refreshed by re-clicking in the EIC window. To compute elemental composition directly, within the Compound Search window, place the cursor in the text box containing the exact mass and hit Enter.
TARGETED METABOLITE QUANTITATION
This protocol is intended to identify and quantify known metabolites for which retention times have been documented. It may be applied to either LC -triple quadrupole (QQQ) or LC-full-scan MS data. This method extracts peak groups with m/z and chromatographic retention times matching those specified in the Compound List, generating a table where each line corresponds to one known metabolite. The analyst may interactively toggle between EICs and the metabolite (peak group) list, assessing quality and correcting annotations. Filtered data are then easily exported for further analysis.
In addition to providing the basic workflow for targeted metabolite quantitation, this protocol also includes, as optional steps, instructions for retraining the neural network model within MAVEN that automatically assesses peak quality.
Necessary Resources
Hardware
Computer capable of running Microsoft Windows (XP, Vista, Windows 7), Mac OS X, or Linux (Ubuntu 10.× 64bit)
Software
MAVEN package, open-source, available for download through http://maven.princeton.edu
Microsoft Excel or equivalent program capable of reading .csv files
Files
LC-full-scan or QQQ MS data files converted to .mzXML, and loaded and aligned as in Basic Protocols 1 and 2
Compound list as described in Strategic Planning: Quantitation of Known Metabolites, or sample files distributed with the MAVEN package. These include KNOWNS.csv (Lu et al., 2010) for LC-full-scan MS data and SRM2.csv (Lu et al., 2008) for LC-QQQ MS data.
Targeted peak detection and extraction from a compound list
If data were acquired using an LC-MS method other than that described in Lu et al. (2008) or Lu et al. (2010), load the new compound list that was generated (see Strategic Planning). Along the top toolbar, select File, Load, Compound List. Select the method-specific .csv file, and click Open.
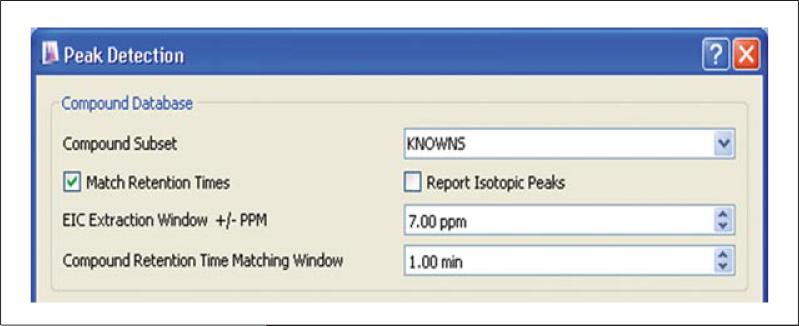
Extract peak groups matching the metabolites specified in the compound list by clicking on the Databases/Database Search icon along the top toolbar. A new window appears displaying Peak Detection parameters. The user-defined settings displayed are identical to those depicted in Figure 14.11.4 for untargeted feature detection, but with the addition of the Compound Database component (Fig. 14.11.7).
Fill in the user settings under Compound Database. Specify the Compound Subset intended for extraction by selecting the source file loaded in step 1 from the pull-down menu. Check the box to Match Retention Times of the raw data with those specified in the compound list. Leave the Report Isotopic Peaks box unchecked. For full-scan data only, alternatively one may choose to identify LC-MS peaks that potentially correspond, based on exact mass alone, to compounds from a metabolite database. In this instance, select the KEGG or MetaCyc as the Compound Subset, and leave the Match Retention Times box unchecked.
Specify the allowable deviation from both the m/z and retention times specified on the compound list using the EIC Extraction window ± PPM and Compound Retention Time Matching Window, respectively. Peak groups that fall within plus or minus the windows specified for both m/z and RT will be annotated in the peak group EIC table. Set the EIC Extraction window in ppm according to the mass accuracy and resolving power of the mass spectrometer. Set the Retention Time window in minutes to reflect the inter-day chromatographic reproducibility of the LC method.
Complete EIC Processing, Baseline Calculation, and Peak Scoring as outlined in Basic Protocol 3, steps 2 to 7.
Click Find Peaks. If an output directory was specified, a compounds.csv file will be written summarizing all groups identified, with compounds listed as rows, samples as columns, and AreaTop integration populating the table. The type of quantitation can be changed to Peak Area or Peak Intensity in the drop-down menu in the main toolbar.
Figure 14.11.7.
Known metabolite quantitation from a preloaded compound list. The remainder of the detection parameters are depicted in Figure 14.11.4, and described in Basic Protocol 3, steps 2 to 7.
Score peaks and verify annotations
-
7
A new window will appear in MAVEN listing all compounds identified, along with peak group retention time, m/z, number of “good” peaks detected in the group, maximum width, maximum intensity, etc. Scroll through the table and note that in some cases multiple peak groups have been assigned to a single compound. These groups vary in their degree of mass accuracy and RT deviation (within the window specified) from those in the compound list. Selection of the correct peak must be performed manually, and is rapid with MAVEN's visualization tool.
-
8
Sort the table alphabetically by compound name by clicking on the ID column header.
-
9
Highlight any line in the table to view the corresponding overlayed EICs. The vertical dashed red line indicates the expected retention time. The program will automatically focus the EIC on the expected retention time if the Auto Zoom button is checked.
-
10
Mark the peak groups as good or bad, to avoid conducting subsequent analysis on peak groups of low quality. To annotate a peak group as good, click on the green check mark (Ctrl + G); for bad, click on the red X (or Ctrl + B) (Fig. 14.11.8). Once a peak is scored good or bad, you will automatically drop down to the next line of the table, and its corresponding overlayed EICs will be displayed. Continue through the list, marking each peak group as good or bad. To delete a group, either click on the trash-can icon or press Delete. To change an annotation, re-highlight the row of the table and re-designate as good or bad.
-
11
After scoring all peaks, save the scored list for use in future MAVEN sessions by clicking on the XML icon above the compound table. The peak list will be in .mzPeaks format. This scored list will be accessible in the future by clicking on the open file folder in the main toolbar or by clicking File → Load Samples|Projects|Peaks(Ctrl + O).
-
12
For manipulation in Microsoft Excel, generate a new compound list containing good or bad quality designation by clicking the left-most CSV icon named Export Groups to Spreadsheet (.csv). The file differs from the compounds.csv described above in that column A, named “label”, will contain a g or b based on manual scoring of data. Sort the file in Excel by column A, and remove all “bad” data before proceeding with further data analysis.
Figure 14.11.8.
Rapid manual peak group acceptance or rejection (categorization as “good” or “bad”) within a list of peak groups corresponding to known metabolite m/z. The EICs displayed correspond to the highlighted row in the compound list. Clicking the green check mark or red X within the EIC window will designate the peak group as good or bad. For color version of this figure see http://www.currentprotocols.com/protocol/bi1411.
Optional: training a new model of peak quality scoring
-
13
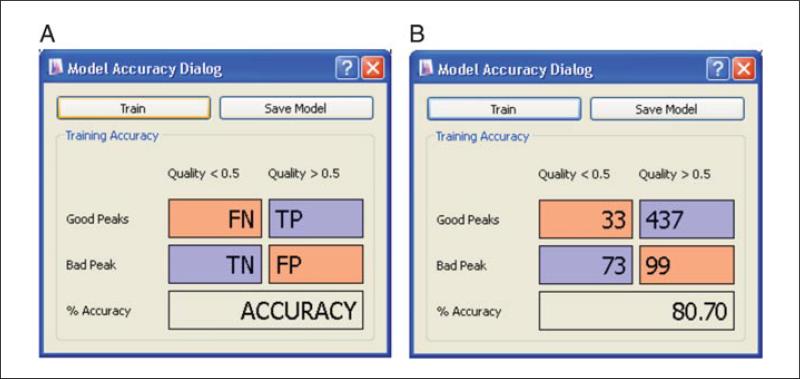
The default model of peak scoring was trained by experts in LC-MS-based metabolomics using the LC-MS methods Lu et al. (2010). This training is based on peak shape and intensity, and does not account for known retention times. For substantially different LC-MS methods, or different analytical objectives, retraining the model may improve the performance of MAVEN. If the analyst wishes to train a new model, this requires first categorizing at least 100 LC-MS peak groups as good or bad. Then, click on the light bulb icon (Train Neural Net) in the toolbar above the compound table. A Model Accuracy dialog box will appear (Fig. 14.11.9). Click train. Once a new model has been trained, numbers will appear in the red and blue boxes representing the number of true positive, true negative, false positive, and false negative predictions compared to analyst-designated good and bad peak group classifications. By scoring more peak groups as g/b, and reclicking train, the model may be improved. Once sufficient accuracy has been reached, click Save to overwrite the default model, and rerun Peak Detection.
Figure 14.11.9.
Retraining MAVEN's neural network model for peak quality scoring. Prior to re-training, it is necessary to manually designate at least 100 peak groups as “good” or “bad.” (A) Window as it appears before training. The neural network algorithm assigns a probability of being “good” to each peak group. False negatives (FN) are peak groups that the user designated as “good” that receive a probability <0.5; true positives (TP) are designated good peak groups and that receive a probability >0.5; true negatives (TN) are designated bad peak groups and receive a probability <0.5; and false positives (FP) are designated bad peak groups that receive a probability >0.5. (B) Training accuracy is reflected in the FN, TP, TN, FP, and % accuracy scores.
TARGETED ANALYSIS OF FULL-SCAN LC-MS DATA WITH ISOTOPIC LABELING
This protocol is designed for analysis of LC-MS data when stable isotopic labels have been incorporated. A comprehensive EIC table listing all relevant unlabeled parent peak groups along with their isotopically labeled forms is generated. The protocol includes instructions for selecting parameters to optimally identify and match isotopes with the unlabeled parent forms. The resulting annotated data may be visualized within MAVEN on a metabolic pathway map or exported for further analysis.
Necessary Resources
Hardware
Computer capable of running Microsoft Windows (XP, Vista, Windows 7), Mac OS X, or Linux (Ubuntu 10.× 64bit)
Software
MAVEN package, open-source, available for download through http://maven.princeton.edu
Microsoft Excel or equivalent program capable of reading .csv files
Files
LC-full-scan or QQQ MS data files converted to .mzXML, and loaded and aligned as in Basic Protocols 1 and 2
Compound list as described in Strategic Planning: Quantitation of Known Metabolites
Parameters for identifying isotopes, and properly matching unlabeled with labeled forms, are provided in the Options window. Click on the Options icon along the top toolbar. In the Options window, select the Isotope Detection tab.
Check the boxes along the left-hand side of the window to indicate the label incorporated (2H, 13C, 15N, or 34S). For Isotope is within [X] scans of parent and Minimum Isotope-parent correlation, both metrics should be set based on the expected chromatographic co-occurrence of light (unlabeled) and heavy (labeled) forms of the same metabolite. For 13C, 15N, or 34S labeling, substantial isotope effects on peak shape and retention time are not expected, and these values are based mainly on chromatographic sharpness and reproducibility. For 2H (deuterium) labeling, isotope effects can be substantial and larger windows may be required. For Minimum Isotope-parent correlation, a reasonable starting selection for 13C, 15N, and 34S labeling is 0.50, but the parameter may be adjusted and results updated in real-time once feature extraction is complete. For Isotope is within [X] scans of parent, which acts as a cut-off on the retention time difference that is acceptable for the peak apices, 10 scans at 1 Hz is a reasonable starting selection. Maximum % Error to Natural Abundance is used to guide selection of naturally occurring isotopic forms in experiments where label is not added. When label is added, this value should be set to 100%. After making these selections, close the Options window.
Targeted peak detection
-
3
Detect Peaks as specified in Basic Protocol 4, steps 1 to 6, but with the Report Isotopic Peaks box checked. By clicking Find Peaks, MAVEN will detect isotopic peaks and match them with the associated unlabeled parent ions.
Score peaks and verify annotations
-
4
A new box will appear, listing all of the identified unlabeled parent ions (Fig. 14.11.10). Click the “expand” icon (plus sign) next to the compound name to view each individually labeled form. Scroll through each labeled form, verifying that its retention time does not shift, that its peak shape is similar to that of the parent, and that noise does not impede quantitation.
-
5
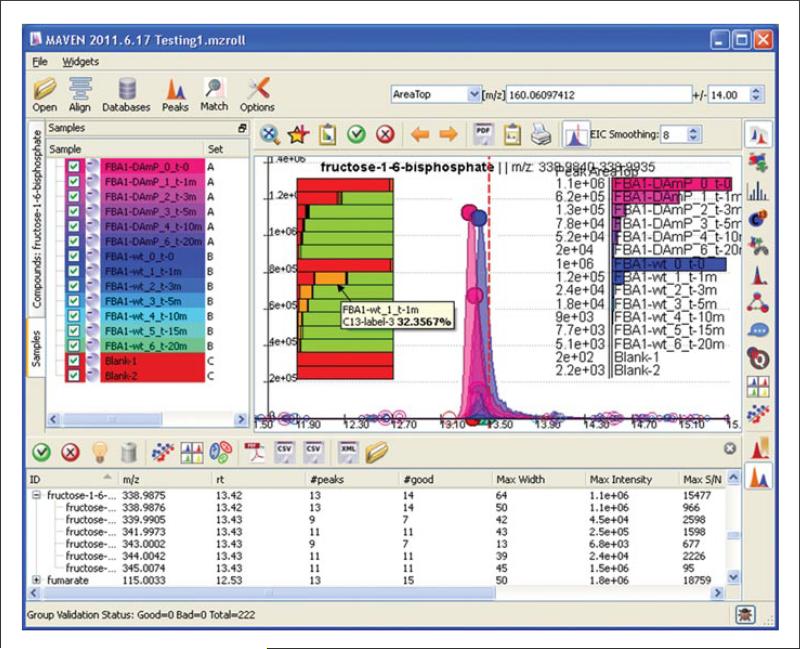
A graphical representation of the extent of isotope labeling is provided upon clicking on the EIC of the parent. The color of the parent, or unlabeled form, is red. Colors of heavier isotopic forms are automatically assigned. To determine which labeled form is represented by a given color, mouse over the color on the bar chart. A text box will appear specifying the sample name, the labeled form represented (e.g., C13-label-3 for 13C3), and the percent abundance of that form.
-
6
In the case that a labeled form is mis-assigned, or quantitation is impeded by noise, delete the form from the bar chart. Click on the representative color in the isotope bar chart to highlight the labeled form. Press the “delete” button. This will delete that labeled form across all samples, and recalculate the fractional abundance of other forms accordingly.
-
7
Categorize the peak groups in the table as good or bad as outlined in Basic Protocol 4, step 10. The data are now ready for export. Labeling data may be exported one compound at a time (including unlabeled and labeled peak groups) from the EIC window, or all at once either from the peak group table or from the table of “bookmarked” compounds. To export individual compounds from the EIC window, launch Microsoft Excel. Pull up the peak of interest in the EIC window, and left click on the EIC of the parent, unlabeled peak. All data are copied to the clipboard. Control + V or right click to paste to into Excel. To bookmark data, follow the procedure outlined in Basic Protocol 3, step 10. All unlabeled and labeled forms will be copied to the table of bookmarked compounds. To export only the bookmarked data or the entire EIC peak group table as a .csv file or as a PDF, click on the .csv or .pdf icons from within the corresponding table.
-
8
Save the table of bookmarked compounds, or the entire peak table, for future analysis within MAVEN, by clicking on the XML icon within the table. This will save the peak table as a .mzPeaks file.
Figure 14.11.10.
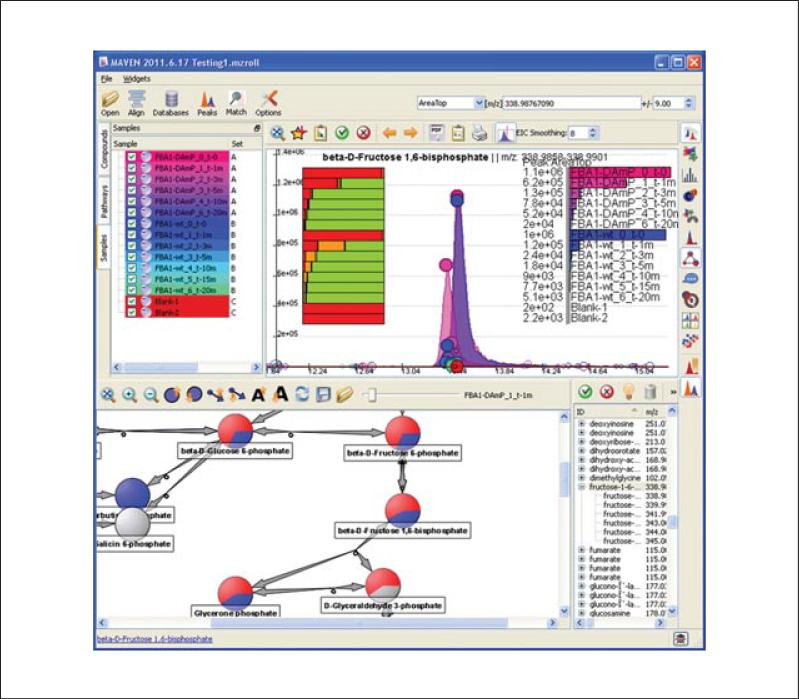
Metabolic pathway map with pie charts indicating the extent of incorporation of uniformly 13C labeled glucose into glycolytic metabolites. Unlabeled metabolites are depicted in blue, and the sums of all labeled forms are depicted in red. The sample name is listed adjacent to the slide bar. For color version of this figure see http://www.currentprotocols.com/protocol/bi1411.
Pathway visualization
-
9
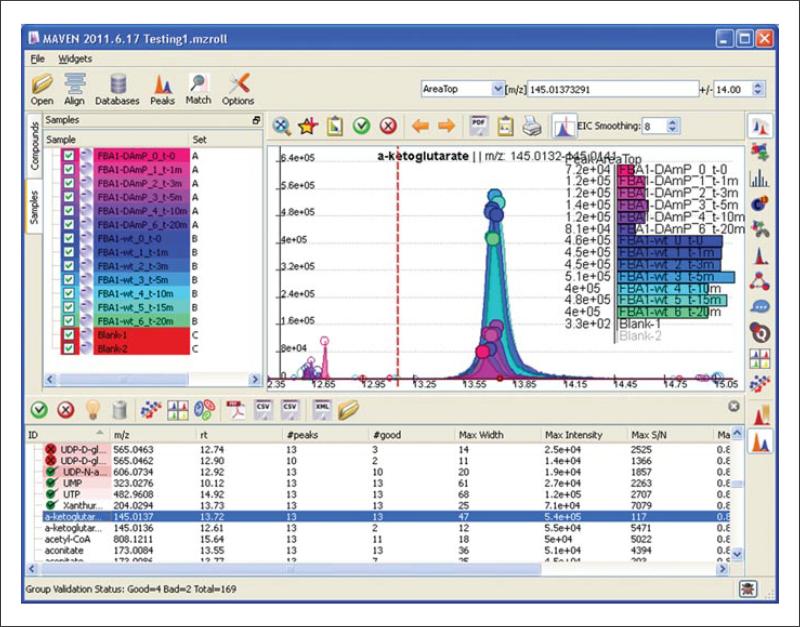
To overlay the data on metabolic pathways, type the name of the pathway of interest into the text box in the upper right hand corner (e.g., Glycolysis/Gluconeogenesis). Part way through typing, the name should appear from the drop-down menu. Select it. A new window will appear displaying data on the metabolic map (Fig. 14.11.11). If all circles are gray, click the refresh double-arrow button. Blue represents the unlabeled fraction. Red represents the sum of all isotopically labeled forms.
-
10
Zoom in and out on the pathway by clicking on the magnifying glasses.
-
11
Change metabolite node size, linking arrows, and text by clicking on the blue metabolite node circles, blue arrows, and black A's, respectively.
-
12
Scroll across the slide bar to view the incorporation of the isotopic label at each metabolite node in each sample individually. For kinetic labeling experiments, this scrolling can visually illustrate the time-dependent labeling of different metabolites.
-
13
Each node is linked to a parent ion and isotope group. The analyst should ensure that each node is linked to the correct group. To display the data linked to a metabolite node, left click on the circular metabolite node. The corresponding EIC will be displayed. If the node is linked to the wrong compound's data, and the correct data are present, simply click on the metabolite node in the pathway map, then go to the correct peak group. Left click on the group and select Link to Compound to correct the annotation. If annotation is incorrect and no data exist for the peak of interest, right click on the metabolite node and select “unlink.” The box should turn gray.
-
14
To produce of movie of the kinetic labeling results, right click on the pathway view and click Animate. The animation can be captured with a screen capture program.
Figure 14.11.11.
MAVEN screenshot displaying isotope labeling. In this example, yeast were switched from unlabeled to uniformly 13C-labeled glucose. Data shown are for fructose 1,6-bisphosphate (FBP) from yeast expressing either the normal (wt) or a decreased (DAmP) concentration of the enzyme responsible for the reversible reaction between FBP and two triose phosphates, fructose bisphosphate aldolase (encoded by fba1). The bar chart with the cursor on it provides information on the extent of isotope labeling. Upon mousing over the orange bar, MAVEN reveals that it reflects the 13C3- form of FBP. This form is uniquely abundant at earlier time points in the wt strain, consistent with reverse aldolase flux joining together one labeled and one unlabeled triose. For color version of this figure see http://www.currentprotocols.com/protocol/bi1411.
GUIDELINES FOR UNDERSTANDING RESULTS
The objective of MAVEN is to convert raw LC-MS metabolomics data (including in the presence of isotope tracers) into a format ready for biological analysis. It can generate two particularly useful outputs: (1) tables of known compounds, including isotope labeled forms, and their associated LC-MS signal intensities across samples, and (2) LC-MS peaks, whether or not they correspond to known metabolites, which differ strongly across biological conditions. These outputs of MAVEN are generally reliable and often easily interpretable. For example, from LC-MS analysis of glioblastoma cells with and without mutant isocitrate dehydrogenase, MAVEN immediately pulled out the three peaks corresponding to the oncometabolite 2-hydroxyglutarate (-H+, –2H+ + Na+, and – H3O+) (Dang et al., 2009). To enhance the odds of proper biological interpretation, it is useful for the user to be attuned to be few additional issues as outlined in the following paragraphs.
The user retains responsibility for data quality assurance
MAVEN checks for LC-MS peak quality, but it does not include safeguards against other forms of analytical error. One involves deterioration of LC-MS system performance within a set of samples. For example, LC retention times or peak shapes may shift or the ionization intensity may decrease (e.g., due to clogging of the ion transfer tube). Since analytical variability impedes the ability to determine true biological differences, monitoring for such analytical issues is critical. One means is through the bracketing of biological samples with quality controls (QC). A popular approach is to pool all biological samples to produce the one QC sample. It is also useful to intersperse blanks to check for carry over. A further safeguard is to interweave samples from different biological conditions (i.e., run samples in the order “ABABAB” not “AAABBB”). Running of QC samples and interweaving of replicate samples also helps to detect degradation of labile metabolites during the analysis period.
Not every m/z feature represents a metabolite
Many features identified in full-scan LC/MS analysis are not due to actual metabolites, but rather arise from the formation of adducts (e.g., Na+, K+, CH3CN+H+, MeOH+H+, etc.), and in-source fragmentation events (e.g., loss of CO2 , H2O). We often refer to these features as “artifacts.” A particularly problematic issue is when the in-source degradation of one metabolite gives rise to artifactual signal for another metabolite, e.g., glucose-6-phosphate can undergo in-source degradation to erythrose-4-phosphate. The solution to this problem is two-fold: chromatographic separation and awareness. MAVEN does not automatically detect such artifacts, but it can help the user to identify them through its correlation feature, and by automatically calculating which features match expected Δm/z of common adducts (Basic Protocol 3, step 15). It is advisable to toggle back and forth between the suggested parent, adduct, and fragment-derived ions, correcting annotations if necessary. For further information on adduct identification, see Huang et al. (1999) and Keller et al. (2008).
Additional information is required for metabolite identification
Determining elemental composition based on exact mass is an important step in annotating an MS feature as a specific metabolite. Nevertheless, it is insufficient. The identity of the metabolite needs to be verified by comparison of all existing analytical data to a purified standard. The minimum additional data item is retention time, with RT in two orthogonal chromatographic methods preferred. MS/MS fragmentation is both easy to obtain (given suitable instrumentation) and valuable. For cellular metabolites, isotope labeling can help confirm both elemental composition and biosynthetic route. For novel molecules, chiral separation and/or NMR analysis may be required to confirm the structure.
Isotopic labeling data require correction for natural isotopic abundance
Isotope labeling data should be corrected for the natural abundance of different isotopes, most importantly 13C (natural abundance 1.1%). This is particularly important for M + 1 forms. MAVEN does not automatically conduct this correction. For the required equations, see Yuan et al. (2008). When using 2H-labeling data for flux studies, additional correction for kinetic isotope effects (i.e., isotopic fractionation) is also required.
COMMENTARY
Background Information
Utility of MAVEN
The growing application of LC-MS-based metabolomics has led to increased demand for software that converts raw LC-MS data into usable information. A number of high-quality, open-source software packages have been developed including XCMS(2) (Smith et al., 2006; Benton et al., 2008) and MZmine (Pluskal et al., 2010). MAVEN is similar to these packages in providing tools for automated feature detection and alignment, and provides added tools for interactive raw data visualization to facilitate data validation. MAVEN is currently capable of supporting a wide variety of MS platforms including Applied Biosystems (ABI) and Thermo triple quadrupole data, ABI and Agilent ToF data, as well as Thermo LTQ, FT-ICR, and Orbitrap data. For an up-to-date list of supported platforms, refer to the MAVEN Web site (http://maven.princeton.edu). A limitation of MAVEN is that it is not currently capable of analyzing data-dependent MS/MS.
Full-scan, untargeted LC-MS data analyzed in MAVEN are well suited for finding metabolites that differ across biological conditions. One important application is “Discovery Metabolite Profiling,” where enzyme function is elucidated by analyzing changes in the metabolome induced by enzyme inhibition (Saghatelian and Cravatt, 2005). For example, analysis of LC-MS data from a single gene knockout strain of yeast in MAVEN led to discovery of the novel metabolic pathway of riboneogenesis (Clasquin et al., 2010). MAVEN played two key roles in this effort: (1) identifying through untargeted analysis sedoheptulose-1,7-bisphosphate and related metabolites as up-regulated in the knockout yeast strain; and (2) enabling rapid targeted metabolite quantitation in subsequent experiments involving isotopic tracers.
MAVEN itself does not measure metabolic fluxes (Sauer, 2006). By quantitating isotope labeled forms, however, it facilitates ultimate flux quantitation. This requires additional computational steps, beginning with correction for natural isotopic abundance (see above). Depending on whether the experiment involves steady-state or dynamic labeling, the resulting corrected data can then be analyzed within either a metabolic flux analysis (Antoniewicz et al., 2007; Zamboni et al., 2009) or kinetic flux profiling (Yuan et al., 2006) computational framework. When both steady-state and dynamic labeling data are available, a hybrid of the two can be particularly powerful; such a hybrid approach led to identification of acetyl-CoA carboxylase as an antiviral drug target (Munger et al., 2008).
By enabling rapid generation of large tables of validated metabolite peak intensities, MAVEN also sets the stage for computational modeling of metabolic dynamics (see, e.g., (Yuan et al., 2009; Kotte et al., 2010) and for “integrative ‘omics” efforts (Patil and Nielsen, 2005; Ishii et al., 2007; Shlomi et al., 2007; Nakahigashi et al., 2009; Haverkorn van Rijsewijk et al., 2011).
Critical Parameters and Troubleshooting
Typical parameters for each step of data processing are outlined within the corresponding protocol steps and figures. We encourage users to report bugs in MAVEN as they are encountered. If the program unexpectedly quits for any reason, locate the small bug icon in the lower right corner. Clicking the button will direct you to the “MAVEN Bug Report Form” online. Please submit a description of the problem including what actions you were performing just prior to the error, the version and operating system you are using, and your contact information.
Literature Cited
- Antoniewicz MR, Kraynie DF, Laffend LA, González-Lergier J, Kelleher JK, Stephanopoulos G. Metabolic flux analysis in a nonstationary system: Fed-batch fermentation of a high yielding strain of E. coli producing 1,3-propanediol. Metab. Eng. 2007;9:277–292. doi: 10.1016/j.ymben.2007.01.003. [DOI] [PMC free article] [PubMed] [Google Scholar]
- Benton HP, Wong DM, Trauger SA, Siuzdak G. XCMS2: Processing tandem mass spectrometry data for metabolite identification and structural characterization. Anal. Chem. 2008;80:6382–6389. doi: 10.1021/ac800795f. [DOI] [PMC free article] [PubMed] [Google Scholar]
- Clasquin MF, Melamud E, Singer A, Gooding JR, Xu X, Dong A, Cui H, Campagna SR, Savchenko A, Yakunin AF, Rabinowitz JD, Caudy AA. Riboneogenesis in yeast. Cell. 2010;145:969–980. doi: 10.1016/j.cell.2011.05.022. [DOI] [PMC free article] [PubMed] [Google Scholar]
- Dang L, White DW, Gross S, Bennett BD, Bittinger MA, Driggers EM, Fantin VR, Jang HG, Jin S, Keenan MC, Marks KM, Prins RM, Ward PS, Yen KE, Liau LM, Rabinowitz JD, Cantley LC, Thompson CB, Vander Heiden MG, Su SM. Cancer-associated IDH1 mutations produce 2-hydroxyglutarate. Nature. 2009;462:739–744. doi: 10.1038/nature08617. [DOI] [PMC free article] [PubMed] [Google Scholar]
- Deutsch EW, Mendoza L, Shteynberg D, Farrah T, Lam H, Tasman N, Sun Z, Nilsson E, Pratt B, Prazen B, Eng JK, Martin DB, Nesvizhskii AI, Aebersold R. A guided tour of the Trans-Proteomic Pipeline. Proteomics. 2010;10:1150–1159. doi: 10.1002/pmic.200900375. [DOI] [PMC free article] [PubMed] [Google Scholar]
- Haverkorn van Rijsewijk BR, Nanchen A, Nallet S, Kleijn RJ, Sauer U. Large-scale 13C-flux analysis reveals distinct transcriptional control of respiratory and fermentative metabolism in Escherichia coli. Mol. Syst. Biol. 2011;7:477. doi: 10.1038/msb.2011.9. [DOI] [PMC free article] [PubMed] [Google Scholar]
- Huang N, Siegel MM, Kruppa GH, Laukien FH. Automation of a Fourier transform ion cyclotron resonance mass spectrometer for acquisition, analysis, and e-mailing of high-resolution exact-mass electrospray ionization mass spectral data. J. Am. Soc. Mass Spectrom. 1999;10:1166–1173. [Google Scholar]
- Ishii N, Nakahigashi K, Baba T, Robert M, Soga T, Kanai A, Hirasawa T, Naba M, Hirai K, Hoque A, Ho PY, Kakazu Y, Sugawara K, Igarashi S, Harada S, Masuda T, Sugiyama N, Togashi T, Hasegawa M, Takai Y, Yugi K, Arakawa K, Iwata N, Toya Y, Nakayama Y, Nishioka T, Shimizu K, Mori H, Tomita M. Multiple high-throughput analyses monitor the response of E. coli to perturbations. Science. 2007;316:593–597. doi: 10.1126/science.1132067. [DOI] [PubMed] [Google Scholar]
- Keller BO, Sui J, Young AB, Whittal RM. Interferences and contaminants encountered in modern mass spectrometry. Anal. Chim. Acta. 2008;627:71–81. doi: 10.1016/j.aca.2008.04.043. [DOI] [PubMed] [Google Scholar]
- Kotte O, Zaugg JB, Heinemann M. Bacterial adaptation through distributed sensing of metabolic fluxes. Mol. Syst. Biol. 2010;6:355. doi: 10.1038/msb.2010.10. [DOI] [PMC free article] [PubMed] [Google Scholar]
- Lu W, Bennett BD, Rabinowitz JD. Analytical strategies for LC-MS-based targeted metabolomics. J. Chromatogr. B Analyt. Technol. Biomed. Life Sci. 2008;871:236–242. doi: 10.1016/j.jchromb.2008.04.031. [DOI] [PMC free article] [PubMed] [Google Scholar]
- Lu W, Clasquin MF, Melamud E, Amador-Noguez D, Caudy AA, Rabinowitz JD. Metabolomic analysis via reversed-phase ion-pairing liquid chromatography coupled to a stand alone orbitrap mass spectrometer. Anal. Chem. 2010;82:3212–3221. doi: 10.1021/ac902837x. [DOI] [PMC free article] [PubMed] [Google Scholar]
- Melamud E, Vastag L, Rabinowitz JD. Metabolomic analysis and visualization engine for LC-MS data. Anal. Chem. 2010;82:9818–9826. doi: 10.1021/ac1021166. [DOI] [PMC free article] [PubMed] [Google Scholar]
- Munger J, Bennett BD, Parikh A, Feng XJ, McArdle J, Rabitz HA, Shenk T, Rabinowitz JD. Systems-level metabolic flux profiling identifies fatty acid synthesis as a target for antiviral therapy. Nat. Biotechnol. 2008;26:1179–1186. doi: 10.1038/nbt.1500. [DOI] [PMC free article] [PubMed] [Google Scholar]
- Nakahigashi K, Toya Y, Ishii N, Soga T, Hasegawa M, Watanabe H, Takai Y, Honma M, Mori H, Tomita M. Systematic phenome analysis of Escherichia coli multiple-knockout mutants reveals hidden reactions in central carbon metabolism. Mol. Syst. Biol. 2009;5:306. doi: 10.1038/msb.2009.65. [DOI] [PMC free article] [PubMed] [Google Scholar]
- Nicholson JK, Lindon JC. Systems biology: Metabonomics. Nature. 2008;455:1054–1056. doi: 10.1038/4551054a. [DOI] [PubMed] [Google Scholar]
- Palsson B. Metabolic systems biology. FEBS Lett. 2009;583:3900–3904. doi: 10.1016/j.febslet.2009.09.031. [DOI] [PMC free article] [PubMed] [Google Scholar]
- Patil KR, Nielsen J. Uncovering transcriptional regulation of metabolism by using metabolic network topology. Proc. Natl. Acad. Sci. U.S.A. 2005;102:2685–2689. doi: 10.1073/pnas.0406811102. [DOI] [PMC free article] [PubMed] [Google Scholar]
- Pluskal T, Castillo S, Villar-Briones A, Oresic M. MZmine 2: Modular framework for processing, visualizing, and analyzing mass spectrometry-based molecular profile data. BMC Bioinformatics. 2010;11:395. doi: 10.1186/1471-2105-11-395. [DOI] [PMC free article] [PubMed] [Google Scholar]
- Saghatelian A, Cravatt BF. Discovery metabolite profiling-forging functional connections between the proteome and metabolome. Life Sci. 2005;77:1759–1766. doi: 10.1016/j.lfs.2005.05.019. [DOI] [PubMed] [Google Scholar]
- Sauer U. Metabolic networks in motion: 13C-based flux analysis. Mol. Syst. Biol. 2006;2:62. doi: 10.1038/msb4100109. [DOI] [PMC free article] [PubMed] [Google Scholar]
- Shlomi T, Eisenberg Y, Sharan R, Ruppin E. A genome-scale computational study of the interplay between transcriptional regulation and metabolism. Mol. Syst. Biol. 2007;3:101. doi: 10.1038/msb4100141. [DOI] [PMC free article] [PubMed] [Google Scholar]
- Smith CA, Want EJ, O'Maille G, Abagyan R, Siuzdak G. XCMS: Processing mass spectrometry data for metabolite profiling using nonlinear peak alignment, matching, and identification. Anal. Chem. 2006;78:779–787. doi: 10.1021/ac051437y. [DOI] [PubMed] [Google Scholar]
- Wei R. Metabolomics and its practical value in pharmaceutical industry. Curr. Drug Metab. 2011;12:345–358. doi: 10.2174/138920011795202947. [DOI] [PubMed] [Google Scholar]
- Xu EY, Schaefer WH, Xu Q. Metabolomics in pharmaceutical research and development: Metabolites, mechanisms and pathways. Curr. Opin. Drug Discov. Dev. 2009;12:40–52. [PubMed] [Google Scholar]
- Yuan J, Fowler WU, Kimball E, Lu W, Rabinowitz JD. Kinetic flux profiling of nitrogen assimilation in Escherichia coli. Nat. Chem. Biol. 2006;2:529–530. doi: 10.1038/nchembio816. [DOI] [PubMed] [Google Scholar]
- Yuan J, Bennett BD, Rabinowitz JD. Kinetic flux profiling for quantitation of cellular metabolic fluxes. Nat. Protoc. 2008;3:1328–1340. doi: 10.1038/nprot.2008.131. [DOI] [PMC free article] [PubMed] [Google Scholar]
- Yuan J, Doucette CD, Fowler WU, Feng XJ, Piazza M, Rabitz HA, Wingreen NS, Rabinowitz JD. Metabolomics-driven quantitative analysis of ammonia assimilation in E. coli. Mol. Syst. Biol. 2009;5:302. doi: 10.1038/msb.2009.60. [DOI] [PMC free article] [PubMed] [Google Scholar]
- Zamboni N, Fendt SM, Ruhl M, Sauer U. (13)C-based metabolic flux analysis. Nat. Protoc. 2009;4:878–892. doi: 10.1038/nprot.2009.58. [DOI] [PubMed] [Google Scholar]


