Abstract
Background
The relationship between cardiac resynchronization therapy (CRT), left ventricular (LV) lead position, scar, and regional mechanical function influences CRT response.
Objective
To determine LV lead position relative to LV structural characteristics in standard clinical practice, we developed and validated a practical yet mathematically rigorous method to register procedural fluoroscopic LV lead position with pre-CRT cardiac magnetic resonance (CMR).
Methods
After one-time calibration of the standard fluoroscopic suite, we identified the projected CMR LV lead position using three reference landmarks on both CMR and fluoroscopy. This predicted lead position was validated in a canine model by histology and in eight “validation group” patients based on postoperative computed tomography scans (n = 7) or CMR coronary sinus venography (n = 1). The methodology was applied in an additional eight patients with CRT nonresponse and infarction-related myocardial scar.
Results
The projected and actual lead positions were within 1.2 mm in the canine model. The median distance between projected and actual lead positions for the validation group (n = 8) and animal validation case was 11.3 mm (interquartile range 9.2–14.6 mm). In the application (nonresponder) group (n = 8), the lead mapped to the scar periphery in three patients, the core of the scar in one patient, and more than 3 cm from scar in four patients.
Conclusions
This methodology projects procedural fluoroscopic LV lead position onto pre-CRT CMR using standard fluoroscopic equipment and a one-time calibration, enabling assessment of LV lead position with sufficient accuracy to identify the lead position relative to regional function and infarction-related scar in CRT nonresponders.
Keywords: cardiac resynchronization therapy, devices for heart failure, cardiac magnetic resonance, fluoroscopy, coronary sinus, biomedical engineering, myocardial infarction
Introduction
Although cardiac resynchronization therapy (CRT) improves overall survival in appropriate selected populations,1,2 implementation of CRT continues to be limited by nonresponse rates on the order of 30–40%.3 These response rates may be influenced by left ventricular (LV) pacing site. Although pacing within a certain “sweet spot” in the posterolateral LV has been shown to produce the optimal hemodynamic improvement in an animal model,4 clinical studies have shown significant variability in the LV pacing site that results in optimal hemodynamics in human heart failure.5–7 These differences in optimal LV pacing site from patient to patient are associated with varying patterns of LV electromechanical activation and distributions of myocardial scar.8–11 In particular, LV pacing sites in areas of myocardial scar have been associated with suboptimal outcomes.11
For CRT nonresponders with prior myocardial infarction, a practical but mathematically rigorous method to identify the proximity of the LV lead position to scar may be highly useful to determine whether CRT nonresponse should be attributed to the proximity of the lead position relative to scar or another cause. Other approaches for co-registering the fluoroscopic LV lead position with three-dimensional (3D) cardiac imaging studies for scar either require specialized hardware with 3D fluoroscopic navigation software12,13 or utilize less rigorous methods such as semiquantitative evaluation of fluoroscopic images14 and qualitative review of postoperative chest radiography.15 The former methods requiring specialized equipment are costly and not available in most electrophysiology labs, whereas the latter methods do not provide a complete mathematical algorithm for transformation of two-dimensional (2D) imaging data into 3D imaging space. In order to address the need for a practical and quantitative method to identify LV lead position relative to 3D cardiac imaging based on images obtained in electrophysiology labs with standard fluoroscopy, we developed a practical and accurate method that requires only a simple calibration of the fluoroscopy imaging equipment and manual selection of easily identified cardiac landmarks. Our approach allows measurement of LV lead location on anatomic images with sufficient accuracy to evaluate the effects of LV anatomy, scar, function, and lead location in CRT nonresponders without requiring specialized registration equipment. We expect this method to be highly useful for identification of the cause of CRT nonresponse during follow-up in patients with scar from prior myocardial infarction.
Methods
The method for registering fluoroscopic images of an implanted LV lead obtained in a standard fluoroscopy suite with standard cardiac magnetic resonance (CMR) cine images is shown in Figure 1. Both 2D fluoroscopic imaging and 3D CMR imaging were performed (Fig. 1, columns 2 and 3), and common anatomical landmarks were selected from each image. 3D positions were reconstructed from 2D fluoroscopic projections using prestudy calibration data (Fig. 1, column 1). Finally, the landmarks were used to merge the fluoroscopic and CMR data. This process allows the lead position selected in the fluoroscopic images to be transformed into the same coordinate system as anatomical data from CMR images.
Figure 1.
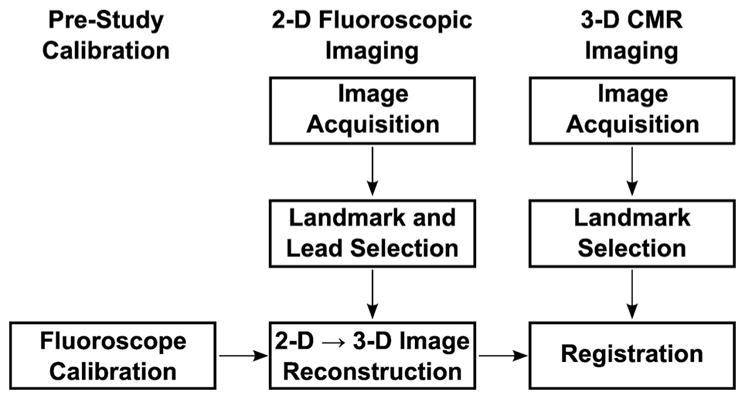
Process flow diagram for registering fluoroscopic images to CMR images. The processes involved in image registration are shown in the figure. These include prestudy calibration (column 1), 2D fluoroscopic imaging (column 2), and 3D CMR imaging (column 3). See text for additional details. CMR = cardiac magnetic resonance.
Fluoroscopy Calibration
Calibration was performed once for each fluoroscopy system, and was applied to all images acquired by that system. A total of six fluoroscopy suites were calibrated for use. Calibration images of a cylindrical Plexiglass phantom, embedded with 17 lead beads forming a spiral curve down its length, were acquired at right and left anterior oblique (RAO and LAO) angles in the range of standard clinical views and the anterior-posterior (AP) view (Figs. 2A and B). The relationship between the phantom bead coordinates in 2D fluoroscopic images (ui, vi) and their physical 3D coordinates (xi, yi, zi) was represented by the 4 × 3 transformation matrix T,16 calculated with Eq. (1) for each image angle:
| (1) |
Figure 2.
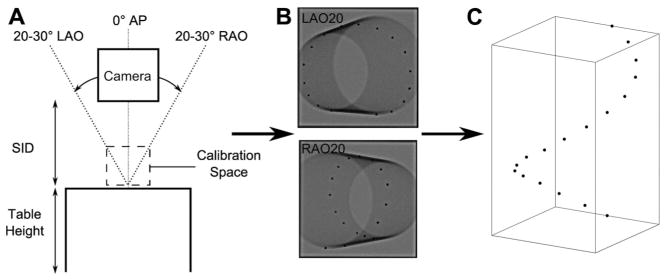
Calibration to transform 2D fluoroscopic data to 3D coordinates. The fluoroscopy equipment was calibrated for standard LAO, RAO, and AP view angles at a standard SID and table height (A). Two 2D fluoroscopic images of a cylindrical phantom with radiopaque beads along its length (B) were used to calculate the relationship between the bead coordinates in the image and the real 3D coordinates with respect to the origin bead. This calibration was used to reconstruct three 2D fluoroscopic views into the bead coordinates in 3D (C). AP = anterior-posterior; LAO = left anterior oblique; RAO = right anterior oblique; SID = source-to-image distance.
3D coordinates were reconstructed by acquiring two images of the object from orthogonal views, such as the images shown in Figure 2(B), and then computing the 3D coordinates with Eq. (2)16:
| (2) |
where (u1, v1) and (u2, v2) refer to the coordinates of the same point in two different fluoroscopic views; sij and tij refer to the elements of the transformation matrices of the two fluoroscopic image angles; and x, y, and z are the reconstructed 3D points, such as those in Figure 2(C) reconstructed from 2D fluoroscopic images of the phantom.
Magnification Adjustment
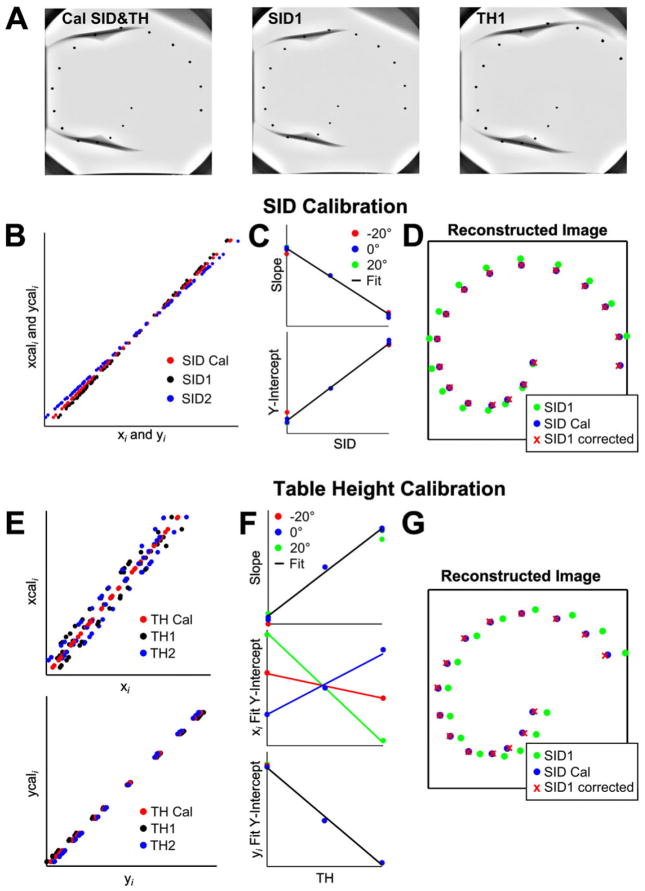
As clinical images were often acquired with camera source-to-image distance (SID) and table height (TH) different than those used to compute the calibration transformation matrices, we developed an algorithm to account for these differences prior to 3D reconstruction (Fig. 3). This algorithm is summarized in Figure 3. Increasing or decreasing the SID alters the magnification of the image, visualized in Figure 3(B) as the slope of the relationship between the x or y coordinate of a point on the calibration phantom in the image (xi, yi) and the x or y coordinate of the corresponding point in an image taken at the calibration SID (xcali, ycali). By contrast, altering the TH changes magnification only slightly but significantly shifts the position of an object in the oblique views (Fig. 3E). We found that the shifts in slope and intercept of these relationships were linear functions of SID and TH, so that simple linear corrections applied prior to 3D reconstruction corrected effectively for the effects of both SID and TH (Figs. 3D and G).
Figure 3.
Fluoroscopic magnification adjustment. Images were acquired at multiple SID and TH values to determine the relationship between object coordinates in a magnified image (xi and yi, acquired at SID1 or TH1) and object coordinates in an image acquired at the calibration SID or TH (xcali and ycali). Images were acquired at multiple SID and TH values (A). The relationship between xi and yi at SID1 and xcali and ycali at the calibration SID was linear (B). The slope and intercept of this relationship varied with SID but were the same for every acquisition angle and for both x and y coordinates (C). This linear fit was used to correct coordinates from the image acquired at SID1 prior to 3D reconstruction (D). A similar process was used to reconstruct images acquired at different table heights. However, while yi is clearly linearly related to ycali, xcali is not just a function of table height and xi (E). The Y-intercept of the xi-xcali relationship is a function of both TH and acquisition angle, which was accounted for with a multiple linear regression fit (F). This process allowed accurate reconstruction of the 3D bead position at any TH (G). SID = source-to-image distance; TH = table height.
Registration of Fluoroscopic and CMR Images
Image Acquisition
Preprocedure CMR was performed in each patient using a 1.5-T clinical scanner (Avanto, Siemens Healthcare, Erlangen, Germany) with a phased array receiver coil on the chest. Cine images were acquired using a steady-state free precession pulse (SSFP) sequence in eight to 10 contiguous short-axis slices with slice thickness of 8 mm, and in standard long-axis views. In addition, a stack of axial cine images were acquired with slice thickness of 7 mm. Late gadolinium enhancement (LGE) imaging was performed in short-axis locations identical to the cine images 10–15 minutes after injection of 0.2 mmol/kg gadodiamide (Omniscan, GE Health-care, Chalfont St Giles, UK) in patients with glomerular filtration rates of at least 60 cc/min, and with gadopentetate dimeglumine in selected patients if the glomerular filtration rate was 45–60 cc/min (Magnevist, Bayer HealthCare Pharmaceuticals, Tarrytown, NY, USA). A phase-sensitive inversion recovery fast gradient-echo pulse sequence was used. In selected patients, whole-heart navigator-guided 3D venography of the coronary sinus was also performed prior to LGE imaging.
The device implantation procedure was guided by a standard clinical fluoroscopy system. The fluoroscopic camera typically was rotated over a range of 60° during the procedure—from 30° in the RAO view to 30° in the LAO view, and SID and TH were adjusted independently in order to optimize the fluoroscopic views and minimize scatter. After CRT implantation, images of the final lead position for registration analysis were acquired at two orthogonal views without changing SID, TH, or table position.
Fluoroscopic and CMR Landmark Selection
On the basis of the requirement of three landmarks to achieve accurate 3D registration, we identified the right ventricular apex (RVA), the ostium of the coronary sinus, and the anterolateral segment of the mitral annulus as three anatomical landmarks that can be consistently identified in all fluoroscopic images and in CMR image slices. Identification of the fluoroscopic landmarks was performed according to a specific algorithm based on coronary sinus venography and the course of the leads. Multiplanar coronary sinus venograms were used to identify the coronary sinus os (CSO) and anterolateral mitral annulus, while the fluoroscopic course of the leads was also used to identify both coronary sinus and right ventricular (RV) landmarks. All three landmarks and the LV lead position were selected in two fluoroscopic images acquired at the end of implantation, and then reconstructed into 3D coordinates using the methods detailed above. In CMR, the RVA was selected from the four-chamber cine image, CSO from an axial cine image, and the lateral mitral annulus (LMA) landmark was selected from the basal short-axis cine image. All landmarks were selected at end diastole.
Registration Methodology
We used an error minimization technique for registration, which assumes: (1) the location of the LV lead relative to the designated landmarks will be similar in both the fluoroscopy and CMR coordinate system, and (2) the lead is located on the epicardium. The epicardium was contoured from short- and long-axis cine CMR slices using the software Segment v1.9 R2278 (http://segment.heiberg.se)17 and a surface was fit to the contours using methods described previously by our lab.18 Possible solutions for the LV lead position were restricted to this fitted epicardial surface. The most likely LV lead position was chosen as the point on the epicardial surface at which the distance between the lead position and each of the three landmarks in the CMR coordinate space (dmi) was most similar to the equivalent distances in the fluoroscopic space (dfi), that is, the objective function O in Eq. (3) was calculated for n locations on the epicardial surface mesh:
| (3) |
The point that produced the minimum value for O was chosen as the LV lead position in the CMR coordinate system. The difference in the distance between landmarks selected in fluoroscopy and CMR was used as a check to ensure that overall landmark selection was similar between fluoroscopy and CMR. This algorithm was implemented in custom software written for Matlab (v7.14, The Mathworks, Natick, MA, USA).
Scar Mapping
In patients with previous myocardial infarction, scar was manually segmented from enhanced short-axis images using the segmentation software Segment described earlier. Scar transmurality was measured in each short-axis image as a fraction of wall thickness calculated over the circumference with a 5° moving average window, using custom software implemented in Matlab. The location of each scar transmurality measurement was mapped on a mesh covering the entire LV and linearly interpolated between slices. These data, along with the mapped lead placement, were displayed on a Hammer projection map of the epicardial surface.18
Validation Methodology
We tested our registration technique in one proof-of-concept canine study with validation by histology, seven CRT patients with validation by clinically indicated cardiac computed tomography (CT) imaging after lead implantation, and one CRT patient with preprocedure CS venography validation.
Validation Protocol—Canine
The canine protocol (n = 1) was approved by the Animal Care and Use Committee (ACUC) of the University of Virginia. An RV lead was inserted in the RV apical septum via the internal jugular vein, and the LV lead was implanted on the posterolateral epicardium. Radiopaque beads were sutured onto the epicardium near the RV apex and at the base near the CSO and LMA. After recovery, CMR and fluoroscopy imaging were performed as described above. The animal was then euthanized, and the heart was explanted and fixed in formalin for postmortem analysis. The LV was cut into short-axis slices and imaged to verify the location of the LV epicardial lead. Landmarks were selected in fluoroscopic images using the radiopaque beads, and the registration error was calculated as the distance between the predicted lead position and the LV lead shadow on CMR imaging, with histologic confirmation of this lead location.
Validation Protocol—Human
This study was approved by the Institutional Review Board for Human Subjects Research (IRB-HSR) of the University of Virginia, and all patients provided informed consent. Clinical enrollment was based on a prospective evaluation of preprocedure CMR in patients undergoing CRT. Seven patients underwent CT imaging after the CRT procedure. The axial CT image showing the LV lead tip was compared with the CMR axial images to find the closest match, and then the “true” lead tip location was selected in this CMR axial image. For the patient validated by CMR coronary sinus (CS) venography (n = 1), the cardiac veins were manually segmented from MR image slices using custom Matlab software and visually verified to correspond to the implantation vein visible in fluoroscopic venograms. The lead position error was calculated as the distance between the CT lead tip or cardiac vein segmentation and the projected lead position.
Interobserver Variability
In order to demonstrate that this methodology results in reproducible identification of landmarks on the biplane fluoroscopic images, we performed an interobserver variability analysis of fluoroscopic landmark identification with two board-certified electrophysiologists with extensive experience in CRT implantation (KB and RM). Each observer independently viewed fluoroscopic images in both planes and identified the three landmarks in both projections using a custom program written in Matlab. The software then calculated the 3D location of all three landmarks for both users.
Statistics
Statistical analysis was performed using SAS 9.3 (SAS Institute, Cary, NC, USA). Continuous variables by patient for the validation and application groups were described using the median and interquartile range and compared using the Wilcoxon two-sample test. Categorical variables by patient were expressed as percentages and compared using the Fisher exact test.
Results
In a canine model with radiopaque beads sewn to the heart muscle to mark the anatomic landmarks and the LV lead sewn to the epicardium, the artifact seen on CMR SSFP imaging was confirmed to be in the same location as the pacing lead in postmortem analysis (Figs. 4A and B). The radiopaque beads were easily seen on fluoroscopy (panel C) at the RV anterior basal septum (as a substitute for the CSO used in clinical patients), the RV apical septum, and the LMA (180° from the CSO on the mitral annulus). When the lead registration algorithm was applied, the predicted site for the LV lead was within 1.2 mm (Table I) of the lead artifact visible in CMR SSFP imaging (panel D).
Figure 4.
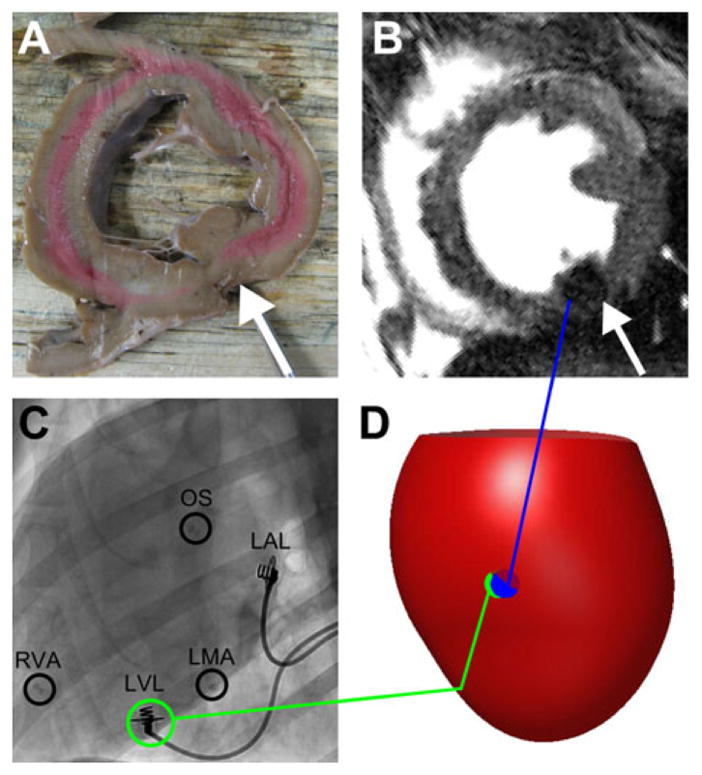
Canine validation of lead localization algorithm. In the short-axis cross-section of the left ventricle containing the epicardial LV lead (A), the MR artifact produced by the lead tip can be seen in the corresponding short-axis slice from the CMR study (B). Radiopaque beads were used to mark the OS, RVA, and LMA in the fluoroscopic images (C). An anterolateral view of an integrated 3D map showing the epicardium (red surface) demonstrates the proximity of the predicted LV lead position from fluoroscopy (green) to the LV lead position measured from CMR (blue) (D). CMR = cardiac magnetic resonance; LMA = lateral mitral annulus; LV = left ventricular; OS = coronary sinus os; RVA = right ventricular apex.
Table I.
Patient Characteristics
| Validation | Application | P Value | |
|---|---|---|---|
| Age (years) | 71.6 (66.4–76.5) | 67.3 (64.7–76.6) | 0.64 |
| Gender (% male) | 87.5 | 100 | 1.0 |
| LVEF | 0.22 (0.13–0.27) | 0.24 (0.21–0.28) | 0.50 |
| LVEDV (mL) | 298 (293–307) | 303 (255–334) | 0.88 |
| LVESV (mL) | 237 (194–268) | 226 (190–248) | 0.68 |
| % Scar volume (in only patients with scar) | 14.6 (10.6–17.2) | 6.5 (4.8–9.2) | 0.64 |
| % Scar volume (all patients) | 3.65 (0–14.6) | 6.5 (4.8–9.2) | 0.10 |
| QRS (ms) | 148 (137–158) | 140 (131–165) | 0.72 |
Continuous variables are described as median (IQR) and compared using Wilcoxon two-sample tests. Categorical variables are expressed as percentages and compared using Fisher’s exact tests.
LVEDV = left ventricular end-diastolic volume; LVEF = left ventricular ejection fraction; LVESV = left ventricular end-systolic volume.
On the basis of this proof-of-concept study, these methods were then tested in eight patients with pre-CRT CMR imaging that made up the validation group (Table I). The final lead position for each subject is listed in Table II. We measured the distance between landmark pairs selected from fluoroscopy and CMR, and used the difference in landmark pair distance between modalities as an estimate of landmark selection error, as shown in Table II. The median difference in landmark distances was 8.8 mm (interquartile range [IQR] 3.6–15.9 mm). In addition, the mean distance between landmarks selected from the fluoroscopic images by two independent users in a subset of 10 patients was 7.0 mm for the CSO (IQR 2.4–10.0 mm), 4.1 mm for the LMA (IQR 2.4–4.0 mm), and 1.4 mm for the RVA (IQR 0.7–1.4 mm).
Table II.
Coregistration Results
| Validation | Application | P Value | |
|---|---|---|---|
| Differences in distances between landmarks (mm) | |||
| CSO-LMA | 9.3 (3.6–12.9) | 11.2 (8.5–14.6) | 0.54 |
| CSO-Apex | 9.8 (8.3–15.9) | 6.9 (3.3–12.7) | 0.18 |
| LMA-Apex | 4.5 (2.0–10.9) | 14.6 (4.0–23.0) | 0.54 |
| All landmark pairs | 8.8 (3.6–15.9) | 9.5 (4.5–15.8) | 0.75 |
| Difference in predicted LV lead position and actual lead position (mm) | 11.3 (9.2–14.6) | – | N/A |
Distances are described as median (IQR) and compared using Wilcoxon tests.
CSO = coronary sinus os; LMA = lateral mitral annulus.
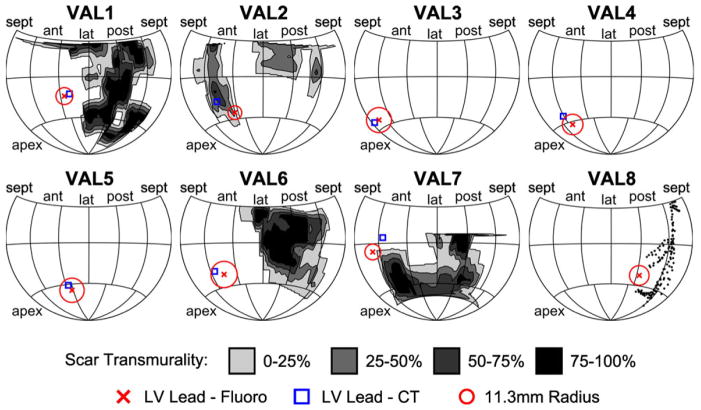
In the seven patients with lead position validated based on postoperative CT scans, we were able to track the course of the lead on the 3D CT images as shown in Figure 5(A). In most patients, the difference between the predicted location of the LV lead using the algorithm and the actual location of the lead as determined from the CT images was less than 15 mm, as shown in Table II. Figure 5 shows an example case, in which the lead placement error was within 6 mm. The registration method was also validated in one patient with preprocedure CMR CS venography. The LV lead was implanted in a branch of the middle cardiac vein that was clearly identified on CMR coronary sinus venography, and the distance from the predicted LV lead position to the middle cardiac vein branch that received the lead (as seen precisely on the CMR venography) was 13.3 mm (Table I). For all cases, the median difference between the predicted lead position and actual lead position was 11.3 mm (IQR 9.2–14.6 mm).
Figure 5.
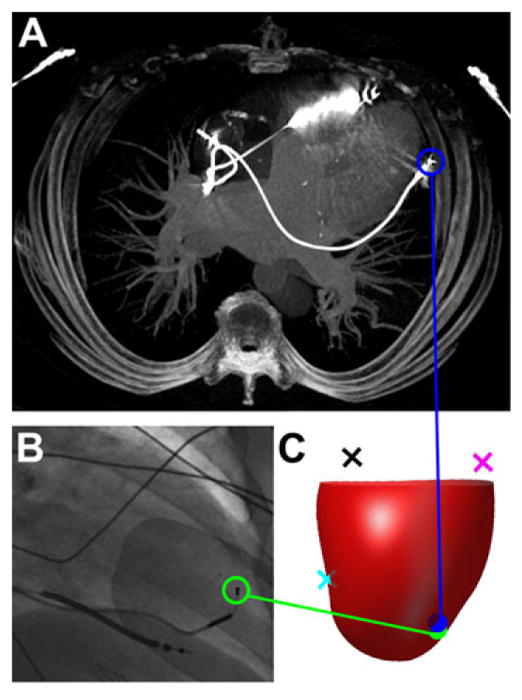
Validation of lead localization algorithm based on cardiac computed tomography. The actual location based on CT imaging of the final LV lead position is shown (A) and compared with the fluoroscopic image of the final LV lead position (B) for a typical validation subject. An anterior view of a 3D integrated map shows the epicardium (red surface) with the RVA (cyan), LMA (magenta), and CSO (black) landmarks (C). The predicted location of the LV lead (green) using the algorithm is very close compared with the lead position in CT (blue). CSO = coronary sinus os; CT = computed tomography; LMA = lateral mitral annulus; LV = left ventricular; RVA = right ventricular apex.
These validation cases are summarized in Figure 6 in which the predicted lead position and CT lead position is displayed on a Hammer map of the LV surface. The Hammer maps also show a circle of radius 11.3 mm, the median coregistration error surrounding the LV lead position, and the location and transmurality of scar measured from CMR. The circles occupy different fractions of the map surface due to the differences in heart size among patients.
Figure 6.
Maps of predicted and actual lead locations for eight validation group patients. Hammer maps of the predicted and actual lead position are shown for all eight patients in the validation group. The location of scar segmented from enhanced CMR images is shaded by scar transmurality. The predicted LV lead position (red X) is displayed as the center of a circle with radius 11.3 mm, the median coregistration error measured in the validation group. This predicted location is near the lead position measured from CT (blue square, VAL1-VAL7) and the MCV manually segmented from CMR venogram (VAL8). CT = computed tomography; CMR = cardiac magnetic resonance; LV = left ventricular; MCV = middle cardiac vein.
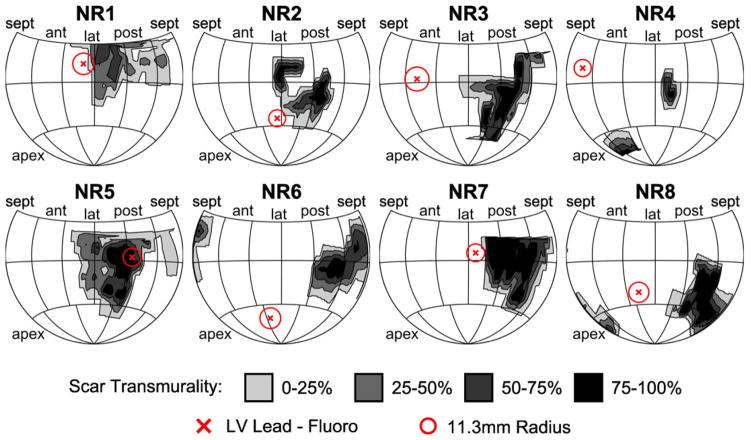
In the application group of eight patients with CRT nonresponse, infarction-related scar had a posterolateral location in 25% and an anterolateral location in 75%. As shown in Table I, the median percent scar volume was 6.5% (IQR 5.4–8.5%). As shown in Table II and Figure 7, overall landmark accuracy was similar to patients in the validation group. By integrating the lead maps and scar maps, we were able to produce highly detailed maps showing scar distribution with differences in transmurality, lead location, and the expected error based on the data from the validation group patients (Fig. 7). The lead mapped to the scar periphery in three patients (37.5%), the core of the scar in one patient (12.5%), and more than 3 cm from scar in four patients (50%).
Figure 7.
Maps of lead position relative to scar in eight nonresponder patients. Hammer maps of myocardial scar for eight application group patients are shown, with the predicted LV lead position (red X) displayed as the center of a circle with radius 11.3 mm, the median coregistration error measured in the validation group. The lead mapped to the periphery of the scar in three patients, to the core of the scar in one patient, and outside the scar in four patients. LV = left ventricular.
Discussion
Advantages of Coregistration Method
The remarkable features of this method for fluoroscopic and CMR coregistration for LV lead position are: (1) identification of 3D lead position within 1–2 cm of the actual lead position based on validation with three different methods (direct pathologic evaluation in a canine, postoperative CT, and CMR venography), (2) wide applicability to any CRT procedure as long as fluoroscopic images in just two views are saved, (3) no requirement for additional expensive mapping equipment during the procedure, and (4) no need for the radiation exposure, contrast, and expense associated with CT scans.
Clinical Implications
CRT can result in major clinical improvements and longer expected survival in appropriately selected patients with heart failure, but there is a persistent nonresponse or suboptimal response rate ranging typically from 35% to 50% depending on the criteria used and the patient population. Lead position has been shown to be an important determinant of CRT response,15 and CMR is an ideal imaging modality to inform optimal lead placement relative to scar and regional mechanical activation. In the CRT nonresponder with prior myocardial infarction, it is critical to determine whether proximity of LV lead position to scar is the cause of the poor response because another lead position can usually be achieved either with a surgical epicardial approach or a repeat endocardial implant procedure.
At the present time, most CRT procedures are performed using standard fluoroscopy rather than navigation using advanced 3D mapping systems. If the patient has had a CMR prior to implant, our methodology enables CMR-based assessment of scar and mechanical activation at the lead implant site. This may influence whether patients who do not respond to CRT are referred for reimplantation of the LV lead in another CS branch, surgical epicardial lead placement, or evaluation for other advanced heart failure therapies such as an LV assist device or heart transplantation. Importantly, this study shows that the lead position can be identified relative to a detailed scar map including degrees of transmurality based on CMR, and that CRT nonresponse in patients with infarction-related scar may or may not be associated with proximity of the lead position to scar.
Although this study focused on validation in one specific application, this coregistration method may be applied in a number of situations in the future. In addition to serving as the standard for myocardial anatomy and function, CMR also can generate highly accurate assessments of regional mechanical activation based on regional circumferential strain curves. As a result, lead position could be measured in relation to both scar and regional mechanical activation using this method. Although we performed coregistration after the CRT procedure in this study, this technique could also be applied during the CRT procedure to guide the optimal implantation site to avoid scar and target late activation. This would require software for real-time image analysis during the procedure, based on the algorithm described here. In this way, the methodology could be used not only for assessment of CRT nonresponse after the procedure, but also as an intraprocedural tool to assist operators in finding the optimal lead implantation sites during the procedure in order to improve CRT response rates.
Design of Coregistration Method
Fluoroscopic imaging during cardiac catheter-based interventions provides excellent visualization of implanted devices and coronary anatomy, but poor visualization of soft tissues. CMR, on the other hand, shows soft tissues with excellent resolution but cannot be performed after device implantation at the present time. Registration between these modalities provides complementary information but is especially difficult for cardiac applications because identifying fluoroscopic anatomic landmarks in two views can be challenging, and cardiac and respiratory motion make external markers prone to error. Other approaches for integrating fluoroscopic and cardiac imaging require specialized hardware with 3D fluoroscopic navigation software,12,13,19,20 and there is limited experience with these techniques for use during the CRT procedure. These methods generally require specialized equipment that is costly and not available in most electrophysiology labs. Even when available, they add time to the procedure and are not routinely used in every patient.
Our methodology requires only a preprocedure CMR study, the acquisition of two fluoroscopic images at the same table position at the end of the implantation procedure, and a record of procedure SID and TH. With this information, our algorithm achieves successful coregistration based on the principle of achieving similar distances between lead position and landmarks on fluoroscopy and CMR. As shown in the scar maps of the nonresponders, the median coregistration error of 11.3 mm is adequate to answer the clinical question of whether the LV lead is located in an area of infarction-related scar, while requiring much less time, cost, and expertise.
Limitations and Sources of Error
The study was designed as a validation study for this method for identification of lead position relative to infarction-related scar defined by CMR, with application to a modest number of CRT nonresponders with infarction-related scar. As such, it was not intended to be a large study of all factors influencing CRT response, although this methodology will be useful for future studies with this intention. Coregistration errors were due to errors both in landmark selection and validating the LV lead position. Landmark selection from fluoroscopic images was limited by the visibility of soft tissues and the cardiac anatomy. However, interobserver variability was kept low (4.2 mm mean difference for all landmarks) by using the LV and RV leads and venogram images to inform fluoroscopic landmark selection. Although the landmarks were more visible in CMR images, most images were acquired with a slice thickness of 7–8 mm. In patients with CT validation, we may have underestimated the accuracy of the method because of the decreased through-plane resolution of CMR relative to CCT, as well as cardiac remodeling that may have occurred between the time of the procedure and the validation CT scan.
Conclusions
The method presented here permits accurate determination of LV lead position in 3D CMR coordinates based on just two 2D fluoroscopic views from a standard fluoroscopic suite and a one-time calibration of that suite. The method enables assessment of LV lead location relative to myocardial characteristics (scar and mechanical activation) identified on a preprocedure magnetic resonance imaging without the need for additional equipment during the procedure or the cost, radiation exposure, and contrast associated with a postoperative CT scan. The ability to project procedural fluoroscopic LV lead position onto pre-CRT CMR or CT imaging, enabling quantitative assessment of LV lead position relative to scar and regional function, has important clinical implications for the CRT nonresponder with infarction-related scar.
Acknowledgments
This work was supported by NIH grants K23 HL094761 (KCB) and R01 HL085160 (JWH).
References
- 1.Bristow MR, Saxon LA, Boehmer J, Krueger S, Kass DA, De Marco T, Carson P, et al. Cardiac-resynchronization therapy with or without an implantable defibrillator in advanced chronic heart failure. N Engl J Med. 2004;350:2140–2150. doi: 10.1056/NEJMoa032423. [DOI] [PubMed] [Google Scholar]
- 2.Cleland JGF, Daubert J-C, Erdmann E, Freemantle N, Gras D, Kappenberger L, Tavazzi L. The effect of cardiac resynchronization on morbidity and mortality in heart failure. N Engl J Med. 2005;352:1539–1549. doi: 10.1056/NEJMoa050496. [DOI] [PubMed] [Google Scholar]
- 3.Chung ES, Leon AR, Tavazzi L, Sun J-P, Nihoyannopoulos P, Merlino J, Abraham WT, et al. Results of the Predictors of Response to CRT (PROSPECT) trial. Circulation. 2008;117:2608–2616. doi: 10.1161/CIRCULATIONAHA.107.743120. [DOI] [PubMed] [Google Scholar]
- 4.Helm RH, Byrne M, Helm PA, Daya SK, Osman NF, Tunin R, Halperin HR, et al. Three-dimensional mapping of optimal left ventricular pacing site for cardiac resynchronization. Circulation. 2007;115:953–961. doi: 10.1161/CIRCULATIONAHA.106.643718. [DOI] [PubMed] [Google Scholar]
- 5.Singh JP, Klein HU, Huang DT, Reek S, Kuniss M, Quesada A, Barsheshet A, et al. Left ventricular lead position and clinical outcome in the multicenter automatic defibrillator implantation trial-cardiac resynchronization therapy (MADIT-CRT) trial. Circulation. 2011;123:1159–1166. doi: 10.1161/CIRCULATIONAHA.110.000646. [DOI] [PubMed] [Google Scholar]
- 6.Spragg DD, Dong J, Fetics BJ, Helm R, Marine JE, Cheng A, Henrikson CA, et al. Optimal left ventricular endocardial pacing sites for cardiac resynchronization therapy in patients with ischemic cardiomyopathy. J Am Coll Cardiol. 2010;56:774–781. doi: 10.1016/j.jacc.2010.06.014. [DOI] [PubMed] [Google Scholar]
- 7.Derval N, Steendijk P, Gula LJ, Deplagne A, Laborderie J, Sacher F, Knecht S, et al. Optimizing hemodynamics in heart failure patients by systematic screening of left ventricular pacing sites: The lateral left ventricular wall and the coronary sinus are rarely the best sites. J Am Coll Cardiol. 2010;55:566–575. doi: 10.1016/j.jacc.2009.08.045. [DOI] [PubMed] [Google Scholar]
- 8.Ypenburg C, Roes SD, Bleeker GB, Kaandorp TA, de Roos A, Schalij MJ, van der Wall EE, et al. Effect of total scar burden on contrast-enhanced magnetic resonance imaging on response to cardiac resynchronization therapy. Am J Cardiol. 2007;99:657–660. doi: 10.1016/j.amjcard.2006.09.115. [DOI] [PubMed] [Google Scholar]
- 9.White JA, Yee R, Yuan X, Krahn A, Skanes A, Parker M, Klein G, et al. Delayed enhancement magnetic resonance imaging predicts response to cardiac resynchronization therapy in patients with intraventricular dyssynchrony. J Am Coll Cardiol. 2006;48:1953–1960. doi: 10.1016/j.jacc.2006.07.046. [DOI] [PubMed] [Google Scholar]
- 10.Bleeker GB, Schalij MJ, Van Der Wall EE, Bax JJ. Postero-lateral scar tissue resulting in non-response to cardiac resynchronization therapy. J Cardiovasc Electrophysiol. 2006;17:899–901. doi: 10.1111/j.1540-8167.2006.00499.x. [DOI] [PubMed] [Google Scholar]
- 11.Chalil S, Stegemann B, Muhyaldeen S, Khadjooi K, Foley P, Smith R, Leyva F. Effect of posterolateral left ventricular scar on mortality and morbidity following cardiac resynchronization therapy. Pacing Clin Electrophysiol. 2007;30:1201–1209. doi: 10.1111/j.1540-8159.2007.00841.x. [DOI] [PubMed] [Google Scholar]
- 12.Rhode KS, Sermesant M, Brogan D, Hegde S, Hipwell J, Lambiase P, Rosenthal E, et al. A system for real-time XMR guided cardiovascular intervention. IEEE Trans Med Imaging. 2005;24:1428–1440. doi: 10.1109/TMI.2005.856731. [DOI] [PubMed] [Google Scholar]
- 13.Duckett SG, Ginks MR, Knowles BR, Ma Y, Shetty A, Bostock J, Cooklin M, et al. Advanced image fusion to overlay coronary sinus anatomy with real-time fluoroscopy to facilitate left ventricular lead implantation in CRT. Pacing Clin Electrophysiol. 2011;34:226–234. doi: 10.1111/j.1540-8159.2010.02940.x. [DOI] [PubMed] [Google Scholar]
- 14.Albertsen AE, Nielsen JC, Pedersen AK, Hansen PS, Jensen HK, Mortensen PT. Left ventricular lead performance in cardiac resynchronization therapy: Impact of lead localization and complications. Pacing Clin Electrophysiol. 2005;28:483–488. doi: 10.1111/j.1540-8159.2005.40066.x. [DOI] [PubMed] [Google Scholar]
- 15.Ypenburg C, van Bommel RJ, Delgado V, Mollema SA, Bleeker GB, Boersma E, Schalij MJ, et al. Optimal left ventricular lead position predicts reverse remodeling and survival after cardiac resynchronization therapy. J Am Coll Cardiol. 2008;52:1402–1409. doi: 10.1016/j.jacc.2008.06.046. [DOI] [PubMed] [Google Scholar]
- 16.MacKay SA, Potel MJ, Rubin JM. Graphics methods for tracking three-dimensional heart wall motion. Comput Biomed Res. 1982;15:455–473. doi: 10.1016/0010-4809(82)90027-1. [DOI] [PubMed] [Google Scholar]
- 17.Heiberg E, Sjögren J, Ugander M, Carlsson M, Engblom H, Arheden H. Design and validation of segment—freely available software for cardiovascular image analysis. BMC Med Imaging. 2010;10:1–13. doi: 10.1186/1471-2342-10-1. [DOI] [PMC free article] [PubMed] [Google Scholar]
- 18.Herz SL, Ingrassia CM, Homma S, Costa KD, Holmes JW. Parameterization of left ventricular wall motion for detection of regional ischemia. Ann Biomed Eng. 2005;33:912–919. doi: 10.1007/s10439-005-3312-7. [DOI] [PubMed] [Google Scholar]
- 19.Rhode KS, Hill DLG, Edwards PJ, Hipwell J, Rueckert D, Sanchez-Ortiz G, Hegde S, et al. Registration and tracking to integrate X-ray and MR images in an XMR facility. IEEE Trans Med Imaging. 2003;22:1369–1378. doi: 10.1109/TMI.2003.819275. [DOI] [PubMed] [Google Scholar]
- 20.Ector J, De Buck S, Huybrechts W, Nuyens D, Dymarkowski S, Bogaert J, Maes F, et al. Biplane three-dimensional augmented fluoroscopy as single navigation tool for ablation of atrial fibrillation: Accuracy and clinical value. Heart Rhythm. 2008;5:957–964. doi: 10.1016/j.hrthm.2008.03.024. [DOI] [PubMed] [Google Scholar]


