

Abstract
Objectives
Lacunes are an important disease feature of cerebral small vessel disease (SVD) but their relationship to cognitive impairment is not fully understood. To investigate this we determined (1) the relationship between lacune count and total lacune volume with cognition, (2) the spatial distribution of lacunes and the cognitive impact of lacune location, and (3) the whole brain anatomical covariance associated with these strategically located regions of lacune damage.
Methods
One hundred and twenty one patients with symptomatic lacunar stroke and radiological leukoaraiosis were recruited and multimodal MRI and neuropsychological data acquired. Lacunes were mapped semi-automatically and their volume calculated. Lacune location was automatically determined by projection onto atlases, including an atlas which segments the thalamus based on its connectivity to the cortex. Lacune locations were correlated with neuropsychological results. Voxel based morphometry was used to create anatomical covariance maps for these ‘strategic’ regions.
Results
Lacune number and lacune volume were positively associated with worse executive function (number p < 0.001; volume p < 0.001) and processing speed (number p < 0.001; volume p < 0.001). Thalamic lacunes, particularly those in regions with connectivity to the prefrontal cortex, were associated with impaired processing speed (Bonferroni corrected p = 0.016). Regions of associated anatomical covariance included the medial prefrontal, orbitofrontal, anterior insular cortex and the striatum.
Conclusion
Lacunes are important predictors of cognitive impairment in SVD. We highlight the importance of spatial distribution, particularly of anteromedial thalamic lacunes which are associated with impaired information processing speed and may mediate cognitive impairment via disruption of connectivity to the prefrontal cortex.
Keywords: Small vessel disease, Lacunes, Cognitive Impairment
Highlights
-
•
Lacunes are a predictor of cognitive impairment in cerebral small vessel disease
-
•
Lacunes in the anteromedial thalamus are associated with impaired processing speed
-
•
This region was identified to have connectivity to the prefrontal cortex
-
•
We validate this finding with the help of a structural covariance analysis
1. Introduction
Cerebral small vessel disease (SVD) is the major cause of vascular cognitive impairment in the elderly (Pantoni, 2010) producing a characteristic cognitive profile which includes reduced information processing speed and executive dysfunction, but relatively preserved episodic memory (Charlton et al., 2006). SVD is thought to impair cognition by disrupting the efficiency of white matter pathways that connect the networks that underlie cognitive processes (O'Sullivan et al., 2004). Magnetic resonance imaging (MRI) is essential to diagnosis and a useful tool to investigate the mechanisms of cognitive impairment in SVD. A number of MRI markers of cognitive impairment in SVD have been proposed, of which T2 white matter hyperintensities (WMH) and lacunes (3–15 mm CSF filled cavities of presumed vascular origin) are best described (Wardlaw et al., 2013). Here we focus on lacunes and the mechanisms by which they lead to cognitive impairment in SVD.
Lacune number has been associated with cognitive impairment in some studies in SVD (Gold et al., 2005; Visvanathan et al., 2007; Lee et al., 2011), but not in others (Nitkunan et al., 2008). However lacunes vary in size and the relationship might be stronger with total lacune volume. This has been suggested in CADASIL (Cerebral Autosomal-Dominant Arteriopathy with Subcortical Infarcts and Leukoencephalopathy), a young-onset genetic form of SVD (Viswanathan et al., 2007), but not yet examined in sporadic SVD. We investigate the relationship between both lacune count and total lacune volume with cognition in sporadic SVD and assess whether any associations are independent of other pathological markers of SVD determined from MRI.
The impact of lacunes on cognition is likely to depend not only on their total load but also on their location. Thalamic lacunes in particular have been associated with cognitive impairment in SVD (Benisty et al., 2009) and CADASIL (Duering et al., 2011). The thalamus is a complex structure with multiple subcomponents possessing unique architecture and connectional properties. Previous studies using probabilistic tractography in human brains have showed that the thalamus can be segmented into distinct subregions based on cortical connectivity patterns that correspond to thalamic nuclei described in histological studies (Behrens et al., 2003). In view of this we investigate the spatial distribution of lacunes to define the specific cognitive impact of strategically located lacunes, particularly those in the thalamus using a thalamic atlas based on its connectivity to the cerebral cortex (Johansen-Berg et al., 2005). Guided by the results of our lacune spatial analysis, we identify a region of interest (ROI) within the thalamus. We then use voxel based morphometry (VBM) to investigate whether there are any significant associations between this ROI and other brain regions. This technique, termed anatomical (or structural) covariance, has previously been used to show that regions that are structurally or functionally related ‘covary’ in grey matter (GM) density (Alexander-Bloch et al., 2013; Soriano-Mas et al., 2013). Determining ‘strategic’ lacune locations within the thalamus may improve our understanding of the disconnected cortical–subcortical pathways underlying cognitive impairment in SVD.
2. Methods
2.1. Patients
Patients with SVD were recruited as part of the prospective St George's Cognition and Neuroimaging in Stroke (SCANS) study (Lawrence et al., 2013). For this analysis data from the SCANS baseline assessment was used. Patients were recruited between March 2007 and October 2010 from the inpatient and outpatient stroke services of three hospitals covering a geographically contiguous area of South London (St George's, King's College and St Thomas' Hospitals). Inclusion criteria comprised a clinical lacunar stroke syndrome (Bamford et al., 1987) with an anatomically corresponding lacunar infarct on MRI in addition to confluent white matter hyperintensities (WMH) on MRI (Fazekas grade 2 or higher, Fazekas et al., 1993). Exclusion criteria were as follows: any cause of stroke mechanism other than SVD (e.g., cardioembolic source or extra- or intra-cerebral artery stenosis of >50%), other major central nervous system disorders, major psychiatric disorders, any other cause of white matter disease, contraindications to MRI, or non-fluent in English. The study was approved by the local ethics committee and all patients gave written informed consent. MRI acquisitions and cognitive assessments were performed at least 3 months after the last stroke to exclude acute effects on cognition. Imaging was performed at a median of 7 months after their symptomatic stroke (minimum: 3 months, maximum: 36 years). 59% of patients were scanned within 12 months of their index stroke. All patients were also screened for cardiovascular risk factors including hypertension (defined as systolic blood pressure > 140 mm Hg or diastolic > 90 mm Hg or treatment with antihypertensive drugs), hypercholesterolaemia (defined as a serum total cholesterol > 5.2 mmol/l or treatment with a statin), diabetes mellitus and smoking.
2.2. Magnetic resonance imaging acquisition
Images were acquired on a 1.5 T Signa HDxt scanner (General Electric, Milwaukee, WI, USA) with maximum gradient amplitude of 33 mTm-1 and a proprietary head coil. All image sequences were acquired across the whole brain and total imaging time was approximately 45 min. Patients were placed in the head coil in a neutral position with an alignment marker at the nasal bridge to standardise head position. Minimal movement was ensured by use of foam pads and a Velcro strap across the forehead.
The imaging protocol included the following: (1) Fluid Attenuated Inversion Recovery (FLAIR) sequence — TR/TE/TI = 9000/130/2200 ms, field-of-view (FOV) = 240 × 240 mm2, matrix = 256 × 192, 28 axial slices of 5 mm thickness and (2) spoiled gradient echo recalled T1-weighted (SPGR) 3D coronal sequence — TR/TE = 11.5/5 ms, FOV = 240 × 240 mm2, matrix = 256 × 192, flip angle = 18°, 176 coronal slices of 1.1 mm thickness reconstructed to an in plane resolution of 1.1 mm.
2.3. Structural image pre-processing
Structural image preprocessing was performed to compute accurate deformation field maps to align T1-weighted volume images to a group-average template generated from the data cohort used in this study. The preprocessing also involves computation of Tissue Probability Maps (TPMs) for grey matter (GM), white matter (WM), cerebrospinal fluid (CSF) and white matter hyperintensities (WMH) to increase tissue segmentation accuracy across the cohort. T1-weighted images were segmented using New Segment in SPM12 into isotropic (1 mm3 voxel resolution) GM, WM and CSF tissue classes. These were used to estimate deformations to a group-average template generated from the data cohort using the Shoot toolbox in SPM12 (Ashburner and Friston, 2011). The T1-weighted and FLAIR images were skull-stripped using the segmentations at a threshold of 0.1 and warped to the group-average template. These were used to create population specific TPMs using a modified multivariate mixture of Gaussians (mMoG) (Lambert et al., 2013). This was performed to increase segmentation accuracy across the cohort, and provide TPMs for WMH from the FLAIR and T1 weighted images, allowing automatic segmentation at an individual level. It is necessary to note that GM FLAIR hyperintensities were not segmented using this technique. Instead, these would have been included in the GM tissue class, and were not analysed. Three population specific TPMs for GM, WM and CSF were created using the warped T1-weighted images, and a WMH lesion TPM was created from T1-weighted and FLAIR images. The default SPM TPMs were replaced by the population specific TPMs and New Segment was re-run on the native space images to generate improved segmentation maps for GM, WM and CSF, and a WMH segmentation map for each individual. These WMH segmentation maps were binarised at a threshold set for each individual by checking results manually to ensure accurate correspondence with lesions on the FLAIR image. Results were manually refined where necessary to optimise accuracy.
An additional step was performed to repair the segmentations for regions of tissue damage. This was motivated by the observation that regions affected by pathology are frequently misclassified during routine segmentation. For example, regions of gliosis are misclassified as CSF and regions of WMH as GM leading to erroneous deformation estimations and subsequent inaccuracies in estimating warps to the group-average space. For this reason, WMH regions were automatically reclassified as WM and any erroneously classified tissue was removed from the GM and CSF segmentation maps. Regions with lacunes were also corrected using the most likely tissue type for each voxel derived from the population TPMs. All images were visually inspected for quality.
All corrected tissue segmentations (including GM, WM and CSF) were registered to the common group-average isotropic (1 mm3 voxel resolution) template using a diffeomorphic registration algorithm (Shoot toolbox in SPM 12, Ashburner and Friston, 2011), producing a deformation field for each individual to the group-average space.
2.4. Lacune volume
Lacunes were identified in native subject space by a consultant neuroradiologist, utilising a multimodality view with T1-weighted, T2-weighted and FLAIR images. A lacune was defined as a CSF filled cavity, 3–15 mm in diameter with a surrounding rim of FLAIR hyperintensity (Wardlaw et al., 2013). Cavity size thresholds were chosen as lesions that are less than 3 mm in diameter are more likely to be perivascular spaces than lacunes and cavities greater than 15 mm are less likely to reflect an underlying small vessel disease aetiology (Wardlaw et al., 2013).
To extract lacune regions, the centre voxel of each lacune was identified (on T1-weighted images) and an in-house 6-neighbourhood connectivity region-growing algorithm was applied to delineate the extent of the lacune. For each subject this algorithm identified a threshold boundary for lacune edges (based on the signal intensities of all lacune voxels in each brain). Region growing was applied using an iterative dilation method and initiated at each central lacune voxel until algorithmic termination at the lacune edge. This technique provided binary lacune maps for each subject. Lacune maps were visually inspected and manually adjusted where this process did not perform optimally. Total lacune number (i.e. lacune count) and volume were calculated for each subject.
2.5. Lacune location
We identified the anatomical location of the already identified lacunes with respect to neuroanatomical atlases of (i) white matter (WM), (ii) subcortical, and (iii) thalamic structures. To achieve this, the previously calculated, population optimised deformation fields (see Section 2.3) were used to register the lacune maps to the group-average template to create a group-level lacune Tissue Probability Map (TPM). Anatomical atlases were used to define the lacune location. These are provided in MNI space, so first needed aligning with the group average space. This was done by registering the MNI-152 T1-weighted image provided with the FSL-package to the group average template using symmetric diffeomorphic non-linear registration (Advanced Normalisation Tools, ANTS; http://www.picsl.upenn.edu/ANTS/) (Avants et al., 2011), with parameters optimised for co-registration of T1-weighted images (Klein et al., 2009). The quality of the transformation was carefully inspected before these warps were applied to three standard atlases provided with the FSL package: 1) the label-based JHU DTI white-matter atlas (Mori et al., 2005), 2) the probabilistic Harvard–Oxford subcortical structural atlas (http://www.cma.mgh.harvard.edu/), and 3) the Oxford thalamic connectivity atlas (Behrens et al., 2003; Johansen-Berg et al., 2005). The Oxford thalamic connectivity atlas classifies the thalamus based on its maximal connectivity to seven principal cortical regions using probabilistic tractography, providing “Connectivity Defined Regions” (CDRs). To produce non-overlapping, well-defined thalamic CDRs, the atlas was thresholded at 25% based on the maximum-probability labels. At a threshold of 25%, this atlas has been shown to result in thalamic regions corresponding to the nuclei or nuclear groups described in previous histological studies (Johansen-Berg et al., 2005).
For each subject, the lacune volume in each atlas region was computed. The JHU white matter and thresholded thalamic connectivity atlas comprised binary mask images which allowed regional volumes to be calculated from overlap with lacune maps in standard space. For the probabilistic sub-cortical atlas, the sum of probabilities within the lacune voxels was used to calculate the number of equivalent whole lacune-voxels, from which the regional lacune volume was computed.
Overlaps between regions and lacunes were visually inspected. Lacune overlaps with a volume of less than 10 mm3 were not reliably visible within each region. Therefore, for each atlas region, if the lacune volume was: (a) less than 10 mm3 then the region was considered to contain no lacunes, but (b) greater than or equal to 10 mm3 then the atlas region was considered to contain one or more lacunes. This threshold ensured confidence in identified lacune locations and ensures that results are representative of a clinically feasible methodology.
2.6. Brain volume
Brain volume was estimated from T1-weighted images using the automated SIENAX program (Smith et al., 2002) (FMRIB software library, FSL v4.1; FMRIB analysis group, Oxford, UK; http://www.fmrib.ox.ac.uk/fsl). For each subject, extracted brain tissue and skull images were registered to a standard brain and skull geometry to obtain estimates of both brain volume and brain volume normalised with respect to skull size. Errors in tissue classification were manually corrected.
2.7. Lesion load
White matter hyperintensities on FLAIR were delineated by a single rater using the DISPUNC program (Grimaud et al., 1996; David Plummer, University College London, UK). Lesions >2 mm in diameter were included. Whole brain lesion maps were generated and lesion load calculated as a percentage of non-normalised brain volume.
2.8. Anatomical covariance analysis
Informed by the findings from the above lacunar spatial analysis, we performed a further analysis to characterise the anatomical covariance associated with the thalamic region of damage. Structural images were preprocessed for voxel based morphometry (VBM) analysis using Statistical Parametric Mapping software (SPM12, 2012, http://www.fil.ion.ucl.ac.uk/spm/software/spm12/) running under MATLAB (2010b) (Mathworks, Natick, MA, USA). Computed deformation fields (see Section 2.3) were used to warp the corrected GM and WM segmentation maps to the group-average template. The resulting images were modulated by multiplying the corresponding Jacobian determinants. Finally the images were smoothed using a 6 mm FWHM Gaussian kernel prior to statistical analysis. The preprocessing required for this analysis was optimised for our study population as described in Section 2.3.
2.8.1. Thalamic region of interest
Informed by the results of our initial lacunar spatial analysis (see Results section), only the prefrontal thalamic CDR from the Oxford thalamic connectivity atlas was used to create our thalamic region of interest. The regions of lacunes that overlapped with the prefrontal CDR were selected by multiplying the binarised CDR and lacune TPM images. The resulting map was binarised at 1% and used for further analysis as the pre-frontal lacunar region of interest (ROI). Prior to statistical analysis, the average modulated density of the prefrontal lacunar ROI was computed from the smoothed modulated images across all subjects.
2.9. Neuropsychological assessment
Cognitive assessment was carried out by a neuropsychologist within 2 weeks of the MRI scan. Well established standardised tests were chosen to include measures sensitive to the pattern of cognitive impairment associated with SVD. Premorbid IQ was estimated using the National Adult Reading Test — Restandardised (NART-R) (Nelson and Willison, 1991). Tasks were grouped into broad cognitive functions: executive function, processing speed, working memory, and long term (episodic) memory (Lawrence et al., 2013).
Executive function: Trail making test, (Reitan, 1955) Modified Wisconsin Card Sorting Test (Nagahama et al., 2003), Phonemic Fluency (FAS) (Delis et al., 2001).
Processing speed: Wechsler Adult Intelligence Scale-III (Wechsler, 1997a) Digit symbol substitution (Wechsler, 1997b), Speed of Information Processing Task (Coughlan et al., 2009), Grooved Pegboard Task (Matthews, 1964).
Working memory: Digit Span Task (Coughlan et al., 2009).
Long term (episodic) memory: Wechsler Memory Scale-III (Wechsler, 1997b) Logical Memory and Visual Reproduction.
Task performance was age scaled using manual published normative data, transformed into z-scores and aggregated to construct the cognitive indices by averaging across the component test measures for each subject. For further details on the cognitive assessment please refer to Lawrence et al. (2013).
The Geriatric Depression Scale (GDS) (Lesher and Berryhill, 1994) was used to screen for depressive symptoms and to measure approximate depression symptom levels.
2.10. Statistical analysis
Statistical analysis was performed using Statistical Package for Social Sciences version 20.0 (SPSS, Chicago, IL, USA) except for the anatomical covariance analysis (Section 2.10.3). Results were considered significant at p < 0.05 following Bonferroni adjustment for multiple comparisons. All analyses were corrected for age, gender and premorbid IQ. Lacune counts and lacune volumes were log10 transformed to improve the normality of distributions.
2.10.1. MRI parameters and cognition
Partial correlation was used to investigate the relationship between cognitive indices and lacune count, lacune volume, WMH volume and brain volume. Additional analyses further controlled for hypertension and for the geriatric depression score as previous studies have reported an association between these variables and cognitive impairment in SVD (Thomas and O'Brien, 2008; Birns and Kalra, 2009).
Multiple linear regression analysis was used to investigate whether measures of lacune load were associated with cognition. In the latter analysis we controlled for WMH volume and normalised brain volume.
2.10.2. Lacune location and cognition
Multiple linear regression models were used to investigate the association between lacune location and each cognitive index. A regional analysis was conducted for all atlas regions where at least 18 subjects were affected with a lacune. This threshold was chosen to strike a balance between statistical power and region coverage (see Supplementary Table S1). Statistical analyses were corrected for effects of age, gender, and premorbid IQ. A complete list of investigated atlas regions is provided in Supplementary materials S2, S3 and S4.
2.10.3. Anatomical covariance analysis
The prefrontal lacunar ROI (see Section 2.8.1) was used as the variable of interest in a multiple regression model in SPM12. Age, gender and total intracranial volume (TIV) were included as covariates. This technique identified the regions of GM or WM that positively or negatively correlated with the average GM density of the prefrontal lacunar ROI. Results were considered significant after Family-Wise Error (FWE) correction for multiple comparisons at p < 0.05.
3. Results
3.1. Patient demographics
One patient was excluded from this analysis because of excessive movement artefacts in T1-weighted images. The final sample size was 120. Demographics are shown in Table 1.
Table 1.
Patient demographics and mean MRI parameters. Hypertension was defined as systolic blood pressure > 140 mm Hg or diastolic > 90 mm Hg or those on antihypertensive treatment. Hypercholesterolaemia was defined as a serum total cholesterol > 5.2 mmol/l or treatment with a statin.
| Demographics and risk factors | N = 120 | |
|---|---|---|
| Mean age (SD) | 70 (9.8) | |
| Mini mental test score (mean (SD)) | 27.6 (2.7) | |
| Gender | Female | 42 (35.0%) |
| Male | 78 (65.0%) | |
| Hypertension | No | 9 (7.5%) |
| Yes | 111 (92.5%) | |
| Hypercholesterolaemia | No | 17 (14.2%) |
| Yes | 103 (85.8%) | |
| Smoker | Never | 55 (45.8%) |
| Current | 23 (19.2%) | |
| Ex-smoker | 42 (35.0%) | |
| Treated diabetes mellitus | Yes | 22 (18.3%) |
| No | 96 (80.0%) | |
| Untreated | 2 (1.6%) | |
| Rankin disability score | 0 | 38 |
| 1 | 48 | |
| 2 | 15 | |
| 3 | 16 | |
| 4 | 3 | |
| MRI measures at baseline (per subject) | ||
| ?????Mean (SD) number of lacunes | 4.18 (5.44) | |
| ?????Mean (SD) lacune load as % of total brain volume | 0.0754 (0.0979) | |
| ?????Mean (SD) WMH load as % of total normalised brain volume | 3.16 (2.63) | |
| ?????Mean (SD) normalised brain volume in ml | 1295.64 (91.29) | |
3.2. Lacune number and distribution
Cavitated lacunes were present in 99 (83%) of 120 subjects. While all patients had clinical lacunar stroke syndrome (with corresponding MRI lacunar infarction), not all lesions detected on acute diffusion weighted imaging subsequently cavitate on T1-weighted images (Loos et al., 2012). The anatomical location of lacunes with reference to the subcortical and white matter standard space atlases is shown in Fig. 1. Lacunes were most frequently identified within the thalamus (see Table 4). Lacune count was positively associated with WMH volume. The association remained significant after controlling for age and cardiovascular risk factors (r = 0.423, p < 0.001).
Fig. 1.
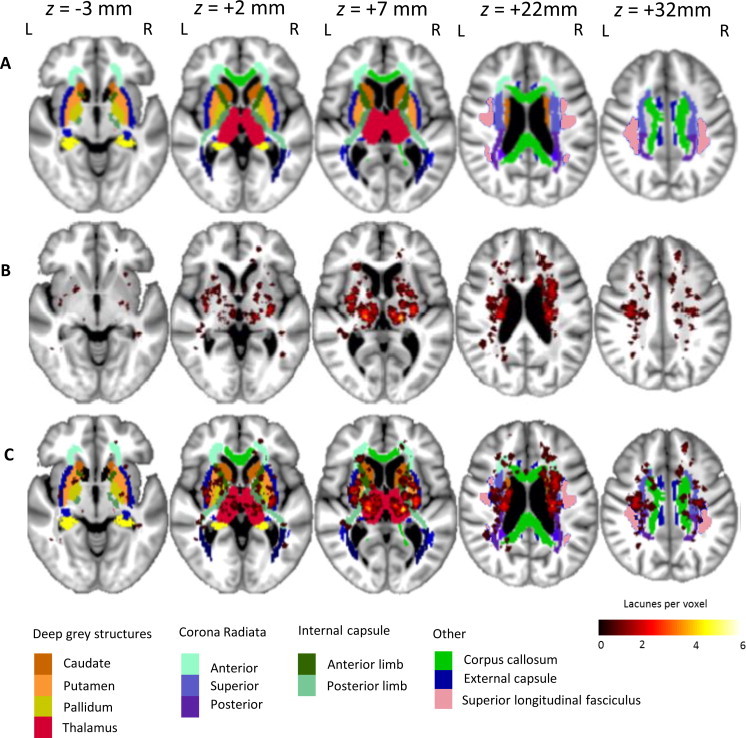
Lacune lesion location map showing spatial distribution throughout the brain. The map is superimposed onto the group-average T1-weighted 1 mm isotropic template and shown using the neurological viewing convention. Row A — atlas brain regions illustrating subcortical structures and white matter regions (standard atlases provided by the FSL package). A colour key to atlas regions is shown at the bottom of the figure. Row B — distribution of lacunes in MNI space. The colour bar at the bottom right indicates the number of lacunes present at each voxel. Row C — lacunes shown superimposed on atlas locations.
Table 4.
Spatial distribution of lacunes and associations with cognition (linear regression analysis controlling for age, gender and NART). (* represents regions that survived Bonferroni correction).
| Region | Number of subjects with lacunes (% of total sample) | Processing speed | Executive function | ||
|---|---|---|---|---|---|
| ß | Significance | ß | Significance | ||
| Subcortical grey matter | |||||
| ????Thalamus (whole) | 47 (39.2) | -0.259 | 0.001* | -0.142 | 0.047 |
| ????Putamen | 33 (27.5) | -0.116 | 0.153 | -0.104 | 0.151 |
| ????Caudate | 35 (29.2) | -0.080 | 0.314 | -0.140 | 0.049 |
| White matter structures | |||||
| ????Anterior limb of internal capsule | 28 (23.3) | -0.107 | 0.174 | -0.046 | 0.520 |
| ????Posterior limb of internal capsule | 28 (23.3) | -0.146 | 0.065 | -0.242 | 0.001 * |
| ????Anterior corona radiata | 18 (15.0) | -0.148 | 0.073 | -0.068 | 0.362 |
| ????Superior corona radiata | 39 (32.5) | -0.168 | 0.035 | -0.110 | 0.124 |
| ????Posterior corona radiata | 19 (15.8) | -0.115 | 0.145 | -0.181 | 0.010 |
| ????Superior longitudinal fasciculus | 21 (17.5) | -0.024 | 0.771 | -0.083 | 0.258 |
| ????External capsule | 32 (26.7) | -0.158 | 0.053 | -0.143 | 0.052 |
| Thalamic connectivity | |||||
| ????Prefrontal | 44 (36.7) | -0.225 | 0.004 * | -0.186 | 0.046 |
| ????Premotor | 23 (19.1) | -0.132 | 0.096 | -0.075 | 0.291 |
| ????Posterior parietal | 37 (30.8) | -0.190 | 0.016 | -0.108 | 0.127 |
| ????Temporal | 28 (23.3) | -0.204 | 0.011* | -0.174 | 0.016 |
3.3. Association of MRI parameters with cognition (Table 2)
Table 2.
Partial correlation between MRI parameters and cognition: R (p values) controlling for age, gender, and NART IQ.
| Executive function | Processing speed | Working memory | Episodic memory |
|
|---|---|---|---|---|
| Lacune count | -0.377 (0.001) | -0.430 (0.001) | -0.207 (0.028) | -0.189 (0.045) |
| Lacune volume | -0.310 (0.001) | -0.388 (0.001) | -0.236 (0.012) | -0.255 (0.006) |
| WMH volume | -0.104 (0.274) | -0.239 (0.011) | -0.082 (0.389) | -0.135 (0.153) |
| Brain volume | 0.328 (0.000) | 0.403 (0.000) | 0.285 (0.002) | 0.281 (0.003) |
Associations between MRI parameters and cognitive scores controlling for age, gender and premorbid IQ were strongest with executive function and processing speed. Lacune count and lacune volume showed negative associations of similar magnitude, although for lacune count the partial correlation coefficients were slightly greater. For lacune count and volume there were weaker associations with working and episodic memory. Brain volume was strongly associated with all cognitive domains. In contrast, associations between WMH volume and cognition were weaker. Additional analyses controlling for hypertension and depression did not affect the significance of our results.
The relationships of lacune count and lacune volume with executive function and processing speed remained significant after controlling for brain volume and WMH volume (Table 3).
Table 3.
Associations between lacune count, volume and cognition (multiple linear regression analysis controlling for age, gender, NART, brain volume and WMH volume).
| MRI parameters | Executive function | Processing speed | ||
|---|---|---|---|---|
| ß | Significance | ß | Significance | |
| Lacune count | -0.222 | 0.005 | -0.261 | 0.002 |
| Lacune volume | -0.172 | 0.031 | -0.228 | 0.006 |
3.4. Associations between lacune location and cognition
Regional analysis was performed on the following regions: subcortical grey matter regions which included the caudate, thalamus and putamen and white matter regions which included the internal capsule, external capsule, superior longitudinal fasciculus, and anterior, superior and posterior corona radiata. Thalamic CDRs included the prefrontal, premotor, temporal, primary motor and posterior parietal cortex CDRs (Fig. 2).
Fig. 2.

Oxford thalamic connectivity probability atlas superimposed on to group-average T1-weighted 1 mm isotropic template and shown using the neurological viewing convention. The colour key at the bottom of the figure represents the classification of thalamic voxels according to the cortical region with which they are connected with highest probability. Row A — thalamic regions according to the cortical region with which they are connected with highest probability. The colour key at the right of the figure represents this classification. Row B — lacunes shown superimposed on thalamic atlas locations. The colour bar on the right indicates number of lacunes present at each voxel. Row C — axial thalamic section from a cytoarchitectonic atlas (Morel et al., 1997). The nuclei have been coloured according to their major cortical connection site.
In subcortical GM, thalamic lacunes were associated with impaired processing speed (Table 4; p < 0.001), in WM regions, there were associations between lacunes in the superior corona radiata and impaired processing speed (p < 0.035), and between lacunes in the posterior internal capsule and impaired executive function (p < 0.001). The association between thalamic lacunes and impaired processing speed survived Bonferroni correction (n = 9, corrected p = 0.027; Table 4).
The relationship between thalamic connections to specific cortical regions and impaired processing speed was further explored (Fig. 2 and Table 4). Associations were present between impaired processing speed and lacunes in the thalamic CDRs with connections to the prefrontal cortex (p < 0.004), posterior parietal cortex (p < 0.016), and temporal cortex (p < 0.011). The association for lacunes in the thalamic CDR with connections to the prefrontal cortex survived Bonferroni correction for multiple comparisons (n = 4, corrected p = 0.016). In order to confirm this we performed a supplementary step by step ascending multiple regression analysis where only the association with the prefrontal CDR and processing speed remained significant. This localised finding motivated the following VBM analysis.
3.5. Anatomical covariance: grey matter
Several grey matter regions positively correlated with the average density of the prefrontal lacunar ROI (Fig. 3) which was within the prefrontal thalamic CDR. Subcortically, these included the entire thalamus, caudate, putamen and globus pallidus. Bilateral cortical associations were found in the orbitofrontal cortex, the medial prefrontal cortex, the dorsoanterior insular cortex, the parieto-occipital junction and the cuneus. No significant negative correlates were found.
Fig. 3.

VBM analysis showing anatomical covariance maps of grey matter regions that positively co-varied with the prefrontal lacunar ROI average grey matter density. Statistical maps are shown superimposed on to the common group-average 1 mm isotropic template. The colour bar represents the t-statistic. Images are displayed in axial (row 1), sagittal (row 2) and coronal (row 3) orientations using the neurological viewing convention.
3.6. Anatomical covariance: white matter
Predominately anterior white matter regions positively co-varied with the average density of the prefrontal lacunar ROI (Fig. 4). These included the anterior thalamic radiation, the anterior and superior corona radiata, the genu and body of the corpus callosum and the internal capsule. No significant negative correlates were found.
Fig. 4.

VBM analysis showing anatomical covariance maps of white matter regions that positively co-varied with prefrontal lacunar ROI average grey matter density. Statistical maps are shown superimposed on to the common group-average 1 mm isotropic template. The colour bar represents the t-statistic. Images are displayed in axial (row 1), sagittal (row 2) and coronal (row 3) orientations using the neurological viewing convention.
4. Discussion
Our results show that both the number and the volume of lacunes are independent predictors of impaired processing speed and executive function in symptomatic small vessel disease. We have shown that lacunes in the thalamus are independently associated with the processing speed deficits. These were further characterised using Oxford's thalamic connectivity atlas (Johansen-Berg et al., 2005), identifying the region with high connectivity to the prefrontal cortex, located in the anteromedial thalamus, as significant. We provided support for this finding by examining the anatomical covariance associated with the lacunar ROI within this region, demonstrating significant regions predominately in the prefrontal, orbitofrontal and anterior insula cortex.
Previous studies have suggested an association between lacunes and impaired cognition (Vermeer et al., 2007), but none so far have shown this in sporadic symptomatic small vessel disease. The Leukoaraiosis and Disability (LADIS) study, which included patients with leukoaraiosis from different clinical settings, reported that lacune count predicted worse executive function (Benisty et al., 2009). These results are in agreement with postmortem data (Gold et al., 2005). In CADASIL the number of lacunes was found to be the most significant MRI parameter associated with cognitive impairment (Lee et al., 2011). However not all studies have shown such associations, including one study in patients with symptomatic lacunar infarction (Nitkunan et al., 2008). Our data suggest that lacunes are an important predictor of cognitive impairment in sporadic symptomatic SVD, in a similar fashion to their role in the genetic form of the disease CADASIL. One previous study in CADASIL found that total lacune volume was more strongly associated with cognition than lacune number (Visvanathan et al., 2007). However, we found no significant difference between the two parameters in sporadic SVD; indeed associations with executive function and processing speed tended to be stronger for lacune count. In contrast we found weak or absent associations between WMH lesion volume and cognition. This may be because high signal on T2-weighted imaging fails to distinguish between minor and severe white matter damage. It is also possible that by selecting patients with confluent WMH in our inclusion criteria we have limited the range of WMH volume values and this could have reduced the power to detect a relationship between WMH and cognition. However, despite this inclusion criterion there was a wide range of WMH volumes from 0.145 to 12.6% of total brain volume.
Differences between the results of previous studies correlating MRI parameters with cognition may also reflect the concept that SVD may have multiple pathologies. It has been suggested that there are at least two distinct pathologies underlying SVD; microatheroma causing larger, usually isolated lacunar infarcts and a diffuse arteriopathy characterised by lipohyalinosis associated with multiple smaller lacunar infarcts and leukoaraiosis (Fisher, 1968; Boiten et al., 1996). This distinction is supported by pathological, radiological and risk factor data (Khan et al., 2007). In view of these possible differences and to study a homogeneous group of patients we recruited only patients with symptomatic lacunar infarction confirmed on MRI as well as confluent WMH. We feel this allows a more robust determination of the effect of lacunes in a population where the cause of both WMH and cognitive impairment is likely to be ischaemic. We recognise that this may limit the generalisability of the findings. However the findings remain relevant to a large number of stroke patients — about 20–25% of all ischaemic stroke is lacunar due to SVD and of these cases about half fall into the category of lacunar stroke and WMH.
The cognitive impairment in SVD associated with lacunes may well be due to damage to cortical–subcortical pathways, disrupting the complex and distributed networks that underpin processes such as executive function and information processing (Bressler and Menon, 2010). If this were the case then the spatial location of damage would be more important than lesion load in determining cognitive outcome. This work demonstrates that thalamic lacunes are associated with cognitive impairment, consistent with previous observations (Benisty et al., 2009; Duering et al., 2011). However, the thalamus is a complex structure consisting of multiple subnuclei that have unique functional properties. We demonstrate a specific association between the anteromedial thalamus and impaired processing speed. To further validate this in our cohort, we characterised the anatomical covariance associated with the area damaged within this region, which corresponded well with the described connectivity. Contained within this region are the ventral anterior (VAN) and the mediodorsal (MDN) nuclei, (Johansen-Berg et al., 2005) (Fig. 2C). Tract tracing studies have shown that this region of the thalamus has extensive connections to the orbitofrontal, prefrontal and cingulate cortices (Ray and Price, 1992; Klein et al., 2010), which has been replicated in-vivo using probabilistic diffusion tractography (Behrens et al., 2003; Johansen-Berg et al., 2005; Klein et al., 2010). In addition cytoarchitectonic studies and functional neuroimaging studies have also described connections between the mediodorsal and ventral nuclei of the thalamus and the anterior insular cortex (Cho et al., 2012; Metzger et al., 2013). The combined evidence therefore suggests that lacunes in this region may impair processing speed by disrupting connectivity to the orbitofrontal and prefrontal cortices.
The thalamus is also densely interconnected with the striatum and cortex via parallel corticostriatal-thalamo-cortical loops (Draganski et al., 2008; Metzger et al., 2013). Initially described by Alexander et al. (1986), these are arranged topographically into distinct functional circuits. The thalamic region identified in this work would overlap with the previously identified orbitofrontal and medial–prefrontal networks. The structural covariance from our work corresponds well with the described connectivity of these functional circuits (Draganski et al., 2008), providing indirect supportive evidence for their involvement. Previous studies in multiple sclerosis (Batista et al., 2012) and ageing (Van Der Werf et al., 2001) have reported that thalamic atrophy is associated with impaired processing speed. Our results provide a sound biological basis for these observations. It is likely that processing speed is not due to a single neural system, but rather is a reflection of activity across several overlapping networks. It may be that the anteromedial thalamus forms a ‘hub’ for the networks involved in processing speed performance, with impairment resulting from a lacune mediated disconnection syndrome.
Some limitations of our study are that some functionally relevant locations of lacunes may have been missed due to limited overlap of lacune locations between subjects and due to the conservative nature of Bonferroni correction. Furthermore, although the atlas registration was manually checked for quality, a perfect image co-registration cannot be guaranteed by application of current techniques. The analysis of grey matter lacune location is likely to be more robust than that for white matter regions which are less well defined than grey matter structures. The thalamus had the highest frequency of lacunes and therefore associations in this region may have been easier to detect. It is possible that lacunes in other locations are also strategically important but we did not have a sufficient sample size to detect significant associations. In addition we lacked sufficient numbers to investigate the impact of multiple lacunes in one region and interactions between lesion locations. A further limitation is that the biological basis for structural covariance is incompletely understood and does not necessarily infer structural connectivity. Structural covariance can also be influenced by developmental, genetic and environmental factors. Therefore we supported our observations with previously reported white matter connectivity results from both healthy in vivo populations and ex vivo histology. Despite its limitations, because structural covariance does not depend upon intact white matter pathways, it may allow the exploration of network hypotheses, particularly in diseased brains such as in patients with SVD, as it avoids the methodological issues that arise from attempting to use in vivo tractography to define networks of interest across regions of degenerating white matter tracts.
5. Conclusion
Lacunes are an important marker of impaired information processing speed and executive function, which are characteristic of vascular cognitive impairment in SVD. We demonstrated that thalamic lacunes impair processing speed, and informed by this observation further localised it to the anteromedial thalamus. Lacunes in this area may impair processing speed by disrupting connectivity to the prefrontal cortex. This study highlights the importance of the spatial distribution of lacunes and provides support for the role of corticostriatal-thalamo-cortical loops in processing speed deficits in SVD.
Conflicts of interest
No disclosures or conflict of interests.
Sources of funding
SCANS was supported by a Wellcome Trust grant (081589). Recruitment was supported by the English National Institute of Health Research (NIHR) Clinical Stroke Research Network. Hugh Markus is supported by an NIHR Senior Investigator award. Andrew Lawrence is supported by Alzheimer's Research UK.
Acknowledgements
Recruitment to the study was supported by the English National Institute of Health Research Clinical Stroke Research Network. We thank Lalit Kalra and Tony Rudd for help with recruitment. We also thank Thomas Willis for assistance with neuropsychological assessment.
Appendix A. Supplementary material
Supplementary material associated with this article can be found, in the online version, at http://dx.doi.org/10.1016/j.nicl.2014.05.009.
Appendix A. Supplementary materials
Supplementary materials for Strategic lacunes and their relationship to cognitive impairment in cerebral small vessel disease.
References
- Alexander-Bloch A., Giedd J., Bullmore E. Imaging structural co-variance between human brain regions. Nature Reviews. Neuroscience. 2013;14:322–336. doi: 10.1038/nrn3465. 23531697 [DOI] [PMC free article] [PubMed] [Google Scholar]
- Alexander G.E., DeLong M.R., Strick P.L. Parallel organization of functionally segregated circuits linking basal ganglia and cortex. Annual Review of Neuroscience. 1986;9:357–381. doi: 10.1146/annurev.ne.09.030186.002041. 3085570 [DOI] [PubMed] [Google Scholar]
- Ashburner J., Friston K.J. Diffeomorphic registration using geodesic shooting and Gauss–Newton optimisation. Neuroimage. 2011;55:954–967. doi: 10.1016/j.neuroimage.2010.12.049. 21216294 [DOI] [PMC free article] [PubMed] [Google Scholar]
- Avants B., Tustison N., Song G., Cook P., Klein A., Gee J. A reproducible evaluation of ANTs similarity metric performance in brain image registration. Neuroimage. 2011;54:2033–2044. doi: 10.1016/j.neuroimage.2010.09.025. 20851191 [DOI] [PMC free article] [PubMed] [Google Scholar]
- Bamford J., Sandercock P., Jones L., Warlow C. The natural history of lacunar infarction: the Oxfordshire Community Stroke Project. Stroke; a Journal of Cerebral Circulation. 1987;18:545–551. doi: 10.1161/01.str.18.3.545. 3590244 [DOI] [PubMed] [Google Scholar]
- Batista S., Zivadinov R., Hoogs M., Bergsland N. Basal ganglia, thalamus and neocortical atrophy predicting slowed cognitive processing in multiple sclerosis. Journal of Neurology. 2012;259:139–146. doi: 10.1007/s00415-011-6147-1. 21720932 [DOI] [PubMed] [Google Scholar]
- Behrens T.E.J., Hohansen-Berg H., Woolrich M.W. Non-invasive mapping of connections between human thalamus and cortex using diffusion imaging. Nature Neuroscience. 2003;6:750–757. doi: 10.1038/nn1075. 12808459 [DOI] [PubMed] [Google Scholar]
- Benisty S., Gouw A.A., Porcher R. Location of lacunar infarcts correlates with cognition in a sample of non-disabled subjects with age-related white-matter changes: the LADIS study. Journal of Neurology, Neurosurgery, and Psychiatry. 2009;80:478–483. doi: 10.1136/jnnp.2008.160440. 19211595 [DOI] [PubMed] [Google Scholar]
- Birns J., Kalra L. Cognitive function and hypertension. Journal of Human Hypertension. 2009;23:86–96. doi: 10.1038/jhh.2008.80. 18650838 [DOI] [PubMed] [Google Scholar]
- Boiten J., Luijckx G.J., Kessels F. Risk factors for lacunes. Neurology. 1996;47:1109–1110. doi: 10.1212/wnl.47.4.1109. 8857763 [DOI] [PubMed] [Google Scholar]
- Bressler S.L., Menon V. Large-scale brain networks in cognition: emerging methods and principles. Trends in Cognitive Sciences. 2010;14:277–290. doi: 10.1016/j.tics.2010.04.004. 20493761 [DOI] [PubMed] [Google Scholar]
- Charlton R.A., Morris R.G., Nitkunan A., Markus H.S. The cognitive profiles of CADASIL and sporadic small vessel disease. Neurology. 2006;66:1523–1526. doi: 10.1212/01.wnl.0000216270.02610.7e. 16717212 [DOI] [PubMed] [Google Scholar]
- Cho Y.T., Fromm S., Guyer A.E., Detloff A., Pine D.S., Fudge J.L., Ernst M. Nucleus accumbens, thalamus and insula connectivity during incentive anticipation in typical adults and adolescents. Neuroimage. 2012;66:508–521. doi: 10.1016/j.neuroimage.2012.10.013. 23069809 [DOI] [PMC free article] [PubMed] [Google Scholar]
- Coughlan A.K., Oddy M.C., Crawford J.R. The BIRT Memory and Information Processing Battery (B-MIPB) The Brain Injury Rehabilitation Trust (BIRT), Wakefield; UK: 2009. [Google Scholar]
- Delis D.C., Kaplan E., Kramer J. Delis Kaplan 2001 Executive Function Scale (D-KEFS) Psychological Corporation; San Antonio, TX.: 2001. [Google Scholar]
- Draganski B., Kherif F., Klöppel S., Cook P.A., Alexander D.C., Parker G.J., Deichmann R., Ashburner J., Frackowiak R.S. Evidence for segregated and integrative connectivity patterns in the human basal ganglia. Journal of Neuroscience: the Official Journal of the Society for Neuroscience. 2008;28:7143–7152. doi: 10.1523/JNEUROSCI.1486-08.2008. 18614684 [DOI] [PMC free article] [PubMed] [Google Scholar]
- Duering M., Zieren N., Hervé D., Jouvent E., Reyes S., Peters N., Pachai C., Opherk C., Chabriat H., Dichgans M. Strategic role of frontal white matter tracts in vascular cognitive impairment: a voxel-based lesion–symptom mapping study in CADASIL. Brain: a Journal of Neurology. 2011;134:2366–2375. doi: 10.1093/brain/awr169. 21764819 [DOI] [PubMed] [Google Scholar]
- Fazekas F., Kleinert R., Offenbacher H., Schmidt R., Kleinert G., Payer F., Radner H., Lechner H. Pathologic correlates of incidental MRI white matter signal hyperintensities. Neurology. 1993;43:1683–1689. doi: 10.1212/wnl.43.9.1683. 8414012 [DOI] [PubMed] [Google Scholar]
- Fisher C.M. The arterial lesions underlying lacunes. Acta Neuropathologica. 1968;12:1–15. doi: 10.1007/BF00685305. 5708546 [DOI] [PubMed] [Google Scholar]
- Gold G., Kövari E., Herrmann F.R., Canuto A., Hof P.R., Michel J.P., Bouras C., Giannakopoulos P. Cognitive consequences of thalamic, basal ganglia, and deep white matter lacunes in brain aging and dementia. Stroke; a Journal of Cerebral Circulation. 2005;36:1184–1188. doi: 10.1161/01.STR.0000166052.89772.b5. 15891000 [DOI] [PubMed] [Google Scholar]
- Grimaud J., Lai M., Thorpe J., Adeleine P., Wang L. Quantification of MRI lesion load in multiple sclerosis: a comparison of three computer-assisted techniques. Magnetic Resonance imaging. 1996;14:495–505. doi: 10.1016/0730-725x(96)00018-5. 8843362 [DOI] [PubMed] [Google Scholar]
- Johansen-Berg H., Behrens T.E., Sillery E., Ciccarelli O., Thompson A.J., Smith S.M., Matthews P.M. Functional–anatomical validation and individual variation of diffusion tractography-based segmentation of the human thalamus. Cerebral Cortex (New York, N.Y.: 1991) 2005;15:31–39. doi: 10.1093/cercor/bhh105. 15238447 [DOI] [PubMed] [Google Scholar]
- Khan U., Porteous L., Hassan A., Markus H.S. Risk factor profile of cerebral small vessel disease and its subtypes. Journal of Neurology, Neurosurgery, and Psychiatry. 2007;78:702–706. doi: 10.1136/jnnp.2006.103549. 17210627 [DOI] [PMC free article] [PubMed] [Google Scholar]
- Klein A., Andersson J., Ardekani B.A., Ashburner J., Avants B., Chiang M.C., Christensen G.E., Collins D.L., Gee J., Hellier P., Song J.H., Jenkinson M., Lepage C., Rueckert D., Thompson P., Vercauteren T., Woods R.P., Mann J.J., Parsey R.V. Evaluation of 14 nonlinear deformation algorithms applied to human brain MRI registration. Neuroimage. 2009;46:786–802. doi: 10.1016/j.neuroimage.2008.12.037. 19195496 [DOI] [PMC free article] [PubMed] [Google Scholar]
- Klein J.C., Rushworth M.F., Behrens T.E., Mackay C.E., de Crespigny A.J., D'Arceuil H., Johansen-Berg H. Topography of connections between human prefrontal cortex and mediodorsal thalamus studied with diffusion tractography. Neuroimage. 2010;51:555–564. doi: 10.1016/j.neuroimage.2010.02.062. 20206702 [DOI] [PMC free article] [PubMed] [Google Scholar]
- Lambert C., Lutti A., Helms G., Frackowiak R., Ashburner J. Multiparametric brainstem segmentation using a modified multivariate mixture of Gaussians. NeuroImage: Clinical. 2013;2:684–694. doi: 10.1016/j.nicl.2013.04.017. 24179820 [DOI] [PMC free article] [PubMed] [Google Scholar]
- Lawrence A.J., Patel B., Morris R.G., MacKinnon A.D., Rich P.M., Barrick T.R., Markus H.S., Mechanisms of cognitive impairment in cerebral small vessel disease: multimodal MRI results from the St George's cognition and neuroimaging in Stroke (SCANS) study. PLOS One (2013) http://www.plosone.org/article/info:doi/10.1371/journal.pone.0061014 [DOI] [PMC free article] [PubMed]
- Lee J., Choi J.C., Kang S., Kang J., Na H.R., Park J. Effects of lacunar infarctions on cognitive impairment in patients with cerebral autosomal-dominant arteriopathy with subcortical infarcts and leukoencephalopathy. Journal of Clinical Neurology (Seoul, Korea) 2011;7:210–214. doi: 10.3988/jcn.2011.7.4.210. 22259617 [DOI] [PMC free article] [PubMed] [Google Scholar]
- Lesher E.L., Berryhill J.S. Validation of the Geriatric Depression Scale — short form among inpatients. Journal of Clinical Psychology. 1994;50:256–260. doi: 10.1002/1097-4679(199403)50:2<256::aid-jclp2270500218>3.0.co;2-e. 8014251 [DOI] [PubMed] [Google Scholar]
- Loos C.M., Staals J., Wardlaw J.M., van Oostenbrugge R.J. Cavitation of deep lacunar infarcts in patients with first-ever lacunar stroke: a 2-year follow-up study with MR. Stroke; a Journal of Cerebral Circulation. 2012;43:2245–2247. doi: 10.1161/STROKEAHA.112.660076. 22693127 [DOI] [PubMed] [Google Scholar]
- Matthews C.G., Klove H. Instruction Manual for the Adult Neuropsychological Test Battery. University of Wisconsin Medical School; 1964. [Google Scholar]
- Metzger C.D., Van der Werf Y.D., Walter M. Functional mapping of thalamic nuclei and their integration into corticostriatal-thalamo-cortical loops via ultra-high resolution imaging from animal anatomy to in vivo imaging in humans. Frontiers in Neuroscience. 2013;8:7–24. doi: 10.3389/fnins.2013.00024. 23658535 [DOI] [PMC free article] [PubMed] [Google Scholar]
- MATLAB and Statistics Toolbox Release 2010b, The MathWorks, Inc., Natick, Massachusetts, United States.
- Morel A., Magnin M., Jeanmonod D. Multiarchitectonic and stereotactic atlas of the human thalamus. Journal of Comparative Neurology. 1997;387:588–630. doi: 10.1002/(sici)1096-9861(19971103)387:4<588::aid-cne8>3.0.co;2-z. 9373015 [DOI] [PubMed] [Google Scholar]
- Mori S., Wakana S., van Zijl P.C.M., Nagae-Poetscher L.M. MRI Atlas of Human White Matter. Elsevier; Amsterdam, The Netherlands: 2005. [Google Scholar]
- Nagahama Y., Okina T., Suzuki N., Matsuzaki S., Yamauchi H., Nabatame H., Matsuda M. Factor structure of a modified version of the Wisconsin Card Sorting Test: an analysis of executive deficit in Alzheimer's disease and mild cognitive impairment. Dementia and Geriatric Cognitive Disorders. 2003;16:103–112. doi: 10.1159/000070683. 12784035 [DOI] [PubMed] [Google Scholar]
- Nelson, H., Willison, J.R., National Adult Reading Test (NART): test Manual. NFER-Nelson, 2nd Edition; 1991.
- Nitkunan A., Barrick T.R., Charlton R.A., Clark C.A., Markus H.S. Multimodal MRI in cerebral small vessel disease: its relationship with cognition and sensitivity to change over time. Stroke; a Journal of Cerebral Circulation. 2008;39:1999–2005. doi: 10.1161/STROKEAHA.107.507475. 18436880 [DOI] [PubMed] [Google Scholar]
- O'Sullivan M., Morris R.G., Huckstep B., Jones D.K., Williams S.C., Markus H.S. Diffusion tensor MRI correlates with executive dysfunction in patients with ischaemic leukoaraiosis. Journal of Neurology, Neurosurgery, and Psychiatry. 2004;75:441–447. doi: 10.1136/jnnp.2003.014910. 14966162 [DOI] [PMC free article] [PubMed] [Google Scholar]
- Pantoni L. Cerebral small vessel disease: from pathogenesis and clinical characteristics to therapeutic challenges. Lancet Neurology. 2010;9:689–701. doi: 10.1016/S1474-4422(10)70104-6. 20610345 [DOI] [PubMed] [Google Scholar]
- Ray J.P., Price J.L. The organization of the thalamocortical connections of the mediodorsal thalamic nucleus in the rat, related to the ventral forebrain–prefrontal cortex topography. Journal of Comparative Neurology. 1992;323:167–197. doi: 10.1002/cne.903230204. 1401255 [DOI] [PubMed] [Google Scholar]
- Reitan R.M. The relation of the trail making test to organic brain damage. Journal of Consulting Psychology. 1955;19:393–394. doi: 10.1037/h0044509. 13263471 [DOI] [PubMed] [Google Scholar]
- Smith S.M., Zhang Y., Jenkinson M., Chen J., Matthews P.M., Federico A., De Stefano N. Accurate, robust, and automated longitudinal and cross-sectional brain change analysis. Neuroimage. 2002;17:479–489. doi: 10.1006/nimg.2002.1040. 12482100 [DOI] [PubMed] [Google Scholar]
- Soriano-Mas C., Harrison B.J., Pujol J., López-Solà M., Hernández-Ribas R., Alonso P., Contreras-Rodríguez O., Giménez M., Blanco-Hinojo L., Ortiz H., Deus J., Menchón J.M. Structural covariance of the neostriatum with regional gray matter volumes. Brain structure & function. 2013;218:697–709. doi: 10.1007/s00429-012-0422-5. [DOI] [PubMed] [Google Scholar]
- Thomas A.J., O'Brien J.T. Depression and cognition in older adults. Current Opinion in Psychiatry. 2008;21:8–13. doi: 10.1097/YCO.0b013e3282f2139b. 18281834 [DOI] [PubMed] [Google Scholar]
- Van Der Werf Y.D., Tisserand D.J., Visser P.J., Hofman P.A., Vuurman E., Uylings H.B., Jolles J. Thalamic volume predicts performance on tests of cognitive speed and decreases in healthy aging. A magnetic resonance imaging-based volumetric analysis. Brain. Resources Cognitive Brain Research. 2001;11:377–385. doi: 10.1016/s0926-6410(01)00010-6. [DOI] [PubMed] [Google Scholar]
- Vermeer S., Longstreth W.T., Koudstaal P.J. Silent brain infarcts: a systematic review. Lancet Neurology. 2007;6:611–619. doi: 10.1016/S1474-4422(07)70170-9. 17582361 [DOI] [PubMed] [Google Scholar]
- Viswanathan A., Gschwendtner A., Guichard J.P. Lacunar lesions are independently associated with disability and cognitive impairment in CADASIL. Neurology. 2007;69:172–179. doi: 10.1212/01.wnl.0000265221.05610.70. 17620550 [DOI] [PubMed] [Google Scholar]
- Wardlaw J.M., Smith E.E., Biessels G.J., Cordonnier C., Fazekas F., Frayne R., Lindley R.I., O'Brien J.T. Neuroimaging standards for research into small vessel disease and its contribution to ageing and neurodegeneration. Lancet Neurology. 2013;12:822–838. doi: 10.1016/S1474-4422(13)70124-8. 23867200 [DOI] [PMC free article] [PubMed] [Google Scholar]
- Wechsler D. Manual for the Wechsler Intelligence Scale — Third Edition (WAIS-III) Psychological Corporation; San Antonio, TX.: 1997. [Google Scholar]
- Wechsler D. Wechsler Memory Scale — Third Edition (WMS-III UK). Administration and Scoring Manual. The Psychological Corporation; San Antonio, TX.: 1997. [Google Scholar]
Associated Data
This section collects any data citations, data availability statements, or supplementary materials included in this article.
Supplementary Materials
Supplementary materials for Strategic lacunes and their relationship to cognitive impairment in cerebral small vessel disease.