

Abstract
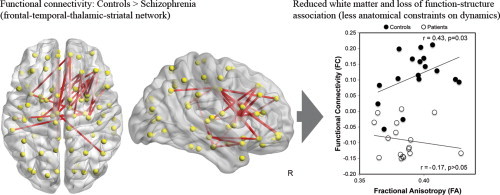
Neuroimaging studies have demonstrated that the phenomenology of schizophrenia maps onto diffuse alterations in large-scale functional and structural brain networks. However, the relationship between structural and functional deficits remains unclear. To answer this question, patients with established schizophrenia and matched healthy controls underwent resting-state functional and diffusion weighted imaging. The network-based statistic was used to characterize between-group differences in whole-brain functional connectivity. Indices of white matter integrity were then estimated to assess the structural correlates of the functional alterations observed in patients. Finally, group differences in the relationship between indices of functional and structural brain connectivity were determined. Compared to controls, patients with schizophrenia showed decreased functional connectivity and impaired white matter integrity in a distributed network encompassing frontal, temporal, thalamic, and striatal regions. In controls, strong interregional coupling in neural activity was associated with well-myelinated white matter pathways in this network. This correspondence between structure and function appeared to be absent in patients with schizophrenia. In two additional disrupted functional networks, encompassing parietal, occipital, and temporal cortices, the relationship between function and structure was not affected. Overall, results from this study highlight the importance of considering not only the separable impact of functional and structural connectivity deficits on the pathoaetiology of schizophrenia, but also the implications of the complex nature of their interaction. More specifically, our findings support the core nature of fronto-striatal, fronto-thalamic, and fronto-temporal abnormalities in the schizophrenia connectome.
Keywords: Brain connectivity, fMRI, Diffusion, DTI, Psychosis, Resting-state, Structure–function
Highlights
-
•
Relationship between functional and structural connectivity tested in schizophrenia
-
•
Convergent functional and structural deficits in fronto-temporo-subcortical network
-
•
Additional loss of association between function and structure defines this network.
-
•
Impaired structural integrity may lead to less constraint of functional activity.
-
•
Abnormal principles of brain organization may define core networks of pathology.
Graphical Abstract
1. Introduction
Schizophrenia is a debilitating mental illness characterized by complex cognitive, affective, and behavioural symptoms that significantly deteriorate an individual's quality of life (Eack and Newhill, 2007). Studies adopting magnetic resonance imaging have shown that the complexity and severity of these various symptoms are mirrored in the extent of focal grey and white matter alterations in the brain (Bora et al., 2011; Fornito et al., 2009; Shepherd et al., 2012). A recent review (Fornito et al., 2012) has also drawn attention to the reproducible and widespread deficits in functional (Alexander-Bloch et al., 2010; Bassett et al., 2012; Bassett et al., 2008; Fornito et al., 2011; Zalesky et al., 2011; Lynall et al., 2010; Rubinov et al., 2009; Liu et al., 2008; Collin and Pol, 2011; Wang et al., 2010) and structural brain connectivity (Zalesky et al., 2011; Collin et al., 2013; Pettersson-Yeo et al., 2011) that are characteristic of schizophrenia. These connectivity abnormalities support the conceptualization of schizophrenia as a disconnection syndrome (Friston, 2005; Friston and Frith, 1995). Accordingly, a comprehensive characterization of the schizophrenia connectome is an important step to understanding the neural basis of this disorder and to developing more accurate biomarkers for diagnosis and treatment efficacy (Bassett et al., 2008; Cocchi et al., 2012; Insel and Wang, 2010; Fornito and Harrison, 2012; van den Heuvel et al., 2010; Filippi et al., 2013).
The functioning of the human brain is constrained by its anatomical interconnections (Bassett et al., 2008; van den Heuvel et al., 2010; Sporns, 2011; Sporns, 2012; Honey et al., 2009; Hermundstad et al., 2013; Deco et al., 2013; Skudlarski et al., 2008). The most striking example of this can be found in the healthy brain, where the presence of well-myelinated white matter pathways is known to be an accurate predictor of synchronization in neural activity measured between corresponding regions (i.e., functional connectivity, Honey et al., 2009). The converse is not necessarily true; that is, functional connectivity can be established in the absence of a direct structural pathway (Stephan et al., 2009; Stephan et al., 2006). For example, the functional interplay between two brain regions may be mediated by a third region. Whether the structure–function connectivity relationship is preserved in schizophrenia and in other psychiatric illnesses remains a largely unresolved matter.
To date, a small number of neuroimaging studies have reported spatial coincidence in aberrant indices of both large-scale functional connectivity and structural connectivity in schizophrenia (Yan et al., 2012; Camchong et al., 2011; Zalesky et al., 2010). For instance, in one study concurrently assessing functional and structural connectivity, Zalesky et al. (2010) demonstrate overlapping anatomical and functional alterations in brain networks encompassing the mediofrontal, temporal, parietal and occipital regions. Recent studies investigating the relation between structural connectivity and functional connectivity in schizophrenia have reported evidence of both weaker and stronger structure–function coupling relative to the healthy brain (Skudlarski et al., 2010; van den Heuvel et al., 2013), suggesting that variation in this relationship may be cohort and/or network-specific. However, it remains unclear whether abnormal structure–function relationships are convergent with abnormalities in functional and structural connectivity in their own right; such links may point to dependencies between metrics of connectomic pathophysiology that define this disorder.
Given the paucity of research in this area, we sought to assess the structural underpinnings of altered functional connectivity in schizophrenia by investigating whether the association between functional and structural connectivity was preserved in functional networks affected by the disorder. To this end, connectomic techniques were applied to diffusion and resting-state functional imaging data acquired in a sample of well characterized patients with established schizophrenia and a carefully matched group of healthy controls. The network-based statistic (NBS, Zalesky et al., 2010) was first used to comprehensively test the entire connectome for functional connections showing evidence of abnormal synchronization in patients with schizophrenia. This whole-brain analysis was followed by a selective assessment of the white matter integrity of the anatomical pathways interconnecting the pairs of regions identified as showing abnormal functional connectivity. Finally, we sought to assess whether the relationship between indices of functional and structural connectivity in the networks of interest was altered in the patient group.
Based on our previous investigations (Zalesky et al., 2010), we hypothesize that the schizophrenia connectome comprises disrupted white matter pathways that are spatially correspondent with pairs of regions showing abnormal resting-state functional connectivity. We further hypothesize that altered functional and structural network connectivity may be linked to a loss of the normal coherence between these measures observed in the healthy brain. Specifically, we expect that stronger structure–function correlations in patients with schizophrenia compared to controls may be a marker of greater rigidity in functional network dynamics of schizophrenia. Conversely, weaker coupling may indicate a randomization of the normal constraints anatomical interconnections impart on brain function.
2. Materials and methods
2.1. Participants
Eighteen adults meeting the diagnostic criteria for schizophrenia (Structured Clinical Interview for DSM-IV Axis-I Disorders, First, 1997) and 18 healthy controls were recruited from the general community. Controls did not meet lifetime criteria for any Axis-I disorder or have a family history of psychosis. Patients with comorbid Axis-I disorders were also excluded, excepting past major depressive episodes or past substance abuse/dependence. Additional exclusion criteria included neurological conditions, significant head injury, electroconvulsive therapy, systemic steroid use, intellectual disability (IQ < 80), MRI incompatibility or intolerance (e.g. cardiac pace-maker), acute intoxication, and excessive head motion (>2 mm) during fMRI data acquisition.
One patient was excluded due to excessive head motion and one control participant due to scanner intolerance. The remaining 17 participants in each cohort were closely matched for age, gender, years of education, handedness, and both current and historical substance use (with the exception of greater tobacco intake in patients, Table 1). As is generally reported, the schizophrenia cohort had a lower full-scale IQ (Wechsler, 1999).
Table 1.
Participant demographics.
| SCZ (n = 17) | CON (n = 17) | Statistic | |
|---|---|---|---|
| Demographics, mean (SD) | |||
| ????Age, years | 29.9 (6.7) | 27.0 (6.1) | t32 = 1.31, p = 0.20 |
| ????Gender, M/F | 16/1 | 13/4 | ?2 = 2.11, p = 0.15 |
| ????Education, years | 13.6 (3.0) | 14.6 (1.8) | t32 = 1.20, p = 0.24 |
| ????Full-scale IQ | 104 (14.9) | 113 (6.1) | t28 = 2.43, p = 0.022a |
| ????Handedness, R/L | 15/2 | 17/0 | ?2 = 2.13, p = 0.15 |
| Illness and symptom measures, mean (SD) or median [range] | |||
| ????Age of initial diagnosis, years | 22.5 (4.5) | ||
| ????Treatment duration, years | 7.5 (4.9) | ||
| ????PANSS positive | 13.4 (6.4) | ||
| ????PANSS negative | 12.3 (4.5) | ||
| ????PANSS general | 27.6 (6.2) | ||
| ????Beck Depression Inventory | 16 [0–41] | 2 [0–14] | Z = 3.61, p < 0.001 |
| ????Beck Anxiety Inventory | 7 [0–36] | 2 [0–5] | Z = 2.83, p = 0.005 |
| ????Quality of lifeb | 58.4 (12.2) | 70.3 (6.7) | t32 = 3.51, p = 0.001 |
| Substance use measures, median [range] | |||
| ????Alcohol, current drinks/month | 2 [0–80] | 9 [0–72] | Z = 1.86, p = 0.063 |
| ????Tobacco, current cigs/day | 0 [0–30] | 0 [0–15] | Z = 2.46, p = 0.049 |
| ????Cannabis, lifetime uses | 77 [0–3650] | 10 [0–700] | Z = 1.49, p = 0.15 |
| ????Ecstasy, lifetime uses | 1 [0–156] | 0 [0–30] | Z = 1.50, p = 0.18 |
| ????Amphetamines, lifetime uses | 0 [0–365] | 0 [0–4] | Z = 2.00, p = 0.092 |
| ????Cocaine, lifetime uses | 0 [0–6] | 0 [0–15] | Z = 0.75, p = 0.63 |
| ????Hallucinogens, lifetime uses | 0 [0–8] | 0 [0–5] | Z = 0.41, p = 0.76 |
Bold entries denote statistical significance; PANSS = Positive and Negative Syndrome Scale.
IQ not measured for 1 control and 3 schizophrenia participants.
Quality of Life Enjoyment and Satisfaction Scale (abbreviated version).
All patients with schizophrenia were compliant to an atypical neuroleptic pharmacotherapy, based on self- and clinician-report. Five patients were additionally taking an antidepressant or mood-stabilizing medication. There were no known cases of extended untreated psychosis. Symptom severity was assessed using the Positive and Negative Syndrome Scale (PANSS, Kay et al., 1987), the Beck Depression Inventory-II (Beck et al., 1961), and the Beck Anxiety Inventory (Beck and Steer, 1990) (Table 1). Based on rating scores, patients could generally be classified as mildly to moderately ill (Leucht et al., 2005). Patients also endorsed a lower overall quality of life, as assessed by the abbreviated Quality of Life Enjoyment and Satisfaction Questionnaire (Q-LES-Q-18, Endicott et al., 1993; Ritsner et al., 2005).
This study was approved and undertaken in accordance with regulations established by the Mental Health Research and Ethics Committee of Melbourne Health; all participants provided written informed consent prior to participation.
2.2. Magnetic resonance imaging
Data acquisition was conducted using a Siemens Trio 3 T magnetic resonance scanner at the Murdoch Childrens Research Institute (Melbourne, Australia).
2.2.1. Resting-state functional MRI
Over a 10-minute period, 250 whole-brain functional MRI volumes (36 contiguous axial slices; 3 mm thickness) were acquired while participants were awake but performing no explicit cognitive task (i.e., standard eyes open resting-state fMRI protocol). Gradient-echo echo-planar-imaging parameters were as follows: time to repetition (TR) = 2400 ms; time to echo (TE) = 30 ms; flip angle = 90°; field of view (FOV) = 210 × 210 mm; in-plane matrix = 64 × 64; and in-plane resolution = 3.3 × 3.3 mm.
2.2.2. Diffusion-weighted MRI
Diffusion MRI was used to quantify the diffusion of water molecules along multiple directions to infer white matter tissue architecture. Sixty diffusion-weighted volumes, each quantifying water diffusion in a unique direction, were acquired using a spin-echo echo-planar imaging sequence with the following parameters: b-value = 2000 s/mm; 64 consecutive axial slices, 2.0 mm thickness; in-plane matrix = 128 × 128; in-plane resolution = 2.0 × 2.0 mm; FOV = 256 × 256 mm; TR = 9350 ms; TE = 104 ms; and flip angle = 90°. Five non-diffusion-weighted volumes were also acquired.
2.3. Data analysis
2.3.1. Preprocessing: resting-state functional MRI
Preprocessing was performed in MATLAB (version 2012a) using the Data Processing Assistant for Resting-State fMRI toolbox (version 2.2, Chao-Gan and Yu-Feng, 2010). The first 4 volumes (10 s) of the acquisition were discarded to allow stabilization of scanner magnetization and subject orientation. The 36 slices within each whole-brain volume were temporally aligned prior to spatial rigid-body coregistration of the 250 volumes. The realigned data were then normalized to Montreal Neurological Institute (MNI) standardized space by first estimating a 12-parameter affine transformation mapping the data volumes to a standard template image. Nonlinear deformations were then estimated to minimize the residual squared difference between the data and the template. The warped data were interpolated to a spatial resolution of 3 mm isotropic, spatially smoothed using a Gaussian kernel having a full-width at half-maximum (FWHM) of 6 mm, and bandpass filtered to isolate relevant low-frequency signal variance in each voxel (0.01–0.08 Hz). The following nuisance parameters were then regressed out of the data at each brain voxel: six standard head motion parameters (3 planes of translation, 3 axes of rotation), frame displacement greater than 0.5 mm (including the preceding and the two subsequent volumes; note that deleting (i.e., scrubbing,Power et al., 2012) the affected frames yielded very similar results), global signal (Keller et al., 2013; Power et al., 2014), and signals from the white matter and cerebrospinal fluid. Further exploration indicated that the average number of regressed volumes was small and similar across groups [t17.81 = 1.98, p > 0.05; average 0.02% (range 0–0.1%) in controls; 0.09% (0–0.5%) in patients].
The automated anatomical labelling (AAL, Tzourio-Mazoyer et al., 2002) template was employed to divide the brain into 90 standardized regions-of-interest. The cerebellum was excluded from analysis due to inconsistent sampling across participants during data acquisition. The residuals from the above-described regression were spatially averaged over the voxels comprising each region. This yielded a set of 90 regional time series representing 10 min of intrinsic (resting-state) neural activity for each region. The functional connectivity between each pair of regions was quantified independently with the Pearson correlation coefficient, resulting in a symmetric 90 by 90 connectivity matrix for each participant.
2.3.2. Preprocessing: diffusion weighted MRI
Preprocessing was performed using FDT (v2.0), the diffusion toolkit in FSL (FMRIB's Software Library; http://www.fmrib.ox.ac.uk/fsl). Additional preprocessing steps recommended in the recent literature were also performed, as described below (Jones and Cercignani, 2010). Diffusion-weighted volumes were manually inspected for large artefacts and then corrected for stretches, shears, and head motion by an affine registration to the first non-diffusion-weighted volume using the eddycorrect algorithm. A fractional anisotropy (FA) volume was estimated using weighted linear least squares fitted to the log-transformed diffusion data. The FA volume was then registered to MNI space using the FSL nonlinear registration tool FNIRT. The nonlinear warp was initialized with an affine registration generated with the FSL linear registration tool FLIRT (Jenkinson and Smith, 2001). The registration target was the average of 58 FA volumes from healthy adults that were well-aligned to MNI152 space. The inverse of the estimated warp field was then applied to the AAL template, producing binary masks for the 90 cortical and subcortical regions in native diffusion space.
2.3.3. Probabilistic tractography
Probabilistic streamline tractography was performed using the FSL algorithm ProbtrackX, build 419 (Euler integration; step length: 0.5 mm; curvature threshold: 80°). Local fibre orientations were first estimated using a validated crossing-fibre model (Behrens et al., 2003). To map the connectivity between a pair of regions, tractography was performed with one of the regions serving as the seed mask and the other region serving as the termination mask. A total of 500 streamlines were initiated from random locations within each voxel comprising the seed region. Tractography was then repeated with the seed and termination masks interchanged. The result of this was two volumes (connectivity distributions) in which each voxel stored the total number of streamlines that it was intersected by. These two volumes were averaged voxel-wise and thresholded to yield a binary mask of the volume encapsulated by the putative white matter pathway interconnecting the pair of regions. The thresholding was performed such that any voxel intersected by 10 or more streamlines in the averaged map was set to one, while all other voxels were set to zero. FA values of all voxels comprising this binary mask were averaged to yield a connection-specific measure of white matter integrity. This tractography process and tract-specific averaging of FA was repeated identically for each participant in all pairs of regions encompassing the functional networks eliciting a between-group difference. The FA was adopted as an estimate of structural connectivity because of its established link with neurobiological measures of white matter integrity (Pierpaoli and Basser, 1996; Kochunov et al., 2007). Furthermore, relative to streamlines counts, FA is more normally distributed and resides on a continuous scale, thus better justifying the use of standard statistical approaches.
2.3.4. Statistical analysis: functional connectivity
The network-based statistic (Zalesky et al., 2010) was used to identify networks comprising pairs of regions for which the extent of functional connectivity significantly differed between the patient and control groups. In brief, a two-sample t-statistic was calculated for each pair of regions to test the null hypothesis of equality between the patient and control groups in mean functional connectivity. All possible, (90 × 89) / 2 = 4005, pairs of regions were tested. Among the connections exceeding a test-statistic threshold of 3, a search was performed to identify any connected network components. A threshold of 3 was chosen on the basis that it was found to yield consistent findings across the parcellation atlases considered and approximately corresponds to the nominal uncorrected p-value of 0.005 (see Zalesky et al., 2012 for discussion about the choice of threshold). The size of each identified network component was measured by the number of supra-threshold connections it comprised. Permutation testing was then performed to estimate a corrected p-value for each network. For each of 10,000 permutations, the size of the largest network was recorded to generate a null distribution for calculation of family-wise error corrected statistical thresholds. A corrected p-value for a network identified in the actual data was then estimated by the proportion of permutations for which a network of equal or greater size was identified.
The AAL template is one of the most prevalently used regional parcellations for mapping both the functional and the structural human connectome (Zalesky et al., 2010). We utilized the AAL to maximize the number of existing studies with which our results could be directly compared without the need to determine a template-to-template mapping between discordant regional definitions. Nevertheless, to evaluate the sensitivity of our findings to the regional definitions associated with the AAL, we replicated the above analyses using an alternative regional parcellation scheme comprising 196 cortical and subcortical regions of approximately equal volume (Zalesky et al., 2010).
Results were visualized using the software BrainNet Viewer (Xia et al., 2013).
2.3.5. Statistical analysis: structural connectivity and structure–function relationship
Three networks comprising pairs of regions for which the extent of functional connectivity significantly differed between the patient and control groups were identified (see Results section). For each of these disrupted networks, a network-wide measure of white matter integrity was calculated. This first involved estimating an edge-specific FA value for each constituent connection (based on tractography-delineated masks; see Preprocessing: diffusion weighted data) and then averaging these connection-specific FA values across all connections comprising the disrupted network to yield a single network-wide index quantifying white matter integrity (Fig. 1 for examples of tractography-delineated white matter pathways). For each of the three networks, a two-sample one-tailed t-test was used to test for a reduction in network-wide white matter integrity in the patient group. This enabled assessment of the hypothesis of co-localization of functional and structural connectivity deficits in the schizophrenia connectome.
Fig. 1.
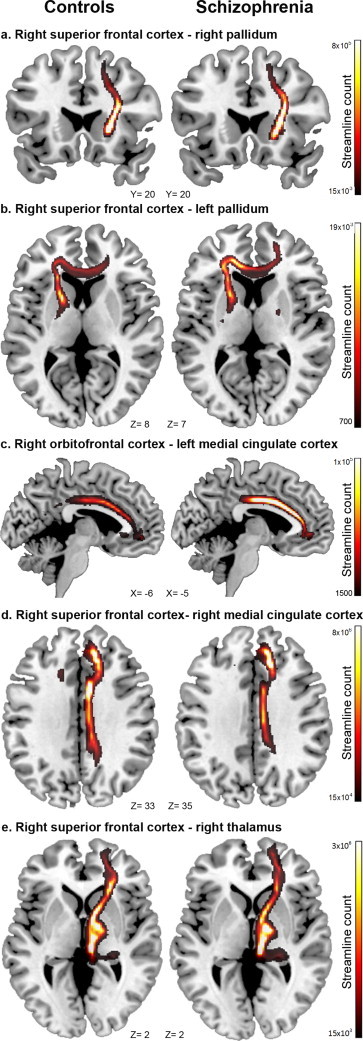
Within each functional network of interest, the average fractional anisotropy (FA) between constituent region-pairs was estimated to provide connection and network-level indices of structural connectivity for each subject. Depicted here are examples of white-matter tractography between 5 region-pairs (relevant to Network 1) in healthy controls and patients with schizophrenia. Visual inspection of tractography outputs was important to exclude problems in fibre tracking. However, our analysis focused on network-level differences and do not allow to declare changes at the level of single connections. Results from confirmatory analyses at the resolution of single connections can be found in Supplementary Fig. 2 (a = #20, b = #19, c = #1, d = #6, e = #22).
For each disrupted network, we further tested for a linear relationship among participants between their levels of functional and structural connectivity. Functional connectivity estimates were averaged over all connections comprising each disrupted network to yield network-wide functional connectivity averages, comparable to determination of network-wide structural connectivity indices (above). Evidence of a linear relationship in these measures of functional and structural connectivity was then assessed for the patient and control groups separately using the Pearson correlation coefficient. Fisher's method (Fisher, 1921) was used to test for between-group differences in the strength of these linear structure–function relationships in each network of interest.
3. Results
3.1. Functional connectivity
Compared to controls, patients with schizophrenia showed altered functional connectivity in three spatially distinct large-scale brain networks (Fig. 2). Reduced functional connectivity was evident in patients in an anterior functional brain network (pFWE = 0.011; Network 1 in Fig. 2). This network comprised 24 brain regions and 29 connections encompassing frontal, fronto-temporal, and fronto-subcortical interactions (Supplementary Table 1). Although changes in functional connectivity involved both brain hemispheres, this network was weighted towards the right hemisphere (Fig. 2). On average, the valence of this network was positive in controls (rmean = 0.11; t16 = 6.1; p < 0.001) and negative in patients (rmean = -0.09; t16 = -6.6; p < 0.001).
Fig. 2.
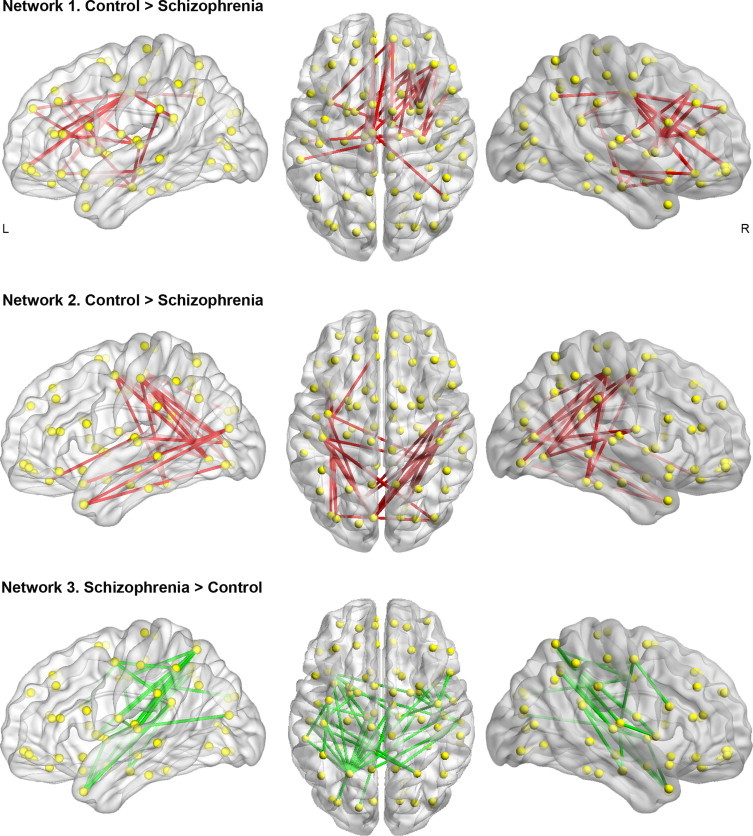
Patients with schizophrenia showed decreased functional connectivity in two distinct brain networks (Network 1 and Network 2). Network 1 encompassed pairwise connectivity between frontal, fronto-temporal, and fronto-striatal regions. Network 2 comprised occipito-parietal, occipito-temporal, and parietal–temporal interactions. In a third network (Network 3), encompassing parieto-temporal connections, patients showed increased functional connectivity compared to healthy controls.
Patients with schizophrenia also showed reduced functional connectivity in a posteriorly localized network (pFWE = 0.017; Network 2 in Fig. 2). This network consisted of 24 connections between 18 regions comprising bilateral fronto-occipital, occipito-temporal, occipito-parietal, and parieto-temporal connections (Fig. 2 and Supplementary Table 1). This difference was explained by a lack of significant functional connectivity in patients (rmean = -0.03; t16 = -1.19; p = 0.25) while positive connectivity was detected in controls (rmean = 0.21; t16 = 5.84; p < 0.001).
Finally, patients showed increased functional connectivity compared to controls in a network primarily encompassing temporo-parietal regions (pFWE = 0.007; Network 3 in Fig. 2). This network encompassed 33 connections between 30 regions and was weighted towards the left hemisphere (Fig. 2 and Supplementary Table 1). Regions encompassing this network were significantly connected in patients (rmean = 0.18; t16 = 11.2; p < 0.001) but not in controls (rmean = -0.05; t16 = -1.78; p = 0.09).
These findings were replicated using an alternative, finer-grained parcellation template comprising 192 cortical and subcortical regions (Supplementary Fig. 1).
It is important to remark that the NBS is a method for performing network level inference, and thus the null hypothesis was rejected for each of the three networks as a whole (p < 0.05), but not for any specific connection comprising any network. In other words, between-group differences cannot be declared at the resolution of individual connections in isolation.
3.2. Structural connectivity
In the first network (Network 1 in Fig. 2), patients showed a trend-level reduction in white matter integrity (t32 = 1.63, p = 0.057, Cohen's d = 0.59; Fig. 3 and Supplementary Fig. 2). On the other hand, comparable between-group white matter integrity was found in Network 2 (t32 = 0.57, p = 0.29, Cohen's d = 0.20). Network 3 displayed the same pattern of results as Network 1, namely a trend-level reduction in white matter integrity in the patient group (t32 = 1.63, p = 0.057, Cohen's d = 0.53).
Fig. 3.
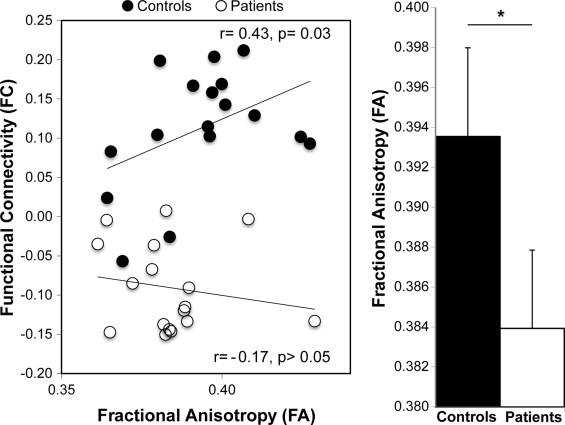
A significant breakdown in the normal relationship between functional and structural brain connectivity was identified only in Network 1. A significant positive association between functional and structural connectivity was found in healthy participants, while this relationship was lost in patients with schizophrenia. In addition, in Network 1, patients with schizophrenia showed a trend-level reduction in fractional anisotropy (FA) compared to healthy controls (*p = 0.057; Cohen's d = 0.59).
3.3. Structure–function relationships
Compared to patients, controls showed a larger correlation between the average functional connectivity and white matter integrity in Network 1 (Z = 1.64, p = 0.044). As depicted in Fig. 3, this difference was driven by a positive function–structure relationship in the control group (r = 0.43, p = 0.032), alongside an absence of correlation in the patient group (r = -0.17). These relationships were corroborated using non-parametric Spearman correlations to account for the impact of any outliers in the data (control rho = 0.40; patient rho = -0.13). No between-group differences in function–structure relationships were found for the second (Z = 0.06, p = 0.48) or the third networks (Z = -1.48, p = 0.93). Confirmatory analyses excluded that these results were driven by major changes in isolated pairwise connections (Supplementary Fig. 2).
Additional analyses were also performed to account for the potential confounding influence of age, gender, IQ, or substance use (detailed inTable 1) on between-group differences. Each variable was included as an additional linear regressor in the NBS model assessing functional connectivity alterations and in the linear regression assessing white-matter differences; partial correlations were performed to account for these effects in structure–function relationships. Each confound was assessed in an independent model. Results indicated that the reported connectivity differences were not explained by variance related to any of these factors. Similarly, metrics of sub-clinical anxiety and depression were not predictive of connectivity or connectivity relationships in either cohort. Additionally, measures of function, structure, and function–structure connectivity coupling in the patient group were not significantly correlated with clinical measures, including PANSS scores, disease chronicity, and medication status. Changes in connectivity observed in patients may therefore point to trait-like, enduring disruptions governing brain structure and function, as opposed to state-like metrics of transient abnormality.
4. Discussion
This study sought to assess the relationship between abnormalities in functional connectivity in schizophrenia and their structural basis. We first identified alterations in functional connectivity across the whole brain using a cross-sectional experimental design in a well-characterized sample of patients with chronic schizophrenia and matched controls. The integrity of the white matter pathways interconnecting the regions comprising the aberrant functional networks, and the relationship between the observed changes in functional connectivity and white matter integrity, were subsequently assessed. We found that alterations in functional interactions related to schizophrenia can be mapped onto both structural deficits and abnormal structure–function relationships in connections involving the fronto-striatal, fronto-temporal, and fronto-thalamic regions. Aberrant patterns of functional connectivity were also identified between occipito-parietal, occipito-temporal, and parieto-temporal connections, but function–structure relationships were relatively preserved in these networks. Our findings confirm the utility of a multimodal structural–functional approach to schizophrenia connectomics (Skudlarski et al., 2010; van den Heuvel et al., 2013).
A number of recent findings from theoretical and empirical studies have shown that structural connectivity constrains patterns of functional connectivity (Honey et al., 2009; Hermundstad et al., 2013; Honey et al., 2007; Hagmann et al., 2010). In line with this principle of brain organization, we have shown co-localized alterations of functional and structural connectivity in two large-scale brain networks. The first network (Network 1, Fig. 2) encompassed the frontal, temporal, thalamic, and striatal regions, while the second network (Network 3, Fig. 2) included regions of the parietal and temporal cortices. Importantly, in the first network, reductions in both functional connectivity and structural connectivity in the patient group occurred in the context of a loss of the normal relationship, relative to the control group, between function and structure (Fig. 3). Similar deficits in functional and structural connectivity between frontal (Cole et al., 2011), fronto-striatal (Fusar-Poli et al., 2011; Fornito et al., 2013), fronto-thalamic (Woodward et al., 2012; Anticevic et al., 2013; Klingner et al., 2014), and fronto-temporal (van den Heuvel et al., 2010; Baker et al., 2014; Khadka et al., 2013) regions have been consistently found in schizophrenia. Specifically, recent research suggests that altered fronto-striatal coupling may be reliable risk phenotypes for psychotic disorders (Fusar-Poli et al., 2011; Fornito et al., 2013; Fusar-Poli et al., 2010). Our results add to previous findings by suggesting that altered dynamics among regions encompassing Network 1 may result from a reduction of the constraints that white matter connectivity pose on brain function.
In contrast to Network 1, reduced structural integrity in temporo-parietal connections encompassing Network 3 was paralleled by enhanced functional connectivity in schizophrenia. This result is consistent with recent findings suggesting that the impact of minor reductions in structural connectivity can be mitigated by an increase in coupling strength among regions comprising the affected network, without significantly changing the relationship between functional and structural connectivity (Cabral et al., 2012). However, temporo-parietal cortices encompassing Network 3 were not functionally integrated in controls. The observed increase in functional integration between temporal and parietal cortices observed in patients may therefore represent a compensatory mechanism induced by more fundamental alterations in the schizophrenia connectome, such as altered integration between regions encompassing Network 1 (Fornito et al., 2013).
Patients with schizophrenia were also characterized by a lack of functional integration between temporal, parietal, and occipital cortices (Network 2). In this network, impaired functional connectivity was found in isolation of significant alterations in the structural integrity of the underlying anatomical pathways and changes in function–structure relationships. Thus, decreased functional integration between regions encompassing Network 2 in patients with schizophrenia might be driven by abnormal synaptic plasticity (Stephan et al., 2009), as opposed to aberrant anatomical connectivity. Accordingly, our findings suggest the existence of common (Network 1) and distinct (Network 2) pathoaetiologies underlying functional and structural changes in the schizophrenia connectome.
A distinct strength of this study was the recruitment of a cohort of individuals suffering from established schizophrenia in the absence of severe symptomatology, significant drug use history, or comorbid psychiatric conditions. As such, many common confounds to schizophrenia research have been mitigated, increasing confidence that the reported results are related to the phenomenology of the disorder. However, the modest number of patients recruited under such stringent criteria did eschew statistical power. This issue was particularly relevant when relating experimental variables to symptom profiles, given both the small number of samples and the low variability inherent to the clinical measures (Table 1). Relating altered function–structure connectivity coupling to symptoms of schizophrenia therefore remains a compelling avenue for future investigation. Replication studies will be important in establishing reliability and determining the extent to which these findings relate to different symptom profiles. In particular, larger sample sizes may uncover more subtle alterations in the schizophrenia connectome and allow inference at more conservative statistical thresholds that account for multiple comparisons in structure–function relationships across networks or individual connections. Although we found no relationships between changes in function, structure, and function–structure coupling and antipsychotic medication (chlorpromazine equivalents) or disease chronicity, the potential impact of medication and illness progression on indices of connectivity and their inter-relationships remains an outstanding question. Similar deficits of brain connectivity to those reported herein have, however, been recently reported in larger samples of non-medicated individuals who have a genetic liability for psychosis, as well as in first-episode psychosis (Fornito et al., 2013; Crossley et al., 2009).
In summary, this study highlights the importance of considering not only the separable impact of functional and structural connectivity deficits in relation to the pathophysiology of schizophrenia, but also the implications of the complex nature of their interaction. We report a convergence of reduced functional connectivity, impaired white matter integrity, and a loss of normal function–structure relationships in a network encompassing frontal, striatal, thalamic, and temporal regions. Together, these findings suggest that anatomical connectivity has less of an influence in constraining functional interactions between these regions in schizophrenia.
Conflicts of interest
All authors report no biomedical financial interests or potential conflicts of interest.
Acknowledgements
This work was supported by a grant from the National and International Research Alliance Program (Queensland State Government, Australia) and NHMRC Project (ID: 1008921) and Program (ID: 566529) grants. A.Z., C.P., and M.Y. were supported by NHMRC Fellowships (A.Z., APP1047648; C.P., 628386; M.Y., 1021973). This study was supported by the Australian Schizophrenia Research Bank (ASRB), which is supported by the NHMRC, the Pratt Foundation, Ramsay Health Care, the Viertel Charitable Foundation and the Schizophrenia Research Institute.
Appendix A. Supplementary material
Supplementary material associated with this article can be found, in the online version, at http://dx.doi.org/10.1016/j.nicl.2014.05.004.
Appendix A. Supplementary materials
References
- Alexander-Bloch A.F., Gogtay N., Meunier D., Birn R., Clasen L., Lalonde F. Disrupted modularity and local connectivity of brain functional networks in childhood-onset schizophrenia, front Syst. Neurosciences. 2010;4:147. doi: 10.3389/fnsys.2010.00147. 21031030 [DOI] [PMC free article] [PubMed] [Google Scholar]
- Anticevic A., Cole M.W., Repovs G., Murray J.D., Brumbaugh M.S., Winkler A.M. Characterizing thalamo-cortical disturbances in schizophrenia and bipolar illness. Cerebral Cortex (New York, N.Y.: 1991) 2013 doi: 10.1093/cercor/bht165. 23825317 [DOI] [PMC free article] [PubMed] [Google Scholar]
- Baker J.T., Holmes A.J., Masters G.A., Yeo B.T., Krienen F., Buckner R.L. Disruption of cortical association networks in schizophrenia and psychotic bipolar disorder. JAMA Psychiatry. 2014;71:109–118. doi: 10.1001/jamapsychiatry.2013.3469. 24306091 [DOI] [PMC free article] [PubMed] [Google Scholar]
- Bassett D.S., Bullmore E., Verchinski B.A., Mattay V.S., Weinberger D.R., Meyer-Lindenberg A. Hierarchical organization of human cortical networks in health and schizophrenia. Journal of Neuroscience: the Official Journal of the Society for Neuroscience. 2008;28:9239–9248. doi: 10.1523/JNEUROSCI.1929-08.2008. 18784304 [DOI] [PMC free article] [PubMed] [Google Scholar]
- Bassett D.S., Nelson B.G., Mueller B.A., Camchong J., Lim K.O. Altered resting state complexity in schizophrenia. Neuroimage. 2012;59:2196–2207. doi: 10.1016/j.neuroimage.2011.10.002. 22008374 [DOI] [PMC free article] [PubMed] [Google Scholar]
- Beck A.T., Steer R.A. Beck Anxiety Inventory Manual. Psych Corp; San Antonio, TX: 1990. [Google Scholar]
- Beck A.T., Ward C.H., Mendelson M., Mock J., Erbaugh J. An inventory for measuring depression. Archives of General Psychiatry. 1961;4:561–571. doi: 10.1001/archpsyc.1961.01710120031004. 13688369 [DOI] [PubMed] [Google Scholar]
- Behrens T.E., Woolrich M.W., Jenkinson M., Johansen-Berg H., Nunes R.G., Clare S. Characterization and propagation of uncertainty in diffusion-weighted MR imaging. Magnetic Resonance in Medicine: Official Journal of the Society of Magnetic Resonance in Medicine / Society of Magnetic Resonance in Medicine. 2003;50:1077–1088. doi: 10.1002/mrm.10609. 14587019 [DOI] [PubMed] [Google Scholar]
- Bora E., Fornito A., Radua J., Walterfang M., Seal M., Wood S.J. Neuroanatomical abnormalities in schizophrenia: a multimodal voxelwise meta-analysis and meta-regression analysis. Schizophrenia Research. 2011;127:46–57. doi: 10.1016/j.schres.2010.12.020. 21300524 [DOI] [PubMed] [Google Scholar]
- Cabral J., Hugues E., Kringelbach M.L., Deco G. Modeling the outcome of structural disconnection on resting-state functional connectivity. Neuroimage. 2012;62:1342–1353. doi: 10.1016/j.neuroimage.2012.06.007. 22705375 [DOI] [PubMed] [Google Scholar]
- Camchong J., MacDonald A.W., 3rd, Bell C., Mueller B.A., Lim K.O. Altered functional and anatomical connectivity in schizophrenia. Schizophrenia Bulletin. 2011;37:640–650. doi: 10.1093/schbul/sbp131. 19920062 [DOI] [PMC free article] [PubMed] [Google Scholar]
- Chao-Gan Y., Yu-Feng Z. DPARSF, a MATLAB toolbox for “pipeline” data analysis of resting-state fMRI. Frontiers in systems neuroscience. 2010;4:13. doi: 10.3389/fnsys.2010.00013. 20577591 [DOI] [PMC free article] [PubMed] [Google Scholar]
- Cocchi L., Zalesky A., Fontenelle L.F. How can connectomics advance our knowledge of psychiatric disorders? Rev Bras Psiquiatr. 34. 2012:131–132. doi: 10.1590/s1516-44462012000200003. [DOI] [PubMed] [Google Scholar]
- Cole M.W., Anticevic A., Repovs G., Barch D. Variable global dysconnectivity and individual differences in schizophrenia. Biological Psychiatry. 2011;70:43–50. doi: 10.1016/j.biopsych.2011.02.010. 21496789 [DOI] [PMC free article] [PubMed] [Google Scholar]
- Collin G., de Reus M.A., Cahn W., Hulshoff Pol H.E., Kahn R.S., van den Heuvel M.P. Disturbed grey matter coupling in schizophrenia. European Neuropsychopharmacology. 2013;23:46–54. doi: 10.1016/j.euroneuro.2012.09.001. [DOI] [PubMed] [Google Scholar]
- Collin G., Hulshoff Pol H.E., Haijma S.V., Cahn W., Kahn R.S., van den Heuvel M.P. Impaired cerebellar functional connectivity in schizophrenia patients and their healthy siblings. Frontiers in Psychiatry. 2011;2:73. doi: 10.3389/fpsyt.2011.00073. 22203807 [DOI] [PMC free article] [PubMed] [Google Scholar]
- Crossley N.A., Mechelli A., Fusar-Poli P., Broome M.R., Matthiasson P., Johns L.C. Superior temporal lobe dysfunction and frontotemporal dysconnectivity in subjects at risk of psychosis and in first-episode psychosis. Human Brain Mapping. 2009;30:4129–4137. doi: 10.1002/hbm.20834. 19530219 [DOI] [PMC free article] [PubMed] [Google Scholar]
- Deco G., Ponce-Alvarez A., Mantini D., Romani G.L., Hagmann P., Corbetta M. Resting-state functional connectivity emerges from structurally and dynamically shaped slow linear fluctuations. Journal of Neuroscience: the Official Journal of the Society for Neuroscience. 2013;33:11239–11252. doi: 10.1523/JNEUROSCI.1091-13.2013. 23825427 [DOI] [PMC free article] [PubMed] [Google Scholar]
- Eack S.M., Newhill C.E. Psychiatric symptoms and quality of life in schizophrenia: a meta-analysis. Schizophrenia Bulletin. 2007;33:1225–1237. doi: 10.1093/schbul/sbl071. 17204532 [DOI] [PMC free article] [PubMed] [Google Scholar]
- Endicott J., Nee J., Harrison W., Blumenthal R. Quality of Life Enjoyment and Satisfaction Questionnaire, a new measure. Psychopharmacology Bulletin. 1993;29:321–326. 8290681 [PubMed] [Google Scholar]
- Filippi M., van den Heuvel M.P., Fornito A., He Y., Hulshoff Pol H.E., Agosta F. Assessment of system dysfunction in the brain through MRI-based connectomics. Lancet Neurology. 2013;12:1189–1199. doi: 10.1016/S1474-4422(13)70144-3. 24120645 [DOI] [PubMed] [Google Scholar]
- First M.B... RL S, MG, JB W. Structured Clinical Interview for DSM-IV Axis I Disorders. American Psychiatric Publishing, Washington, DC (1997)
- Fisher R.A. On the probable error of a coefficient of correlation deduced from a small sample. Metron. 1921;1:3–32. [Google Scholar]
- Fornito A., Harrison B.J. Brain connectivity and mental illness. Frontiers in Psychiatry. 2012;3:72. doi: 10.3389/fpsyt.2012.00072. 22866039 [DOI] [PMC free article] [PubMed] [Google Scholar]
- Fornito A., Harrison B.J., Goodby E., Dean A., Ooi C., Nathan P.J. Functional dysconnectivity of corticostriatal circuitry as a risk phenotype for psychosis. JAMA Psychiatry. 2013;70:1143–1151. doi: 10.1001/jamapsychiatry.2013.1976. 24005188 [DOI] [PubMed] [Google Scholar]
- Fornito A., Yoon J., Zalesky A., Bullmore E.T., Carter C.S. General and specific functional connectivity disturbances in first-episode schizophrenia during cognitive control performance. Biological Psychiatry. 2011;70:64–72. doi: 10.1016/j.biopsych.2011.02.019. 21514570 [DOI] [PMC free article] [PubMed] [Google Scholar]
- Fornito A., Yucel M., Patti J., Wood S.J., Pantelis C. Mapping grey matter reductions in schizophrenia: an anatomical likelihood estimation analysis of voxel-based morphometry studies. Schizophrenia Research. 2009;108:104–113. doi: 10.1016/j.schres.2008.12.011. 19157788 [DOI] [PubMed] [Google Scholar]
- Fornito A., Zalesky A., Pantelis C., Bullmore E.T. Schizophrenia, neuroimaging and connectomics. Neuroimage. 2012;62:2296–2314. doi: 10.1016/j.neuroimage.2011.12.090. 22387165 [DOI] [PubMed] [Google Scholar]
- Friston K. Disconnection and cognitive dysmetria in schizophrenia. American Journal of Psychiatry. 2005;162:429–432. doi: 10.1176/appi.ajp.162.3.429. 15741456 [DOI] [PubMed] [Google Scholar]
- Friston K.J., Frith C.D. Schizophrenia: a disconnection syndrome? Clinical Neuroscience (New York, N.Y.) 1995;3:89–97. 7583624 [PubMed] [Google Scholar]
- Fusar-Poli P., Howes O.D., Allen P., Broome M., Valli I., Asselin M.C. Abnormal frontostriatal interactions in people with prodromal signs of psychosis: a multimodal imaging study. Archives of General Psychiatry. 2010;67:683–691. doi: 10.1001/archgenpsychiatry.2010.77. 20603449 [DOI] [PubMed] [Google Scholar]
- Fusar-Poli P., Howes O.D., Allen P., Broome M., Valli I., Asselin M.C. Abnormal prefrontal activation directly related to pre-synaptic striatal dopamine dysfunction in people at clinical high risk for psychosis. Molecular Psychiatry. 2011;16:67–75. doi: 10.1038/mp.2009.108. 19949389 [DOI] [PubMed] [Google Scholar]
- Hagmann P., Cammoun L., Gigandet X., Gerhard S., Grant P.E., Wedeen V. MR connectomics: principles and challenges. Journal of Neuroscience Methods. 2010;194:34–45. doi: 10.1016/j.jneumeth.2010.01.014. 20096730 [DOI] [PubMed] [Google Scholar]
- Hermundstad A.M., Bassett D.S., Brown K.S., Aminoff E.M., Clewett D., Freeman S. Structural foundations of resting-state and task-based functional connectivity in the human brain. Proceedings of the National Academy of Sciences of the United States of America. 2013;110:6169–6174. doi: 10.1073/pnas.1219562110. 23530246 [DOI] [PMC free article] [PubMed] [Google Scholar]
- Honey C.J., Kotter R., Breakspear M., Sporns O. Network structure of cerebral cortex shapes functional connectivity on multiple time scales. Proceedings of the National Academy of Sciences of the United States of America. 2007;104:10240–10245. doi: 10.1073/pnas.0701519104. 17548818 [DOI] [PMC free article] [PubMed] [Google Scholar]
- Honey C.J., Sporns O., Cammoun L., Gigandet X., Thiran J.P., Meuli R. Predicting human resting-state functional connectivity from structural connectivity. Proceedings of the National Academy of Sciences of the United States of America. 2009;106:2035–2040. doi: 10.1073/pnas.0811168106. 19188601 [DOI] [PMC free article] [PubMed] [Google Scholar]
- Insel T.R., Wang P.S. Rethinking mental illness. JAMA: the Journal of the American Medical Association. 2010;303:1970–1971. doi: 10.1001/jama.2010.555. 20483974 [DOI] [PubMed] [Google Scholar]
- Jenkinson M., Smith S. A global optimisation method for robust affine registration of brain images. Medical image Analysis. 2001;5:143–156. doi: 10.1016/s1361-8415(01)00036-6. 11516708 [DOI] [PubMed] [Google Scholar]
- Jones D.K., Cercignani M. Twenty-five pitfalls in the analysis of diffusion MRI data. NMR in Biomedicine. 2010;23:803–820. doi: 10.1002/nbm.1543. 20886566 [DOI] [PubMed] [Google Scholar]
- Kay S.R., Fiszbein A., Opler L.A. The Positive and Negative Syndrome Scale (PANSS) for schizophrenia. Schizophrenia Bulletin. 1987;13:261–276. doi: 10.1093/schbul/13.2.261. 3616518 [DOI] [PubMed] [Google Scholar]
- Keller C.J., Bickel S., Honey C.J., Groppe D.M., Entz L., Craddock R.C. Neurophysiological investigation of spontaneous correlated and anticorrelated fluctuations of the BOLD signal. Journal of Neuroscience: the Official Journal of the Society for Neuroscience. 2013;33:6333–6342. doi: 10.1523/JNEUROSCI.4837-12.2013. 23575832 [DOI] [PMC free article] [PubMed] [Google Scholar]
- Khadka S., Meda S.A., Stevens M.C., Glahn D.C., Calhoun V.D., Sweeney J.A. Is aberrant functional connectivity a psychosis endophenotype? A resting state functional magnetic resonance imaging study. Biological Psychiatry. 2013;74:458–466. doi: 10.1016/j.biopsych.2013.04.024. 23746539 [DOI] [PMC free article] [PubMed] [Google Scholar]
- Klingner C.M., Langbein K., Dietzek M., Smesny S., Witte O.W., Sauer H. Thalamocortical connectivity during resting state in schizophrenia. European Archives of Psychiatry and Clinical Neuroscience. 2014;264:111–119. doi: 10.1007/s00406-013-0417-0. 23892770 [DOI] [PubMed] [Google Scholar]
- Kochunov P., Thompson P.M., Lancaster J.L., Bartzokis G., Smith S., Coyle T. Relationship between white matter fractional anisotropy and other indices of cerebral health in normal aging: tract-based spatial statistics study of aging. Neuroimage. 2007;35:478–487. doi: 10.1016/j.neuroimage.2006.12.021. 17292629 [DOI] [PubMed] [Google Scholar]
- Leucht S., Kane J.M., Kissling W., Hamann J., Etschel E., Engel R.R. What does the PANSS mean? Schizophrenia Research. 2005;79:231–238. doi: 10.1016/j.schres.2005.04.008. 15982856 [DOI] [PubMed] [Google Scholar]
- Liu Y., Liang M., Zhou Y., He Y., Hao Y., Song M. Disrupted small-world networks in schizophrenia. Brain: a Journal of Neurology. 2008;131:945–961. doi: 10.1093/brain/awn018. 18299296 [DOI] [PubMed] [Google Scholar]
- Lynall M.E., Bassett D.S., Kerwin R., McKenna P.J., Kitzbichler M., Muller U. Functional connectivity and brain networks in schizophrenia. Journal of Neuroscience: the Official Journal of the Society for Neuroscience. 2010;30:9477–9487. doi: 10.1523/JNEUROSCI.0333-10.2010. 20631176 [DOI] [PMC free article] [PubMed] [Google Scholar]
- Pettersson-Yeo W., Allen P., Benetti S., McGuire P., Mechelli A. Dysconnectivity in schizophrenia: where are we now? Neuroscience and Biobehavioral Reviews. 2011;35:1110–1124. doi: 10.1016/j.neubiorev.2010.11.004. 21115039 [DOI] [PubMed] [Google Scholar]
- Pierpaoli C., Basser P.J. Toward a quantitative assessment of diffusion anisotropy. Magnetic Resonance in Medicine: Official Journal of the Society of Magnetic Resonance in Medicine / Society of Magnetic Resonance in Medicine. 1996;36:893–906. doi: 10.1002/mrm.1910360612. 8946355 [DOI] [PubMed] [Google Scholar]
- Power J.D., Barnes K.A., Snyder A.Z., Schlaggar B.L., Petersen S.E. Spurious but systematic correlations in functional connectivity MRI networks arise from subject motion. Neuroimage. 2012;59:2142–2154. doi: 10.1016/j.neuroimage.2011.10.018. 22019881 [DOI] [PMC free article] [PubMed] [Google Scholar]
- Power J.D., Mitra A., Laumann T.O., Snyder A.Z., Schlaggar B.L., Petersen S.E. Methods to detect, characterize, and remove motion artifact in resting state fMRI. NeuroImage. 2014;84:320–341. doi: 10.1016/j.neuroimage.2013.08.048. 23994314 [DOI] [PMC free article] [PubMed] [Google Scholar]
- Ritsner M., Kurs R., Gibel A., Ratner Y., Endicott J. Validity of an abbreviated Quality of Life Enjoyment and Satisfaction Questionnaire (Q-LES-Q-18) for schizophrenia, schizoaffective, and mood disorder patients. Quality of Life Research: An international Journal of Quality of Life Aspects of Treatment, Care and Rehabilitation. 2005;14:1693–1703. doi: 10.1007/s11136-005-2816-9. 16119181 [DOI] [PubMed] [Google Scholar]
- Rubinov M., Knock S.A., Stam C.J., Micheloyannis S., Harris A.W., Williams L.M. Small-world properties of nonlinear brain activity in schizophrenia. Human Brain Mapping. 2009;30:403–416. doi: 10.1002/hbm.20517. 18072237 [DOI] [PMC free article] [PubMed] [Google Scholar]
- Shepherd A.M., Laurens K.R., Matheson S.L., Carr V.J., Green M.J. Systematic meta-review and quality assessment of the structural brain alterations in schizophrenia. Neuroscience and Biobehavioral Reviews. 2012;36:1342–1356. doi: 10.1016/j.neubiorev.2011.12.015. 22244985 [DOI] [PubMed] [Google Scholar]
- Skudlarski P., Jagannathan K., Anderson K., Stevens M.C., Calhoun V.D., Skudlarska B.A. Brain connectivity is not only lower but different in schizophrenia: a combined anatomical and functional approach. Biological Psychiatry. 2010;68:61–69. doi: 10.1016/j.biopsych.2010.03.035. 20497901 [DOI] [PMC free article] [PubMed] [Google Scholar]
- Skudlarski P., Jagannathan K., Calhoun V.D., Hampson M., Skudlarska B.A., Pearlson G. Measuring brain connectivity: diffusion tensor imaging validates resting state temporal correlations. Neuroimage. 2008;43:554–561. doi: 10.1016/j.neuroimage.2008.07.063. 18771736 [DOI] [PMC free article] [PubMed] [Google Scholar]
- Sporns O. Discovering the human connectome. MIT press; Cambridge, MA: 2012. [Google Scholar]
- Sporns O. Networks of the Brain. first edition. MIT Press; Cambridge, MA: 2011. [Google Scholar]
- Stephan K.E., Baldeweg T., Friston K.J. Synaptic plasticity and disconnection in schizophrenia. Biological Psychiatry. 2006;59:929–939. doi: 10.1016/j.biopsych.2005.10.005. 16427028 [DOI] [PubMed] [Google Scholar]
- Stephan K.E., Friston K.J., Frith C.D. Disconnection in schizophrenia: from abnormal synaptic plasticity to failures of self-monitoring. Schizophrenia Bulletin. 2009;35:509–527. doi: 10.1093/schbul/sbn176. 19155345 [DOI] [PMC free article] [PubMed] [Google Scholar]
- Tzourio-Mazoyer N., Landeau B., Papathanassiou D., Crivello F., Etard O., Delcroix N. Automated anatomical labeling of activations in SPM using a macroscopic anatomical parcellation of the MNI MRI single-subject brain. NeuroImage. 2002;15:273–289. doi: 10.1006/nimg.2001.0978. 11771995 [DOI] [PubMed] [Google Scholar]
- van den Heuvel M.P., Mandl R.C., Stam C.J., Kahn R.S., Hulshoff Pol H.E. Aberrant frontal and temporal complex network structure in schizophrenia: a graph theoretical analysis. Journal of Neuroscience: the Official Journal of the Society for Neuroscience. 2010;30:15915–15926. doi: 10.1523/JNEUROSCI.2874-10.2010. 21106830 [DOI] [PMC free article] [PubMed] [Google Scholar]
- van den Heuvel M.P., Sporns O., Collin G., Scheewe T., Mandl R.C., Cahn W. Abnormal rich club organization and functional brain dynamics in schizophrenia. JAMA Psychiatry. 2013;70:783–792. doi: 10.1001/jamapsychiatry.2013.1328. 23739835 [DOI] [PubMed] [Google Scholar]
- Wang J., Zuo X., He Y. Graph-based network analysis of resting-state functional MRI, front Syst. Neurosciences. 2010;4:16. doi: 10.3389/fnsys.2010.00016. 20589099 [DOI] [PMC free article] [PubMed] [Google Scholar]
- Wechsler D. Wechsler Abbreviated Scale of Intelligence Manual. Psychological Corp; San Antonio, TX: 1999. [Google Scholar]
- Woodward N.D., Karbasforoushan H., Heckers S. Thalamocortical dysconnectivity in schizophrenia. American Journal of Psychiatry. 2012;169:1092–1099. doi: 10.1176/appi.ajp.2012.12010056. 23032387 [DOI] [PMC free article] [PubMed] [Google Scholar]
- Xia M., Wang J., He Y. BrainNet Viewer: a network visualization tool for human brain connectomics. PloS One. 2013;8:e68910. doi: 10.1371/journal.pone.0068910. 23861951 [DOI] [PMC free article] [PubMed] [Google Scholar]
- Yan H., Tian L., Yan J., Sun W., Liu Q., Zhang Y.B. Functional and anatomical connectivity abnormalities in cognitive division of anterior cingulate cortex in schizophrenia. PLOS ONE. 2012;7:e45659. doi: 10.1371/journal.pone.0045659. 23049832 [DOI] [PMC free article] [PubMed] [Google Scholar]
- Zalesky A., Cocchi L., Fornito A., Murray M.M., Bullmore E. Connectivity differences in brain networks. NeuroImage. 2012;60:1055–1062. doi: 10.1016/j.neuroimage.2012.01.068. 22273567 [DOI] [PubMed] [Google Scholar]
- Zalesky A., Fornito A., Bullmore E.T. Network-based statistic: identifying differences in brain networks. NeuroImage. 2010;53:1197–1207. doi: 10.1016/j.neuroimage.2010.06.041. 20600983 [DOI] [PubMed] [Google Scholar]
- Zalesky A., Fornito A., Harding I.H., Cocchi L., Yucel M., Pantelis C. Whole-brain anatomical networks: does the choice of nodes matter? NeuroImage. 2010;50:970–983. doi: 10.1016/j.neuroimage.2009.12.027. 20035887 [DOI] [PubMed] [Google Scholar]
- Zalesky A., Fornito A., Seal M.L., Cocchi L., Westin C.F., Bullmore E.T. Disrupted axonal fiber connectivity in schizophrenia. Biological Psychiatry. 2011;69:80–89. doi: 10.1016/j.biopsych.2010.08.022. 21035793 [DOI] [PMC free article] [PubMed] [Google Scholar]
Associated Data
This section collects any data citations, data availability statements, or supplementary materials included in this article.