

Abstract
Background
Violence that leads to homicide results in an extreme financial and emotional burden on society. Juveniles who commit homicide are often tried in adult court and typically spend the majority of their lives in prison. Despite the enormous costs associated with homicidal behavior, there have been no serious neuroscientific studies examining youth who commit homicide.
Methods
Here we use neuroimaging and voxel-based morphometry to examine brain gray matter in incarcerated male adolescents who committed homicide (n = 20) compared with incarcerated offenders who did not commit homicide (n = 135). Two additional control groups were used to understand further the nature of gray matter differences: incarcerated offenders who did not commit homicide matched on important demographic and psychometric variables (n = 20) and healthy participants from the community (n = 21).
Results
Compared with incarcerated adolescents who did not commit homicide (n = 135), incarcerated homicide offenders had reduced gray matter volumes in the medial and lateral temporal lobes, including the hippocampus and posterior insula. Feature selection and support vector machine learning classified offenders into the homicide and non-homicide groups with 81% overall accuracy.
Conclusions
Our results indicate that brain structural differences may help identify those at the highest risk for committing serious violent offenses.
Keywords: Voxel-based morphometry (VBM), Magnetic resonance imaging (MRI), Incarcerated adolescents, Pattern classifier, Support vector machine (SVM), Gray matter volume
Highlights
-
•
Homicide offenders had reduced gray matter volumes in medial/lateral temporal lobes.
-
•
Specific areas of reduction included the hippocampus and posterior insula.
-
•
Support vector machine learning classified offenders with 81% overall accuracy.
1. Introduction
Estimates of the financial burden of homicide exceed $17 million per offense, including costs associated with policing, prosecution, incarceration, and lost productivity (DeLisi et al., 2010). With approximately 15,000 homicides committed each year (Murphy et al., 2013), the fiscal cost of homicide in the U.S. was over $250 billion in 2011 alone. And whereas the financial burden of homicide is staggering, these figures do not capture the emotional toll on the 9.3% of U.S. adults who have been directly affected by homicide experience (Armour and Umbreit, 2007).
Adolescence is a time of significant biological, cognitive, and neural changes (Sweeten et al., 2013), and is sometimes associated with reckless, irresponsible, delinquent, and at times, violent behavior. Most adolescents age out of this type of behavior, but a small percentage of youth continue this antisociality into adulthood and are referred to as being on the “life-course persistent” trajectory (Moffitt, 1993). Research that attempts to identify youth at the highest risk of committing serious and violent crimes as adolescents and/or adults could be particularly valuable for prevention and treatment efforts (Hawkins et al., 2000; Davidson et al., 2000).
Callous and unemotional (CU) traits and poor behavioral control (i.e., conduct disorder) are risk factors for youth who might be on the life course persistent trajectory of antisocial behavior and lifelong personality problems (Corrado et al., 2004). Recent neuroimaging research has shown that youth who demonstrate such problematic behavior have reduced gray matter in critical cognitive control and emotional brain regions. For instance, one study found that male youth with conduct disorder (CD; n = 12) displayed reduced gray matter volumes in the left amygdala and anterior insula bilaterally compared to healthy controls (n = 12), and that these reductions were specifically related to aggressive behavior (Sterzer et al., 2007). In another recent study, adolescent males with CD (n = 23) had reduced gray matter volumes in the left orbitofrontal cortex and bilateral temporal lobes, as well as the left amygdala and hippocampus. Overall, the CD group had 6% less gray matter volume than healthy controls (Huebner et al., 2008). In a large sample of incarcerated adolescent males (n = 191), Ermer et al. (2013) found gray matter reductions related to high CU/CD traits in the orbitofrontal cortex, posterior cingulate, parahippocampal cortex, and temporal poles. Similar research in adults has identified gray matter reductions primarily in the orbitofrontal cortex (de Oliveira-Souza et al., 2008; Ermer et al., 2012; Tiihonen et al., 2008), temporal cortex (de Oliveira-Souza et al., 2008; Ermer et al., 2012), and limbic areas (Ermer et al., 2012) related to callous and unemotional traits and impulsive behaviors (i.e., psychopathic traits).
Despite these recent advancements, no studies have sought to examine whether youth who commit homicide have any unique gray matter abnormalities relative to comparison youth. To begin to address this issue we analyzed structural magnetic resonance imaging (MRI) data to examine brain gray matter differences in incarcerated adolescent males who committed homicide (n = 20) versus incarcerated adolescent males who did not (n = 135). We also compared the homicide offenders (n = 20) to a subsample of matched non-homicide offenders (n = 20) as well as to a group of non-incarcerated healthy adolescent controls. The non-homicide offenders (n = 20) were matched with the homicide offenders (n = 20) on the following variables: IQ, age at scan, number of traumatic brain injuries with loss of consciousness, Hare Psychopathy Checklist: Youth Version Total, Factor 1, and Factor 2 scores, substance dependence, years of regular substance use, psychiatric diagnoses, and violent, non-violent, drug, and total number of convictions. We hypothesized that youth who commit homicide represent youth with more profound callous and unemotional traits and poor behavioral controls and thus we expected these youth to show gray matter abnormalities in paralimbic regions.
2. Materials and methods
2.1. Participants
These data were drawn from the National Institute of Mental Health (NIMH)-funded SouthWest Advanced Neuroimaging Cohort, Youth Sample (SWANC-Y), collected between June 2007 and March 2011, from ongoing research studies at a maximum-security youth detention facility in New Mexico. The present study reports on a subsample of the participants from Ermer et al. (2013) (all males; n = 155) for whom official criminal records and self-report criminal activity were available (mean age = 17.5 years, SD = 1.14; 78.1% Hispanic, 14.2% white; 89.0% right-handed). Within this sample, individuals whose official state criminal records included a murder conviction (n = 4) or who self-reported killing another person without being convicted during confidential research interviews (n = 16) were classified as homicide offenders (n = 20); all others were classified as non-homicide offenders (n = 135). Non-homicide offenders included those who had committed serious violent crimes such as rape and assault, and non-violent crimes such as burglary, theft, fraud, and drug possession/distribution. In addition, we report data from n = 21 male healthy adolescent non-offender controls drawn from the community (mean age = 16.4 years, SD = 2.07; 38.6% Hispanic, 47.6% white; 90.5% right-handed).
This research was approved by the University of New Mexico Health Sciences Center Human Research Review Committee and all individuals volunteered to participate after providing written informed consent (if =18 years of age) or after providing written informed assent and parent/guardian written informed consent (if <18 years of age). Participation did not affect institutional status (e.g., security level, privileges, parole or release date). Participants were excluded from participation if they had a history of seizures, epilepsy, psychosis, traumatic brain injury, other major medical problems, or failed to show fluency in English at or above a grade four reading level.
2.2. Assessments
2.2.1. Psychopathy
All offenders were assessed for psychopathy (i.e., callous and unemotional traits and impulsive/antisocial behaviors) using the expert-rater Hare Psychopathy Checklist: Youth Version (Forth et al., 2003). The PCL:YV assessment includes a review of institutional records and a semi-structured interview that reviews individuals' school, family, work, and criminal histories, and their interpersonal and emotional skills. Individuals are scored on 20 items that measure personality traits and behaviors characteristic of psychopathy. Scores range from 0 to 40. For adults, the accepted diagnostic cutoff for psychopathy is 30 and above (Hare, 2003). Psychopathy includes interpersonal and affective traits, such as glibness, shallow affect, callousness, and lacking guilt and remorse (Factor 1) and lifestyle and antisocial traits, such as impulsivity, irresponsibility, and poor behavioral controls (Factor 2). The PCL:YV was not administered in the healthy sample.
2.2.2. Substance use
We calculated the total number of substances (alcohol and drug) for which an individual met the lifetime dependence diagnostic criteria from the Kiddie Schedule for Affective Disorders and Schizophrenia (KSADS) (Kaufman et al., 1997) (“substance dependence”). A modified version of the Addiction Severity Index (McLellan et al., 1992) was also administered. Years of regular use were summed for each substance (alcohol and drug) that the participant reported using regularly (i.e., three or more times per week for a minimum period of 1 month) (“regular substance use”). Healthy control participants from the community were excluded if they self-reported any substance use.
2.2.3. Other measures
Median household income for each participant's home zip code was used as a proxy for socioeconomic status (SES). Full-scale IQ was estimated from the Vocabulary and Matrix Reasoning subtests of the Wechsler Adult Intelligence Scale (Wechsler, 1997; Ryan et al., 1999) for participants older than 16 years of age and from the Wechsler Intelligence Scale for Children—Fourth Edition (Wechsler, 2003; Sattler and Dumont, 2004) for participants younger than 16 years of age. Means and standard deviations are given in Table 1. IQ estimates were unavailable for n = 7 in the non-homicide offender group and n = 1 in the healthy group.
Table 1.
Demographic and assessment variables.
| Subject group |
|||||
|---|---|---|---|---|---|
| Variable | Homicide offender (A) | Non-homicide offender (B) | Non-homicide offender (matched) (C) | Healthy (D) | Significant group differencesa |
| n | 20 | 135 | 20 | 21 | – |
| SES | $30,648.75 (6742.96) |
$32,354.08 (6904.08) |
$33,488.26 (6998.76) |
$46,764.75 (17,793.87) |
D > A t(38) = 3.79 p = .001 |
| Age at scan, in years | 17.4 (1.21) range 14.9–19.0 |
17.5 (1.13) range 13.8–19.2 |
17.5 (1.32) range 14.9–19.2 |
16.4 (2.07) range 12.8–19.0 |
A > D t(39) = 2.04 p = .049 |
| IQ | 93.0 (9.25) | 92.8 (12.57) | 95.6 (13.84) | 110.6 (16.73) | D > A t(38) = 4.12 p < .001 |
| PCL:YV total | 29.1 (5.24) | 23.1 (6.05) | 28.8 (2.49) | – | A > B t(153) = 4.26 p < .001 |
| Factor 1 | 9.8 (2.69) | 6.2 (2.80) | 8.6 (1.95) | – | A > B t(153) = 5.39 p < .001 |
| Factor 2 | 12.9 (2.01) | 11.3 (2.78) | 13.4 (0.99) | – | A > B t(153) = 2.57 p = .011 |
| Substance dependence | 3.4 (1.72) | 2.1 (1.50) | 3.8 (1.54) | 0 (0.0) | A > B t(153) = 3.43 p = .001 A > D t(38) = 8.68 p < .001 |
| Regular substance use | 9.4 (6.99) | 6.1 (4.61) | 8.7 (5.06) | 0 (0.0) | A > B t(151) = 2.77 p = .006 A > D t(39) = 6.15 p < .001 |
| Brain volume | 1209.79 (59.41) | 1271.96 (98.14) | 1279.53 (95.50) | 1306.23 (88.61) | B > A t(153) = 2.76 p = .007 C > A t(38) = 2.77 p = .009 D > A t(39) = 4.07 p < .001 |
| Gray matter | 728.59 (39.85) | 767.36 (60.00) | 763.62 (58.63) | 808.66 (46.28) | B > A t(153) = 2.80 p = .006 C > A t(38) = 2.21 p = .033 D > A t(39) = 5.92 p < .001 |
| White matter | 481.20 (29.86) | 504.60 (48.49) | 515.90 (48.97) | 497.57 (52.62) | B > A t(153) = 2.10 p = .038 C > A t(38) = 2.71 p = .010 |
| ICU | 30.0 (8.12) | 27.4 (9.97) | 32.0 (9.63) | – | n.s. |
| BIS-11 | 72.6 (10.77) | 70.0 (10.30) | 73.8 (11.35) | – | n.s. |
| TBIs with LOC | 1.1 (0.97) | 0.7 (0.99) | 1.1 (1.33) | 0.2 (0.40) | A > D t(39) = 3.96 p < .001 |
| Criminal convictions | |||||
| Total | 6.2 (4.86) | 8.1 (8.23) | 7.6 (6.20) | – | n.s. |
| Violent | 2.0 (3.43) | 1.4 (1.62) | 1.6 (1.54) | – | n.s. |
| Non-violent | 4.6 (3.88) | 7.0 (7.95) | 6.3 (5.83) | – | n.s. |
| Drug | 0.3 (0.57) | 0.3 (0.72) | 0.2 (0.37) | – | n.s. |
| KSADS diagnosesb | |||||
| PTSD: past/current/none |
1/4/15 | 2/7/126 | 1/0/19 | 0/0/21 | A vs. B p = .021 A vs. D p = .021 |
| Anxiety disorders: past/current/none |
2/2/16 | 4/5/126 | 0/0/20 | 0/0/21 | A vs. D p = .048 |
| Depressive disorders: past/current/none |
5/1/14 | 15/5/115 | 4/1/15 | 0/0/21 | A vs. D p = .009 |
| ADHD: past/current/none |
3/0/17 | 13/5/117 | 2/1/17 | 0/0/21 | n.s. |
| ODD/CD: past/current/none |
18/2/0 | 119/12/4 | 20/0/0 | 0/0/21 | A vs. D p < .001 |
Note. Numbers are means or counts with standard deviations in parentheses and ranges where appropriate. SES = socioeconomic status; PCL:YV = Psychopathy Checklist: Youth Version (Forth et al., 2003); ICU = Inventory of Callous-Unemotional Traits (Essau et al., 2006); BIS-11 = Barratt's Impulsiveness Scale (Patton et al., 1995); TBI = traumatic brain injury; LOC = loss of consciousness; KSADS = Kiddie Schedule for Affective Disorders and Schizophrenia (Kaufman et al., 1997); PTSD = post-traumatic stress disorder. ADHD = attention-deficit/hyperactivity disorder. ODD/CD = oppositional defiant disorder/conduct disorder. n.s. = nonsignificant.
Independent-samples two-sided t-tests were conducted for A vs. B, A vs. C, and A vs. D unless otherwise noted.
Group comparisons for KSADS diagnoses used two-sided Fisher's exact tests. Comparisons that are not reported were nonsignificant.
Trained researchers administered a post-head injury symptoms questionnaire (King et al., 1995) to evaluate history of traumatic brain injury (TBI). Number of TBIs with loss of consciousness (LOC) is reported. The Inventory of Callous-Unemotional Traits (Youth Self-Report Version; ICU, (Essau et al., 2006)) and Barratt's Impulsiveness Scale (BIS-11, (Patton et al., 1995)) were also administered to the incarcerated samples.
From the KSADS, offenders with a history of psychosis or bipolar disorders were excluded from further participation. Among non-homicide offenders, 3% met KSADS criteria for a past anxiety disorder and 3.7% met the criteria for a current anxiety disorder, 11.1% met the criteria for a past depressive disorder and 3.7% met the criteria for a current depressive disorder, 9.6% met the criteria for past attention deficit-hyperactivity disorder (ADHD) and 3.7% met the criteria for current ADHD, 88.1% met the criteria for past oppositional defiant (ODD) or conduct disorders (CD) and 8.9% met the criteria for current ODD/CD, and 1.5% met the criteria for past post-traumatic stress disorder (PTSD) and 5.2% met the criteria for current PTSD. Among homicide offenders, these percentages were: 10% past and 10% current anxiety disorder; 25% past and 5% current depressive disorder; 15% past and 0% current ADHD; 90% past and 10% current ODD/CD; and 5% past and 20% current PTSD. Homicide offenders did not differ from non-homicide offenders on “past,” “present,” or “none” proportions for anxiety disorders (p = .097), depressive disorders (p = .155), ADHD (p = .611), or ODD/CD (p = 1.000). Homicide offenders did differ from non-homicide offenders on PTSD diagnoses (p = .021). No one in the healthy sample met KSADS criteria for any of these disorders.
2.3. MRI acquisition
High-resolution T1-weighted structural MRI scans were acquired on the Mind Research Network Siemens 1.5 T Avanto mobile scanner, stationed at the detention facility (for offenders) or Mind Research Network headquarters (for healthy controls), using a multi-echo MPRAGE pulse sequence (repetition time = 2530 ms, echo times = 1.64 ms, 3.50 ms, 5.36 ms, 7.22 ms, inversion time = 1100 ms, flip angle = 7°, slice thickness = 1.3 mm, matrix size = 256 × 256) yielding 128 sagittal slices with an in-plane resolution of 1.0 × 1.0 mm. Data were pre-processed and analyzed using Statistical Parametric Mapping software (SPM5; Wellcome Department of Cognitive Neurology, London, UK; http://www.fil.ion.ucl.ac.uk/spm) and voxel-based morphometry. T1 images were manually inspected by an operator blind to subject identity and realigned to ensure proper spatial normalization. Images were spatially normalized to the SPM5 T1 Montreal Neurological Institute (MNI) template, segmented into gray matter, white matter, and cerebrospinal fluid, and modulated to preserve total volume (Ashburner and Friston, 2000; Ashburner and Friston, 2005). The modulated, normalized gray matter segments were then averaged to create a customized, study-specific template. Next, the original gray matter segments were normalized to the customized template. Finally, the images were resampled to 2 × 2 × 2 mm and smoothed with a 10 mm full-width at half-maximum (FWHM) Gaussian kernel. Voxels with a gray matter value of <.15 were excluded in order to remove possible edge effects between gray matter and white matter.
2.4. Whole brain analysis
Two-sample t-tests were performed on a voxel-by-voxel basis over the whole brain using the general linear model to evaluate differences in regional gray matter volumes between homicide (n = 20) and non-homicide (n = 135) offenders, homicide (n = 20) and matched non-homicide offenders (n = 20; Supplemental information), and homicide offenders (n = 20) and healthy non-offenders (n = 21; Supplemental information). Following Ermer and colleagues (Ermer et al., 2013; Ermer et al., 2012), we conducted Monte Carlo simulations in AlphaSim (Ward, 2000) to determine that a 1427 voxel extent at a height threshold of p < .05 uncorrected yielded a family-wise error rate (FWE) corrected threshold of p < .05, accounting for spatial correlations between gray matter volumes in neighboring voxels.
The homicide (n = 20) versus non-homicide (n = 135) offender comparison was made using two separate models: the first was conducted without covariates to determine the regional specificity of reduced overall gray matter volumes in the homicide offender group; the second was conducted with brain volume (i.e., gray matter plus white matter), PCL:YV total scores, and substance dependence as covariates. These variables differed significantly between offender groups (Table 1).
The homicide (n = 20) versus a matched non-homicide (n = 20) offender subsample comparison as well as the homicide offenders (n = 20) versus healthy non-offenders used brain volume as a covariate, as this value differed significantly between groups (Table 1).
2.5. Support vector machine learning classification
Each incarcerated participant was classified as either a homicide offender or a non-homicide offender using built-in support vector machine (SVM; (Burges, 1998; Cortes and Vapnik, 1995; Melgani and Bruzzone, 2004)) functions in MATLAB 7.12.0 (The MathWorks, Inc.). SVM is a sophisticated pattern classifier and is advantageous over other methodologies because it allows for non-linear effects (here we used a radial basis function [RBF] non-linear kernel).
Simple sequential backward feature selection (Jain et al., 2000) was used to select a set of variables from assessment variables and brain regions of interest (ROIs) for classifying individuals into groups (i.e., homicide offenders [n = 20] versus non-homicide offenders [n = 135]). Simple sequential backward feature selection is an iterative method that begins with all variables included and proceeds by dropping one feature at each iteration until the model cannot be further improved. MRI regions of interest from an independent sample of adult males (Ermer et al., 2012) were used in the present classification analyses. These regions have been identified as being related to psychopathy, which is strongly associated with violent recidivism. ROIs from a fully independent sample were used so as to avoid biasing the classifier and artificially inflating the ability of brain regions to discriminate groups (cf. (Vul et al., 2009). These regions were chosen for this initial classification analysis to help identify which assessment variables and brain regions are important for distinguishing the youth at the highest risk for committing the most serious offenses.
Of the nine ROIs (left and right lateral orbitofrontal cortex, medial orbitofrontal cortex, anterior and posterior cingulate, left and right temporal pole, and left and right parahippocampal cortex) and nine assessment variables (IQ, age, PCL:YV Factor 1, PCL:YV Factor 2, years of regular substance use, total number of convictions, BIS-11, ICU, and SES), six ROIs and three assessment variables were identified as useful predictors. The selected variables were: left lateral orbital frontal cortex, medial orbital frontal cortex, anterior and posterior cingulate, right and left temporal pole, PCL:YV Factor 1, total number of convictions, and SES. Feature selection was also run including brain volume. The identified variables were age, PCL:YV Factor 1, PCL:YV Factor 2, years of regular substance use, total number of convictions, ICU, SES, brain volume, left and right lateral orbital frontal cortex, medial orbital frontal cortex, anterior and posterior cingulate, right temporal pole, and right and left parahippocampal cortex. Mean replacement was employed in order to utilize the full sample. These variable sets were subsequently used for two support vector machine classification analyses.
The parameters for each classifier were selected by grid search, based on the average validation error. Then subjects were classified using two nested leave-one-out validations. In each iteration, one subject was selected as the testing sample and set aside; the remaining subjects served as the training sample (this is the first leave-one-out). To select the best parameter for the SVM classifier, we performed a grid search over the reasonable range of the parameters. The classification rate was measured for each parameter set using another leave-one-out validation inside the training set. After selecting the best parameter, the left out testing sample was classified. This procedure of using two nested leave-one-out steps avoids use of training data in model selection or model training.
Additional SVM models were computed for validation. In these models, we used a fully unbiased approach using all ROIs and assessment variables (i.e., no feature selection) with and without brain volume, classifying homicide offenders and non-homicide offenders (n = 135).
Finally, at the request of a reviewer and to test the ability of ROIs from the present VBM group comparisons to differentiate groups using SVM learning, we extracted average gray matter values from 10 mm spheres around peak coordinates from the comparison of homicide offenders versus all non-homicide offenders. These ROIs were superior temporal gyrus (peak at x = 52, y = -4, z = 4), superior temporal gyrus (peak at x = 58, y = -42, z = 8), middle temporal gyrus (peak at x = 62, y = -22, z = -14), parahippocampal gyrus (peak at x = -34, y = -22, z = -32), fusiform gyrus (peak at x = -60, y = -8, z = -30), and inferior temporal gyrus (peak at x = -64, y = -48, z = -16). ROI spheres were visualized in WFU PickAtlas (Maldjian et al., 2003) to ensure no overlap. Feature selection without brain volume identified IQ, PCL:YV Factor 1, PCL:YV Factor 2, total number of convictions, BIS-11, superior temporal gyrus (peak at x = 52, y = -4, z = 4), parahippocampal gyrus, fusiform gyrus, and inferior temporal gyrus. Feature selection with brain volume identified IQ, PCL:YV Factor 1, PCL:YV Factor 2, ICU, SES, brain volume, superior temporal gyrus (peak at x = 52, y = -4, z = 4), superior temporal gyrus (peak at x = 58, y = -42, z = 8), parahippocampal gyrus, fusiform gyrus, and inferior temporal gyrus. Two SVMs were run using these two sets of features. An additional two SVMs were run without feature selection (with and without brain volume).
3. Results
The homicide (n = 20) and non-homicide (n = 135) offender groups did not differ in age (t(153) = 0.28, p = .776, IQ, t(146) = 0.04, p = .965) or socioeconomic status (t(137) = 1.02, p = .307; Table 1). The homicide offenders did, unsurprisingly, score higher on CU/CD traits than did non-homicide offenders, including both interpersonal and affective traits and lifestyle and antisocial traits (Table 1; Psychopathy Checklist: Youth Version (PCL:YV) total scores: t(153) = 4.26, p < .001, r = .32; Factor 1: t(153) = 5.39, p < .001, r = .40; Factor 2: t(153) = 2.57, p = .011, r = .20). Homicide offenders also had higher substance dependence scores (t(153) = 3.43, p = .001, r = .27), higher years of regular substance use scores (t(151) = 2.77, p = .006, r = .22), and more past/current PTSD diagnoses (p = .021) than did non-homicide offenders.
Compared to non-homicide offenders, homicide offenders had lower total brain volumes (t(153) = 2.76, p = .007, r = .22), including both lower total gray matter (t(153) = 2.80, p = .006, r = .22) and white matter (t(153) = 2.10, p = .038, r = .17) volumes. For these measures, volumes were about 5% lower in homicide offenders than in non-homicide offenders.
The comparison between homicide offenders (n = 20) and non-homicide offenders (n = 135) showed vast differences in gray matter throughout the majority of the brain, due to significant differences in both overall brain volume and gray matter (Supplementary Fig. S1).
Inline Supplementary Figure S1.
Fig. S1.
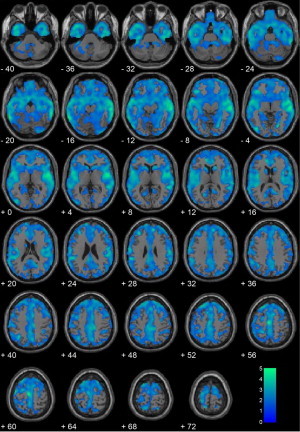
Homicide offenders (n = 20) vs. non-homicide offenders (n = 135) without covariates. Regional gray matter volume decreases in homicide offenders (n = 20) compared with non-homicide offenders (n = 135). All voxels indicated in blue color map represent regions that are significant after correcting for searching the entire brain using a cluster-corrected threshold of p < .05 (i.e., 1427 contiguous voxels at peak height of p < .05). Coordinates are in Montreal Neurological Institute (MNI) space. The color bar represents t-values. These results show that youth who commit homicide have global brain differences in the majority of the cortical ribbon relative to comparison youth who do not commit homicide.
Inline Supplementary Fig. S1 can be found online at http://dx.doi.org/10.1016/j.nicl.2014.05.002.
After including brain volumes, PCL:YV scores, and substance dependence in the regression model, offenders who committed homicide still had significantly reduced gray matter volumes in large bilateral temporal lobe clusters (Table 2; Fig. 1). Regions of significant reduction in the homicide group were the hippocampus, posterior insula, superior temporal gyrus, middle temporal gyrus, parahippocampal gyrus, fusiform gyrus, and inferior temporal gyrus1.
Table 2.
Homicide offenders (n = 20) vs. non-homicide offenders (n = 135) with covariates.
| BA | Hemi | k | x | y | z | t-Value | p-Value (unc.) | |
|---|---|---|---|---|---|---|---|---|
| Superior temporal gyrus | 22 | R | 5597 | 52 | -4 | 4 | 3.38 | <.001 |
| Superior temporal gyrus | 22 | R | 58 | -42 | 8 | 3.34 | .001 | |
| Middle temporal gyrus | 21 | R | 62 | -22 | -14 | 3.32 | .001 | |
| Parahippocampal gyrus | 36 | L | 4624 | -34 | -22 | -32 | 3.22 | .001 |
| Fusiform gyrus | 20 | L | -60 | -8 | -30 | 3.13 | .001 | |
| Inferior temporal gyrus | 37 | L | -64 | -48 | -16 | 3.11 | .001 |
Note. BA = Brodmann area; Hemi = hemisphere; k = number of voxels in cluster. Coordinates are in Montreal Neurological Institute (MNI) space. All regions are areas of reduced gray matter volume in the homicide offenders, significant at a cluster-corrected threshold of p < .05 (i.e., 1427 contiguous voxels at peak height of p < .05). Brain volume, Psychopathy Checklist, Youth Version scores, and substance dependence were included in the model.
Fig. 1.
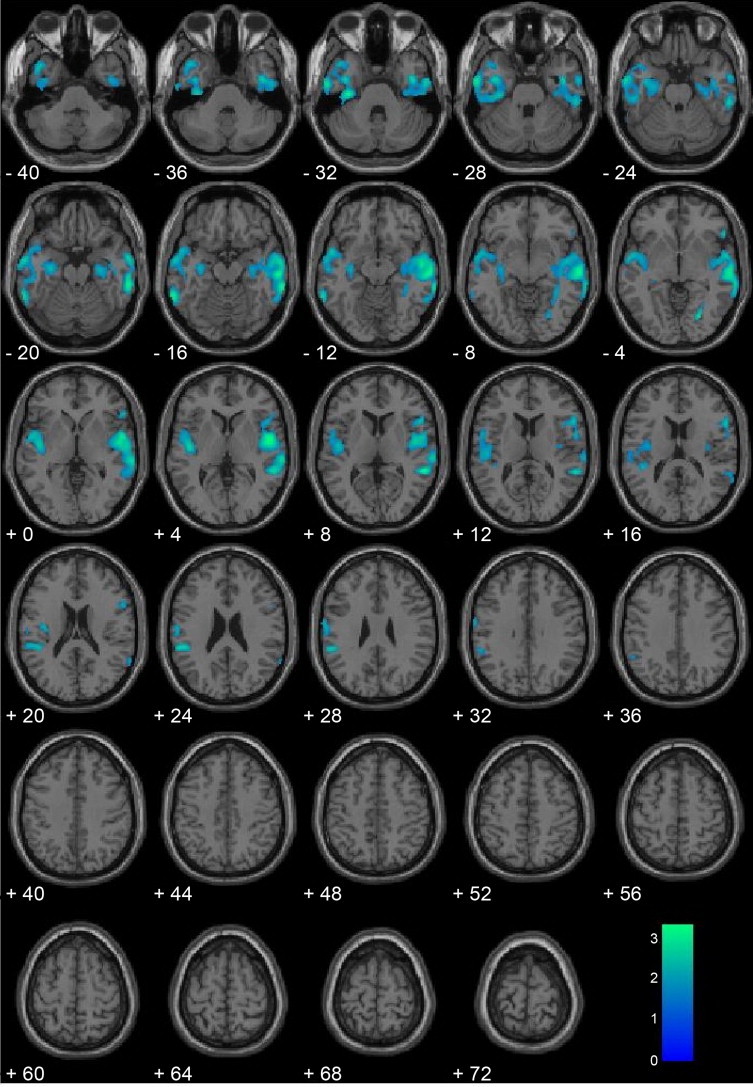
Homicide offenders (n = 20) vs. non-homicide offenders (n = 135) with covariates. Regional gray matter volume decreases in homicide offenders (n = 20) compared with non-homicide offenders (n = 135), including brain volume, Psychopathy Checklist: Youth Version scores, and substance dependence as covariates. All voxels indicated in blue color map represent regions that are significant after correcting for searching the entire brain using a cluster-corrected threshold of p < .05 (i.e., 1427 contiguous voxels at peak height of p < .05). Coordinates are in Montreal Neurological Institute (MNI) space. The color bar represents t-values. These results suggest that after controlling for important moderating variables, youth homicide offenders show the greatest gray matter deficits in bilateral paralimbic regions including the medial and lateral temporal lobes and posterior insula.
Inline Supplementary Table S1.
Table S1.
Multiple regression models with Psychopathy Checklist: Youth Version (PCL:YV), offender status, and temporal pole volumes.
| Model | Dependent variable | Predictors | B | SE B | ß | Predictor t-statistic | Model R2 adjusted | Model F |
|---|---|---|---|---|---|---|---|---|
| 1 | Left temporal pole | Offender status | -.026 | .010 | -.227 | -2.708** | .035 | 3.784* |
| PCL:YV total | .000 | .001 | .035 | .423 | ||||
| 2 | Right temporal pole | Offender status | -.028 | .009 | -.256 | -3.071** | .047 | 4.781** |
| PCL:YV total | .001 | .000 | .112 | 1.343 |
p < .05.
p < .01.
Inline Supplementary Tables S1 can be found online at http://dx.doi.org/10.1016/j.nicl.2014.05.002.
Compared to a matched subsample of non-homicide offenders (n = 20), offenders who committed homicide (n = 20) had significantly reduced gray matter volumes in bilateral temporal lobe clusters. Specific regions of gray matter reduction were as follows: insula, superior temporal gyrus, and middle temporal gyrus (Supplementary Table S2, Fig. S2). These results are largely similar but less widespread than the comparison with the complete incarcerated sample shown in Fig. S1.
Supplementary Table S3.
Table S2.
Homicide offenders (n = 20) vs. matched non-homicide offenders (n = 20).
| BA | Hemi | k | x | y | z | t-value | p-Value (unc.) | |
|---|---|---|---|---|---|---|---|---|
| Insula | 13 | L | 2523 | -56 | -36 | 20 | 3.81 | < .001 |
| Superior temporal gyrus | 22 | L | -46 | -16 | 8 | 2.95 | .002 | |
| Middle temporal gyrus | 21 | L | -44 | 4 | -30 | 2.94 | .002 | |
| Superior temporal gyrus | 21 | R | 1672 | 60 | -18 | -4 | 3.31 | .001 |
| Superior temporal gyrus | 42 | R | 66 | -26 | 8 | 3.25 | .001 | |
| Middle temporal gyrus | 21 | R | 64 | -36 | -18 | 3.19 | .001 |
Note. BA = Brodmann area; Hemi = hemisphere; k = number of voxels in cluster. Coordinates are in Montreal Neurological Institute (MNI) space. All regions are areas of reduced gray matter volume in the homicide offenders, significant at a cluster-corrected threshold of p < .05 (i.e., 1427 contiguous voxels at peak height of p < .05), with brain volume included in the model.
Inline Supplementary Figure S2.
Fig. S2.
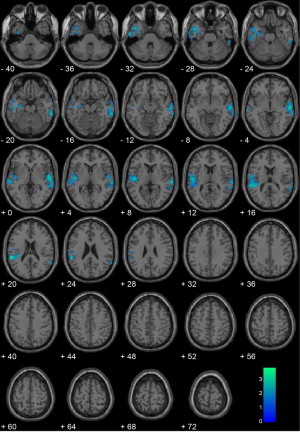
Homicide offenders (n = 20) vs. matched non-homicide offenders (n = 20). Regional gray matter volume decreases in homicide offenders (n = 20) compared with matched non-homicide offenders (n = 20), including brain volume as a covariate. All voxels indicated in blue color map represent regions that are significant after correcting for searching the entire brain using a cluster-corrected threshold of p < .05 (i.e., 1427 contiguous voxels at peak height of p < .05). Coordinates are in Montreal Neurological Institute (MNI) space. The color bar represents t-values.
Inline Supplementary Table. S2 and Fig S2 can be found online at http://dx.doi.org/10.1016/j.nicl.2014.05.002.
The homicide offender and healthy non-offender groups differed on age, t(39) = 2.04, p = .049, IQ, t(38) = 4.12, p < .001, number of TBIs with loss of consciousness, t(39) = 3.96, p < .001, substance dependence, t(38) = 8.68, p < .001, SES, t(38) = 3.79, p = .001, and past/current diagnoses of anxiety (p = .048) and depressive (p = .009) disorders, ODD/CD (p < .001), and PTSD (p = .021), but not ADHD (p = .107) (Table 1). The healthy non-offenders were not administered the PCL:YV, ICU, BIS-11, or crime inventory since they were selected on the basis of having no substance use histories, psychiatric symptoms, or contacts with the legal system. Homicide offenders had significantly reduced gray matter volume in the bilateral caudate, bilateral amygdala, mid/posterior insula, bilateral hippocampus, medial orbitofrontal cortex, anterior cingulate, bilateral cerebellum, and superior prefrontal cortex relative to healthy controls (Supplementary Fig. S3).
Inline Supplementary Figure S3.
Fig. S3.
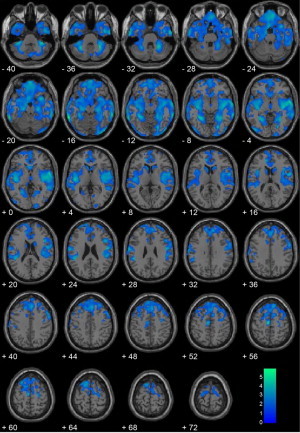
Homicide offenders (n = 20) vs. healthy non-offenders (n = 21). Regional gray matter volume decreases in homicide offenders (n = 20) compared with healthy non-offenders (n = 21), including brain volume as a covariate. All voxels indicated in blue color map represent regions that are significant after correcting for searching the entire brain using a cluster-corrected threshold of p < .05 (i.e., 1427 contiguous voxels at peak height of p < .05). Coordinates are in Montreal Neurological Institute (MNI) space. The color bar represents t-values.
Inline Supplementary Fig. S3 can be found online at http://dx.doi.org/10.1016/j.nicl.2014.05.002.
Support vector machine learning, using the six a priori ROIs and three assessment variables identified by the feature selection, classified individuals with 81.29% accuracy (overall model), and classified 75.00% of homicide offenders (specificity) and 82.22% of non-homicide offenders (sensitivity) correctly. Including brain volume resulted in 81.29% overall accuracy, 80.00% specificity, and 81.48% sensitivity.
As a validation, two fully unbiased SVM models were calculated. All nine a priori ROIs and nine assessment variables (i.e., no feature selection) were used; the overall model classified individuals with 78.06% accuracy and correctly classified 70.00% of homicide offenders (specificity) and 79.26% of non-homicide offenders (sensitivity). When brain volume was included, the model achieved 65.16% overall accuracy, 85.00% specificity, and 62.22% sensitivity.
The SVM models that used ROIs from the present study's VBM group comparison of homicide offenders versus all non-homicide offenders resulted in the following accuracies: 85.16% overall, 90.00% specificity, 84.44% sensitivity (feature selection; without brain volume); 68.39% overall, 100.00% specificity, 63.70% sensitivity (feature selection; with brain volume); 76.77% overall, 80.00% specificity, 76.30% sensitivity (no feature selection; without brain volume); and 72.90% overall, 85.00% specificity, 71.11% sensitivity (no feature selection; with brain volume).
4. Discussion
Using high resolution structural magnetic resonance imaging and voxel-based morphometry we identified regional gray matter volume differences in incarcerated adolescent males who committed homicide compared to incarcerated adolescent males who had not committed homicide and healthy controls. Consistent with hypotheses, those who committed homicide showed reduced gray matter volumes relative to comparison youth. In addition to global differences in brain volume and gray matter volume, regional gray matter differences were observed in the medial and lateral temporal cortex, including the hippocampus and posterior insula, in the offenders who committed homicide compared to incarcerated non-homicide offenders.
The specific regions of gray matter reduction were largely concentrated in the temporal lobes. This is in good accord with findings of violent men with antisocial personality disorder compared to healthy controls (Barkataki et al., 2006). It should be noted, though, that the primary findings from the present analyses of adolescent homicide offenders were in comparison with other incarcerated offenders. Thus, the present gray matter deficits may be more specific to the extreme violence and behavioral under-control associated with homicide than with antisocial behavioral more generally.
Bilateral temporal lobe lesions in monkeys and lesions to the bilateral amygdala and inferior temporal cortex in humans can result in Kluver–Bucy syndrome, a disorder that involves emotional blunting and impulsivity (Kluver and Bucy, 1937). Gray matter reductions were also found in the bilateral posterior insula in the homicide offenders relative to comparison youth. Posterior insular cortex has been implicated in agency, interoceptive awareness, and a sense of self (Craig, 2002; Farrer et al., 2003) and evidence has accumulated that interoceptive awareness and emotional experience are strongly linked (e.g., Damasio, 1996). One study of patients with schizophrenia found that cortical surface area and white matter volume of the right posterior insula were negatively related to insight (Palaniyappan et al., 2011). Although in the present study we measured gray matter volumes and not cortical surface area or white matter volumes, it is possible that the observed gray matter deficits in the homicide offenders are related to deficient emotional states involving insight, agency, appreciation of the interpersonal harm and seriousness of one's actions and, in turn, violent homicidal behavior. The posterior insula has also been suggested to represent homeostatic states associated with experiencing risk (Xue et al., 2010). Thus, it may be that homicide offenders, compared to offenders who do not commit homicide, experience deficient risk monitoring and are thus more likely to kill. These interpretations should be tested specifically in future work.
Homicide offenders had reduced gray matter volumes in the temporal poles in the present study. Prior work with a similar sample has shown that reduced temporal pole gray matter was related to higher psychopathic traits (Ermer et al., 2013). Here however, PCL:YV scores were included in the VBM group comparison of homicide offenders and non-homicide offenders, and the homicide group did not differ significantly from the matched non-homicide offender subsample, suggesting that psychopathic traits cannot explain the observed differences. Additionally, homicide offender status was a significant predictor of temporal pole volumes when PCL:YV scores were also included in the multiple regression model (Supplemental information). A growing body of research implicates the temporal poles in social and emotional processing, including theory of mind, detecting deception, moral decision-making, and inferring the emotional states of others (reviewed in Olson et al., 2007). For instance, engagement of the temporal poles in an fMRI study was found to be correlated with how much college students felt others' negative emotions (Moriguchi et al., 2006). Relevant findings also include the role of the temporal poles in supporting group social behaviors (Myers, 1969) and the suggestion that the temporal poles couple emotion with processed sensory stimuli (Olson et al., 2007). Whether the reductions in temporal pole gray matter observed here are a cause or a consequence of committing homicide is unknown. Nevertheless, the present results support the important role of the temporal poles in appropriate social and emotional behavior and point to the temporal poles as a target of future research.
To our knowledge this is the first study to examine gray matter volume differences in adolescent homicide offenders. Here we made the comparison with other high-risk (incarcerated) youth, including a well-matched subsample, as well as with healthy controls. The comparison with matched incarcerated non-homicide offenders is particularly valuable, in that differences in regional gray matter volumes cannot be attributed to differences in age, IQ, SES, PCL:YV scores, callous/unemotional traits, impulsivity, traumatic brain injury, past or current mental disorder diagnoses, number of convictions (including violent, non-violent, drug, and total convictions), or substance use. And whereas we recognize that the commission of a homicide is a behavior and not a disorder, gray matter differences were still found. Thus, there must be something that is different about those adolescents who committed homicide, compared to other maximum-security offenders.
Using feature selection and support vector machine (SVM) learning with fully independent regions of interest, we were able to correctly classify 75% of homicide offenders and 82% of non-homicide offenders. This SVM model utilized non-linear information from six brain regions of interest (left lateral orbital frontal cortex, medial orbital frontal cortex, anterior and posterior cingulate, and right and left temporal pole) and three assessment variables (PCL:YV Factor 1, total number of convictions, and SES) to discriminate homicide offenders from other high-risk offenders.
Identification of the medial orbital frontal cortex as being important for classifying offenders is consistent with the finding that violent men with antisocial personality disorder showed cortical thinning in the inferior medial frontal cortex (i.e., medial orbital frontal cortex) compared to healthy controls (Narayan et al., 2007). Additionally, in the present analyses, large differences in medial orbital frontal cortex gray matter were found in the comparison of homicide offenders and healthy controls. This region has been linked to affect dysregulation and impulsivity, as well as impairments in social behavior and decision-making (Damasio et al., 1990), consistent with the gray matter deficits seen here among homicide offenders.
In an additional SVM model, using all nine assessment variables and nine ROIs, the overall model classified individuals with over 78% accuracy. Our pattern classification findings suggest regions and variables that are especially important for identifying those youth at the highest risk for committing serious violent offenses, and provide targets for future research on prevention and treatment.
These results should be interpreted with several limitations in mind. Because these data were collected after the commission of crimes, it is unknown when these gray matter differences developed. If the observed differences were present before the youth committed homicide, one implication is that neuroscience may be able to help identify biomarkers to identify the youth that are at an even higher risk than their high-risk peers. At the present time it is likely fiscally impractical to have every at-risk youth undergo a structural MRI scan. Thus, a future goal should be to develop behavioral measures that index the observed temporal gray matter deficits. Neuroimaging work may be the key to developing such a behavioral measure, or proxy, of this subset of youth with reduced gray matter.
These findings have implications for treatment, remediation, and even prevention of serious violent behavior. Indeed, it is important to note that gray matter is malleable. For instance, one study found that 15 min of daily mirror reading for 2 weeks increased right dorsolateral occipital gray matter (Ilg et al., 2008). This previous finding suggests that cognitive training could be a feasible treatment mechanism to augment gray matter. Additionally, pharmaceutical intervention in conjunction with behavior modification or traditional forms of therapy may result in the most positive treatment outcomes. Certain disorders, such as treatment-resistant depression, are most successfully treated with a combination of drug and cognitive behavior therapy (Brent et al., 2008). Whereas it would be ideal to provide intervention and treatment for all at-risk youth, with limited resources it might be necessary to target intervention efforts at the highest-risk youth in an attempt to prevent the most serious harm (Caldwell et al., 2006; Caldwell and Van Rybroek, 2005; Caldwell et al., 2012).
In summary, we report the first study of gray matter volume deficits in youth who have committed homicide. This work has important implications for the development of biomarkers for youth on a high-risk trajectory of antisocial behavior and it also has important implications for developing novel interventions to help reduce the enormous fiscal and emotional toll homicidal behavior has on society.
Conflicts of interest
Dr. Kiehl is on the Science Advisory Board of the Avielle Foundation (an unpaid position) and reports no financial conflicts of interest. Dr. Cope, Dr. Ermer, Ms. Gaudet, Dr. Steele, Ms. Eckhardt, Mr. Arbabshirani, Dr. Caldwell, and Dr. Calhoun report no financial interests or potential conflicts of interest.
Acknowledgments
This SWANC-Y dataset on which these analyses were conducted was collected under funding from the National Institute of Mental Health (NIMH) grant MH071896 (KAK). This work was inspired by conversations with Avielle Foundation staff. The Avielle Foundation was created following the mass shooting at Sandy Hook Elementary School in Connecticut in December of 2012.
Footnotes
To quantify variability in temporal pole volumes associated with psychopathic traits and homicide offender status, we extracted temporal pole (Brodmann area 38) volumes from each participant and computed multiple regression models with PCL:YV scores and homicide offender status predicting left and right temporal pole volumes (in two separate models). See Table S1 in the Supplementary material for results.
References
- Armour M.P., Umbreit M.S. The ultimate penal sanction and “closure” for survivors of homicide victims. Marquette Law Review. 2007;91:381–424. [Google Scholar]
- Ashburner J., Friston K.J. Unified segmentation. Neuroimage. 2005;26:839–851. doi: 10.1016/j.neuroimage.2005.02.018. 15955494 [DOI] [PubMed] [Google Scholar]
- Ashburner J., Friston K.J. Voxel-based morphometry—the methods. Neuroimage. 2000;11:805–821. doi: 10.1006/nimg.2000.0582. 10860804 [DOI] [PubMed] [Google Scholar]
- Barkataki I., Kumari V., Das M., Taylor P., Sharma T. Volumetric structural brain abnormalities in men with schizophrenia or antisocial personality disorder. Behavioural Brain Research. 2006;169:239–247. doi: 10.1016/j.bbr.2006.01.009. 16466814 [DOI] [PubMed] [Google Scholar]
- Brent D., Emslie G., Clarke G., Wagner K.D., Asarnow J.R., Keller M. Switching to another SSRI or to venlafaxine with or without cognitive behavioral therapy for adolescents with SSRI-resistant depression. Journal of the American Medical Association. 2008;299:901–913. doi: 10.1001/jama.299.8.901. [DOI] [PMC free article] [PubMed] [Google Scholar]
- Burges C.J.C. A tutorial on support vector machines for pattern recognition. Data Mining and Knowledge Discovery. 1998;2:121–167. [Google Scholar]
- Caldwell M., Skeem J., Salekin R., Van Rybroek G. Treatment response of adolescent offenders with psychopathy features: a 2-year follow-up. Criminal Justice and Behavior. 2006;33:571–596. [Google Scholar]
- Caldwell M.F., McCormick D., Wolfe J., Umstead D. Treatment-related changes in psychopathy features and behavior in adolescent offenders. Criminal Justice and Behavior. 2012;39:144–155. [Google Scholar]
- Caldwell M.F., Van Rybroek G.J. Reducing violence in serious juvenile offenders using intensive treatment. International Journal of Law and Psychiatry. 2005;28:622–636. doi: 10.1016/j.ijlp.2004.07.001. 16112731 [DOI] [PubMed] [Google Scholar]
- Corrado R.R., Vincent G.M., Hart S.D., Cohen I.M. Predictive validity of the Psychopathy Checklist: Youth Version for general and violent recidivism. Behavioral Sciences & the Law. 2004;22:5–22. doi: 10.1002/bsl.574. 14963878 [DOI] [PubMed] [Google Scholar]
- Cortes C., Vapnik V. Support-vector networks. Machine Learning. 1995;20:273–297. [Google Scholar]
- Craig A.D. How do you feel? Interoception: the sense of the physiological condition of the body. Nature Reviews. Neuroscience. 2002;3:655–666. doi: 10.1038/nrn894. 12154366 [DOI] [PubMed] [Google Scholar]
- Damasio A.R. The somatic marker hypothesis and the possible functions of the prefrontal cortex. Philosophical Transactions of the Royal Society of London. Series B, Biological Sciences. 1996;351:1413–1420. doi: 10.1098/rstb.1996.0125. 8941953 [DOI] [PubMed] [Google Scholar]
- Damasio A.R., Tranel D., Damasio H. Individuals with sociopathic behavior caused by frontal damage fail to respond autonomically to social stimuli. Behavioural Brain Research. 1990;41:81–94. doi: 10.1016/0166-4328(90)90144-4. 2288668 [DOI] [PubMed] [Google Scholar]
- Davidson R.J., Putnam K.M., Larson C.L. Dysfunction in the neural circuitry of emotion regulation—a possible prelude to violence. Science (New York, N.Y.) 2000;289:591–594. doi: 10.1126/science.289.5479.591. 10915615 [DOI] [PubMed] [Google Scholar]
- de Oliveira-Souza R., Hare R.D., Bramati I.E., Garrido G.J., Ignacio A.F., Tovar-Moll F., Moll J. Psychopathy as a disorder of the moral brain: fronto-temporo-limbic grey matter reductions demonstrated by voxel-based morphometry. NeuroImage. 2008;40:1202–1213. doi: 10.1016/j.neuroimage.2007.12.054. 18289882 [DOI] [PubMed] [Google Scholar]
- DeLisi M., Kosloski A., Sween M., Hachmeister E., Moore M., Drury A. Murder by numbers: Monetary costs imposed by a sample of homicide offenders. Journal of Forensic Psychiatry & Psychology. 2010;21:501–513. [Google Scholar]
- Ermer E., Cope L.M., Nyalakanti P.K., Calhoun V.D., Kiehl K.A. Aberrant paralimbic gray matter in incarcerated male adolescents with psychopathic traits. Journal of the American Academy of Child and Adolescent Psychiatry. 2013;52:94–103. doi: 10.1016/j.jaac.2012.10.013. 23265637 [DOI] [PMC free article] [PubMed] [Google Scholar]
- Ermer E., Cope L.M., Nyalakanti P.K., Calhoun V.D., Kiehl K.A. Aberrant paralimbic gray matter in criminal psychopathy. Journal of Abnormal Psychology. 2012;121:649–658. doi: 10.1037/a0026371. 22149911 [DOI] [PMC free article] [PubMed] [Google Scholar]
- Essau C.A., Sasagawa S., Frick P.J. Callous-unemotional traits in a community sample of adolescents. Assessment. 2006;13:454–469. doi: 10.1177/1073191106287354. 17050915 [DOI] [PubMed] [Google Scholar]
- Farrer C., Franck N., Georgieff N., Frith C.D., Decety J., Jeannerod M. Modulating the experience of agency: a positron emission tomography study. Neuroimage. 2003;18:324–333. doi: 10.1016/s1053-8119(02)00041-1. 12595186 [DOI] [PubMed] [Google Scholar]
- Forth A.E., Kosson D.S., Hare R.D.. The Psychopathy Checklist: Youth Version. Multi-Health Systems; Toronto, ON, Canada: 2003. [Google Scholar]
- Hare R.D. Manual for the Hare Psychopathy Checklist—Revised. second edition. Multi-Health Systems; Toronto, ON, Canada: 2003. p. 17. [Google Scholar]
- Hawkins J.D., Herrenkohl T.I., Farrington D.P., Brewer D., Catalano R.F., Harachi T.W., Cothern L. Predictors of Youth Violence. U.S. Department of Justice; Washington, DC: 2000. [Google Scholar]
- Huebner T., Vloet T.D., Marx I., Konrad K., Fink G.R., Herpertz S.C., Herpertz-Dahlmann B. Morphometric brain abnormalities in boys with conduct disorder. Journal of the American Academy of Child and Adolescent Psychiatry. 2008;47:540–547. doi: 10.1097/CHI.0b013e3181676545. 18356764 [DOI] [PubMed] [Google Scholar]
- Ilg R., Wohlschlager A.M., Gaser C., Liebau Y., Dauner R., Woller A. Gray matter increase induced by practice correlates with task-specific activation: a combined functional and morphometric magnetic resonance imaging study. Journal of Neuroscience: the Official Journal of the Society for Neuroscience. 2008;28:4210–4215. doi: 10.1523/JNEUROSCI.5722-07.2008. 18417700 [DOI] [PMC free article] [PubMed] [Google Scholar]
- Jain A.K., Duin R.P.W., Mao J.C. Statistical pattern recognition: a review. IEEE Transactions on Pattern Analysis and Machine Intelligence. 2000;22:4–37. [Google Scholar]
- Kaufman J., Birmaher B., Brent D., Rao U., Flynn C., Moreci P. Schedule for Affective Disorders and Schizophrenia for School-Age Children—Present and Lifetime Version (K-SADS-PL): initial reliability and validity data. Journal of the American Academy of Child and Adolescent Psychiatry. 1997;36:980–988. doi: 10.1097/00004583-199707000-00021. 9204677 [DOI] [PubMed] [Google Scholar]
- King N.S., Crawford S., Wenden F.J., Moss N.E., Wade D.T. The Rivermead Post Concussion Symptoms Questionnaire: a measure of symptoms commonly experienced after head injury and its reliability. Journal of Neurology. 1995;242:587–592. doi: 10.1007/BF00868811. 8551320 [DOI] [PubMed] [Google Scholar]
- Kluver H., Bucy P.C. “Psychic blindness” and other symptoms following bilateral temporal lobectomy in rhesus monkeys. American Journal of Physiology. 1937;119:352–353. [Google Scholar]
- Maldjian J.A., Laurienti P.J., Burdette J.B., Kraft R.A. An automated method for neuroanatomic and cytoarchitectonic atlas-based interrogation of fMRI data sets. NeuroImage. 2003;19:1233–1239. doi: 10.1016/s1053-8119(03)00169-1. 12880848 [DOI] [PubMed] [Google Scholar]
- McLellan A.T., Kushner H., Metzger D., Peters R., Smith I., Grissom G. The fifth edition of the Addiction Severity Index. Journal of Substance Abuse Treatment. 1992;9:199–213. doi: 10.1016/0740-5472(92)90062-s. 1334156 [DOI] [PubMed] [Google Scholar]
- Melgani F., Bruzzone L. Classification of hyperspectral remote sensing images with support vector machines. IEEE Transactions on Geoscience and Remote Sensing. 2004;42:1778–1790. [Google Scholar]
- Moffitt T.E. Adolescence-limited and life-course-persistent antisocial behavior: a developmental taxonomy. Psychological Review. 1993;100:674–701. 8255953 [PubMed] [Google Scholar]
- Moriguchi Y., Ohnishi T., Lane R.D., Maeda M., Mori T., Nemoto K., Matsuda H., Komaki G. Impaired self-awareness and theory of mind: an fMRI study of mentalizing in alexithymia. NeuroImage. 2006;32:1472–1482. doi: 10.1016/j.neuroimage.2006.04.186. 16798016 [DOI] [PubMed] [Google Scholar]
- Murphy S.L., Xu J., Kochanek D. Deaths: final data for 2010. National Vital Statistics Reports. 2013;61(4):1–118. [PubMed] [Google Scholar]
- Myers R.E. Discussion of the preceding paper. Annals of the New York Academy of Sciences. 1969;167:289–292. [Google Scholar]
- Narayan V.M., Narr K.L., Kumari V., Woods R.P., Thompson P.M., Toga A.W., Sharma T. Regional cortical thinning in subjects with violent antisocial personality disorder or schizophrenia. American Journal of Psychiatry. 2007;164:1418–1427. doi: 10.1176/appi.ajp.2007.06101631. 17728428 [DOI] [PMC free article] [PubMed] [Google Scholar]
- Olson I.R., Plotzker A., Ezzyat Y. The enigmatic temporal pole: a review of findings on social and emotional processing. Brain: a Journal of Neurology. 2007;130:1718–1731. doi: 10.1093/brain/awm052. 17392317 [DOI] [PubMed] [Google Scholar]
- Palaniyappan L., Mallikarjun P., Joseph V., Liddle P.F. Appreciating symptoms and deficits in schizophrenia: right posterior insula and poor insight. Progress in Neuro-psychopharmacology & Biological Psychiatry. 2011;35:523–527. doi: 10.1016/j.pnpbp.2010.12.008. 21182887 [DOI] [PubMed] [Google Scholar]
- Patton J.H., Stanford M.S., Barratt E.S. Factor structure of the Barratt Impulsiveness Scale. Journal of Clinical Psychology. 1995;51:768–774. doi: 10.1002/1097-4679(199511)51:6<768::aid-jclp2270510607>3.0.co;2-1. 8778124 [DOI] [PubMed] [Google Scholar]
- Ryan J.J., Lopez S.J., Werth T.R. Development and preliminary validation of a Satz–Mogel short form of the WAIS-III in a sample of persons with substance abuse disorders. International Journal of Neuroscience. 1999;98:131–140. doi: 10.3109/00207459908994796. 10395365 [DOI] [PubMed] [Google Scholar]
- Sattler J.M., Dumont R. Assessment of Children: WISC-IV and WPPSI-III Supplement. Jerome M. Sattler; San Diego: 2004. [Google Scholar]
- Sterzer P., Stadler C., Poustka F., Kleinschmidt A. A structural neural deficit in adolescents with conduct disorder and its association with lack of empathy. Neuroimage. 2007;37:335–342. doi: 10.1016/j.neuroimage.2007.04.043. 17553706 [DOI] [PubMed] [Google Scholar]
- Sweeten G., Piquero A.R., Steinberg L. Age and the explanation of crime, revisited. Journal of Youth and Adolescence. 2013;42:921–938. doi: 10.1007/s10964-013-9926-4. 23412690 [DOI] [PubMed] [Google Scholar]
- Tiihonen J., Rossi R., Laakso M.P., Hodgins S., Testa C., Perez J. Brain anatomy of persistent violent offenders: more rather than less. Psychiatry Research. 2008;163:201–212. doi: 10.1016/j.pscychresns.2007.08.012. 18662866 [DOI] [PubMed] [Google Scholar]
- Vul E., Harris C., Winkielman P., Pashler H. Puzzlingly high correlations in fMRI studies of emotion, personality, and social cognition. Perspectives on Psychological Science. 2009;4:274–290. doi: 10.1111/j.1745-6924.2009.01125.x. [DOI] [PubMed] [Google Scholar]
- Ward D.B. Simultaneous Inference for fMRI Data. Milwaukee, WI; 2000. [Google Scholar]
- Wechsler D. Wechsler Intelligence Scale for Children—Fourth Edition: Technical and Interpretive Manual. Psychological Corporation; San Antonio, TX.: 2003. [Google Scholar]
- Wechsler D. WAIS-III: Wechsler Adult Intelligence Scale. Psychological Corporation; San Antonio, TX.: 1997. [Google Scholar]
- Xue G., Lu Z., Levin I.P., Bechara A. The impact of prior risk experiences on subsequent risky decision-making: the role of the insula. NeuroImage. 2010;50:709–716. doi: 10.1016/j.neuroimage.2009.12.097. 20045470 [DOI] [PMC free article] [PubMed] [Google Scholar]
Associated Data
This section collects any data citations, data availability statements, or supplementary materials included in this article.