

Abstract
Objective
Autism Spectrum Disorder (ASD) has been associated with a complex pattern of increases and decreases in resting-state functional connectivity. The developmental disconnection hypothesis of ASD poses that shorter connections become overly well established with development in this disorder, at the cost of long-range connections. Here, we investigated resting-state connectivity in relatively young boys with ASD and typically developing children. We hypothesized that ASD would be associated with reduced connectivity between networks, and increased connectivity within networks, reflecting poorer integration and segregation of functional networks in ASD.
Methods
We acquired resting-state fMRI from 27 boys with ASD and 29 age- and IQ-matched typically developing boys between 6 and 16 years of age. Functional connectivity networks were identified using Independent Component Analysis (ICA). Group comparisons were conducted using permutation testing, with and without voxel-wise correction for grey matter density.
Results
We found no between-group differences in within-network connectivity. However, we did find reduced functional connectivity between two higher-order cognitive networks in ASD. Furthermore, we found an interaction effect with age in the DMN: insula connectivity increased with age in ASD, whereas it decreased in typically developing children.
Conclusions
These results show subtle changes in between network connectivity in relatively young boys with ASD. However, the global architecture of resting-state networks appeared to be intact. This argues against recent suggestions that changes in connectivity in ASD may be the most prominent during development.
Keywords: Autism, Development, Connectivity, Networks, Independent Component Analysis
1. Introduction
Autism Spectrum Disorder (ASD) is a developmental disorder characterized by restricted and repetitive behaviour, as well as impaired social interaction and communication (American Psychiatric Association, 1994). ASD has been associated with changes in brain connectivity (Belmonte et al., 2004; Courchesne and Pierce, 2005; Geschwind and Levitt, 2007; Minshew and Keller, 2010), where some connections are reported to be weaker (Just et al., 2004; Just et al., 2007; Kana et al., 2007; Kleinhans et al., 2008; Villalobos et al., 2012; von dem Hagen et al., 2013) and others stronger (Koshino et al., 2005; Mizuno et al., 2006; Turner et al., 2006; Shih et al., 2010; Di Martino et al., 2011) in individuals with ASD compared to typically developing controls. The developmental disconnection model of ASD suggests that changes in functional connectivity in individuals with ASD follow a pattern of local over-connectivity and long-range (Belmonte et al., 2004; Courchesne and Pierce, 2005; Geschwind and Levitt, 2007), or even global under-connectivity (Just et al., 2004; Just et al., 2007). This aberrant pattern of connectivity may then reflect deficits in the fine-tuning of networks during development in ASD, a process that is typically characterized by increased integration within networks and segregation between networks (Fair et al., 2007; Fair et al., 2009; Supekar et al., 2009). It has been suggested that development of functional connectivity in ASD may be characterized by atypical rather than by delayed integration or segregation of functional networks during childhood (Di Martino et al., 2011; Washington et al., 2014), where the developmental trajectories may differ even between functional networks (Padmanabhan et al. 2013).
Many studies have investigated functional connectivity during cognitive tasks (Just et al., 2004; Koshino et al., 2005; Mizuno et al., 2006; Turner et al., 2006; Just et al., 2007; Kana et al., 2007; Kleinhans et al., 2008; Shih et al., 2010; Villalobos et al., 2012), although more recently investigators have also started to study functional connectivity during rest in ASD (Cherkassky et al., 2006; Monk et al., 2009; Assaf et al., 2010; Weng et al., 2010; Di Martino et al., 2011; Ebisch et al., 2011; Wiggins et al., 2011; von dem Hagen et al., 2013; Washington et al., 2014). In the general population, resting state networks identified thus far appear to resemble cortical functional ‘task’ networks, such as the sensorimotor, visual, and executive networks (Damoiseaux et al. 2006; Seeley et al. 2007; Vincent et al. 2008; Laird et al. 2011; Shirer et al. 2012). The only network that does not resemble a ‘task’ network is the Default Mode Network (DMN), which includes the posterior cingulate gyrus (PCC), retrosplenial cortex, lateral parietal cortex, medial prefrontal cortex (mPFC), superior frontal gyrus (SFG) and temporal lobe (Greicius et al., 2003; Fox et al., 2005). The cerebellum seems to be involved in many of these intrinsic networks, including higher order cognitive networks and the DMN (Allen et al., 2005; Habas et al., 2009).
Even though ASD is a developmental disorder, only a few studies have investigated resting-state functional connectivity in children with ASD. Most have reported reduced functional connectivity between core areas of the DMN, especially between the posterior PCC and mPFC (Di Martino et al. 2013), and as such seem to suggest decreases in the development of long-range functional networks in children with ASD (Assaf et al., 2010; Wiggins et al., 2011;Padmanabhan et al. 2013; Washington et al., 2014). In contrast, connectivity within a prefrontal DMN node was reported to be increased in ASD (Washington et al., 2014). Increased functional connectivity between different striatal areas during rest was also reported in young children with ASD (Di Martino et al., 2011), as well as reduced connectivity between the insula, and the somatosensory cortices and amygdala (Ebisch et al., 2011). These changes in mostly long-range functional connectivity have been associated with social deficits in ASD, where more severe problems in social interaction and communication deficits were related to lower connectivity within DMN areas (Assaf et al., 2010; Lynch et al., 2013).
In the current study we investigated resting-state networks in a group of relatively young, high-functioning boys with ASD and a group of age-matched, typically developing control boys. In accordance with the developmental disconnection hypothesis, we hypothesized that there would be increased connectivity within networks, and decreased connectivity between networks in boys with ASD, reflecting atypical development of functional networks. Furthermore, we hypothesized that we would find these between-group differences specifically in the DMN and networks related to higher-order cognitive functioning and that they would also involve the cerebellum, given the well-established cognitive impairments in ASD.
2. Materials and methods
2.1. Participants
Forty high-functioning right-handed male children and young adolescents with a diagnosis within the DSM-IV autism spectrum were recruited through the Department of Psychiatry at the University Medical Center in Utrecht and through advertising. The clinical diagnosis was confirmed with a research diagnosis by a qualified researcher using the Autism Diagnostic Interview — Revised (ADI-R (Lord et al., 1994)). The children with ASD were either medication naïve or using psychostimulant medication (see: Table 1). No other forms of psychoactive medication were permitted in this study. The group of children with ASD that was on stimulant medication was instructed not to take their medication 24 h prior to the MRI-scan.
Table 1.
Demographic data for the sample.
| ASD (N = 27) | TDC (N = 29) | p | |
|---|---|---|---|
| Age mean ± SD (range) | 11.8 ± 1.9 (8.3–15.1) | 12.2 ± 2.1 (6.4–15.8) | .520 |
| Total IQ mean ± SD (range) | 114.0 ± 14.4 (88–145) | 113.9 ± 15.0 (80–145) | .993 |
| Parental educationa mean ± SD (years) | 13.6 ± 2.1 | 14.3 ± 1.9 | .193 |
| Heightb mean ± SD | 153.1 ± 15.7 | 157.7 ± 13.9 | .618 |
| Weightc mean ± SD | 43.1 ± 16.6 | 45.9 ± 11.3 | .564 |
| Tanner staged mean ± SD | 1.8 ± 1.3 | 2.3 ± 1.4 | .226 |
| ADI-R social mean ± SD | 19.9 ± 4.2 | ||
| ADI-R communication mean ± SD | 15.7 ± 4.2 | ||
| ADI-R repetitive mean ± SD | 4.9 ± 2.5 | ||
| Use of psychostimulant medication | 12/27 |
ASD: Autism Spectrum Disorder; TDC: Typically Developing Controls; IQ: Intelligence Quotient; ADI-R: Autism Diagnostic Interview — Revised;
Information was not available for 1 TDC and 7 ASD participants.
Information was not available for 4 ASD participants.
Information was not available for 3 ASD participants.
Information was not available for 3 ASD participants.
Forty typically developing subjects were selected from the pool of volunteers participating in studies by our lab. All subjects were screened by phone interview, to confirm the absence of major neurological or psychiatric disorders, as well as the absence of psychiatric conditions in their first-degree relatives. None of the control subjects were using any form of psychoactive medication. Parents of the typically developing subjects participated in a semi-structured interview session (Diagnostic Interview Schedule for Children — Parent Version (DISC-P) (Costello et al., 1985)) with a trained researcher to confirm the absence of any psychiatric condition in the subject.
Subjects were matched for age, Tanner stage, IQ and socio-economic status (see: Table 1). Tanner stage was assessed in order to preclude group differences in pubertal development. Full scale IQ was assessed for all participants using the Wechsler Intelligence Scale for Children (WISC-III (Kort et al., 2005)).
2.2. fMRI acquisition
All participants under 13 years of age participated in a mock MRI-scanner practice session in our lab. The purposes of this practice session were to acclimate the children to the scanner environment, to reduce potential anxiety and to increase compliance to reduce the risk of motion artefacts (Durston et al., 2009; Langen et al., 2009). Children only participated in the actual MRI-scan after a successful practice session. Older subjects were also offered such a session, in which all of them participated.
Data were acquired using a 3.0 T Phillips Achieva MR scanner (Philips Medical Systems, Best, The Netherlands). A high-resolution T1-weighted image was acquired to allow for spatial normalization and visualization (TR/TE = 10/4.6, flip angle = 8°, matrix 304 × 299, voxel size 0.75 × 0.75 × 0.8). During the acquisition of the T1-weighted image, all children were watching a movie. Resting-state functional images were then collected in a single block of 294 dynamics with a 2D-EPI SENSE sequence (TR/TE = 2000/35, flip angle = 70°, matrix 68 × 66, voxel size 3 × 3 × 3.5), with a total duration of 10 min. Participants were instructed to focus on a fixation cross during the procedure.
2.3. Image preprocessing
Resting-state fMRI data were preprocessed using SPM8 (Wellcome Dept. of Cognitive Neurology, http://www.fil.ion.ucl.ac.uk). First, rigid-body realignment was performed, followed by unwarping to remove residual variance related to movement. Only movement not exceeding the total linear displacement of 3 mm or the size of 1 voxel over the course of the session was allowed. Hence, 13 children with ASD and 11 typically developing children were excluded. Average head motion in the group carried forward for analysis was 1.24 mm. Framewise displacement (as computed by Power et al., 2012) and Root Mean Square mean motion (as calculated by Van Dijk et al., 2012) did not differ between groups, and did not correlate with age (see: Table 2). The next step was co-registration of the functional and anatomical images. Anatomical images were segmented into grey and white matter. Both the functional and anatomical images were then normalized to standard stereotactic space (Montreal Neurological Institute (MNI) — template). Finally images were smoothed with an 8 mm3 FWHM Gaussian kernel, and a high-pass temporal filter was applied at 0.008 Hz to remove low frequency drift (cut-off = 128 s).
Table 2.
Motion characteristics.
2.4. Data analysis
Group Independent Component Analysis (ICA) was performed (Calhoun et al., 2001) on the preprocessed functional images using the Group ICA of fMRI Toolbox (GIFT, http://icatb.sourcefourge.net, version 2.e). ICA is a model free method that decomposes functional imaging data into spatially independent, but temporally coherent brain networks (Calhoun et al., 2001). To minimize the effects of residual motion or any other artefacts, ICA was first run on each subject individually. After removing artefacts on the individual subject level all 56 subjects were included in a Group ICA analysis. The steps are described below.
2.5. Single subject analysis
The number of network components was estimated per subject using minimum description length (MDL, Li et al., 2007). Independent components (ICs) were estimated using the Infomax algorithm (Bell and Sejnowski, 1995), which was repeated 20 times using ICASSO (http://research.ics.aalto.fi/ica/icasso) to reach an estimate of component reliability (Himberg et al., 2004). Finally, images were back-reconstructed (GICA3, Erhardt et al., 2011) and converted for visualization to reflect percent signal change.
Following the single-subject ICA analysis, all spatial maps were inspected for the presence of obvious artefacts (e.g. scanner artefacts, edges). Furthermore, individual motion parameters were temporally regressed with the individual component maps to exclude components showing signal variation related to motion. Components were discarded if their correlation with the motion parameters exceeded a Z-transformed r2 of 1.96. All nuisance components were then removed from the preprocessed resting-state data, resulting in cleaned images for all subjects.
2.6. Group analysis
The cleaned data of all 56 subjects was fed into a group ICA analysis using the Infomax algorithm, which was repeated 20 times in ICASSO to again ensure the reliability of the component estimation. Data from the whole group, both patients and control subjects, was decomposed into 25 independent components in order to represent robust large-scale networks (Beckmann et al. 2005; Greicius et al. 2007). Individual subject components were again back reconstructed using GICA3, and finally time-courses were scaled using maximum intensity value, and spatial maps using the standard deviation of the time-courses.
2.7. Identification and selection of networks of interest
Three components were discarded as they showed a spatial correlation of r2 > 0.025 with either the white matter or the cerebrospinal fluid and could thus be considered as noise. Further identification of resting-state functional networks was performed through cross-correlation with established templates from Shirer et al. (2012). Components that represented primary sensory networks or noise were not carried forward to statistical analyses. Ten components were selected for analysis as they showed a moderate to good (>0.30) correlation with the templates and they represented Default Mode (ICs 8, 17, 19 and 23), frontoparietal (ICs 22 and 24), striatal (ICs 4 and 18), cingulate gyrus (IC 16) and cerebellar-thalamic (IC 10) components (see: Fig. 1).
Fig. 1.
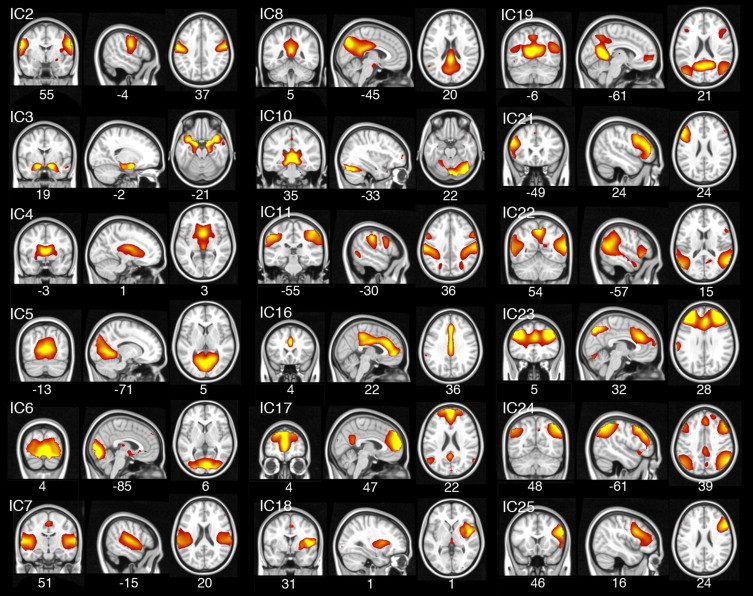
Spatial maps of all independent components (ICs) containing neuronal signal. ICs related to noise are not displayed. MNI coordinates are provided below each spatial map.
2.8. Group differences in within network connectivity
Group differences in within network functional connectivity were tested for the 10 selected networks using a general linear model with 5000 permutations in Randomise (FMRIB Software Library randomise v2.9), with age as a covariate. Additionally, the interaction between diagnosis and age was tested within networks. Results were corrected for multiple comparisons, using Familywise Error (FWE) at p < 0.05 and threshold-free cluster enhancement (Smith and Nichols, 2009). Initially, medication status was added as a covariate in the design. However, as this had no significant effect on the results, it was removed in the final analyses.
All subjects' T1-weighted grey matter segmentations were used to construct an average grey matter mask that was used to constrain the analysis to grey matter. Finally, for components with significant between-group effects, the analysis was repeated with voxelwise grey matter density as an additional covariate in the design.
2.9. Group differences in between network connectivity
The temporal correlations between the ten selected networks were computed as a measure of between network connectivity strength using FSLNets v0.3 (FMRIB Software Library). First, Pearson's r correlation coefficients were calculated between the individual average time-courses for each of the ten selected networks. The resulting correlation matrices were then transformed to Fisher's z-values. To test for group differences, the individual correlation matrices were fed into a General Linear Model with 5000 permutations in Randomise (FMRIB Software Library randomise v2.9), with age as a covariate. Next the interaction between diagnosis and age was tested within networks. Results were corrected for multiple comparisons, using Familywise Error (FWE) at p < 0.05. A schematic of functional network hierarchy is obtained by the clustering of components driven by the direction and strength of the correlations between any two of the components in this analysis.
3. Results
3.1. Within network connectivity
There were no between-group differences within network boundaries (see: Fig. 2). However, we found an interaction between group and age within the Default Mode Network: In the right insula, within network connectivity increased with age for the boys with ASD, whereas it decreased with age for the typically developing boys (IC 19, pFWE = 0.023; MNI-coordinates: x = 13, y = 33, z = 18; see Fig. 3). This effect persisted after correction for grey matter density.
Fig. 2.
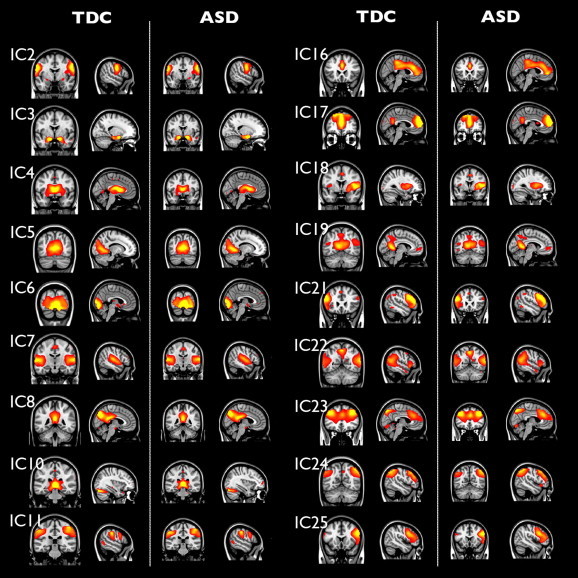
Independent components are similar for ASD and typically developing controls (TDC). Separate mean spatial maps for both diagnostic groups (same coordinates as Fig. 1). No significant differences between groups were found in these networks.
Fig. 3.
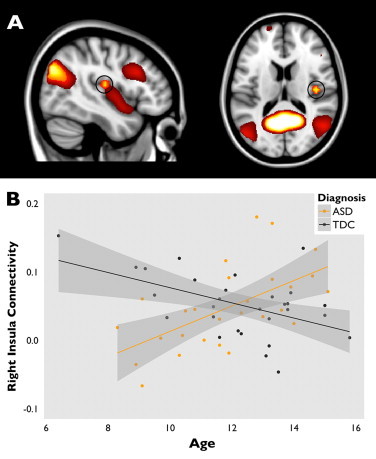
Developmental differences in within network connectivity in insula. Panel A shows the DMN (IC 19: shown in heat colours), including the right insula (circled), where there was an interaction effect of age and diagnostic status on within network connectivity. Panel B shows this interaction, with beta-values from the right insula cluster plotted against age (orange for ASD (r2 = .353) and grey for typically developing children (r2 = .253)).
The analysis method uses a whole-brain approach and does therefore not restrain the within network analyses to the boundaries of that network. Therefore, it is possible that clusters are detected outside the network boundaries that show between group differences in connectivity with that same network (Voets et al., 2012). Compared to typically developing children, children with ASD showed reduced connectivity between a Default Mode component (IC 19) and a cluster in right superior frontal gyrus/paracingulate (pFWE = 0.031; MNI coordinates: x = 25, y = 56, z = 20; Fig. 4A), which persisted after correcting for grey matter density. Connectivity was also reduced for individuals with ASD between a frontoparietal network (IC 22) and a small cluster in the right supramarginal gyrus (pFWE = 0.045; MNI coordinates: x = 9, y = 29, z = 25; Fig. 4B). However, this effect did not survive FWE-correction for multiple comparisons after correction for grey matter density (puncorr = 0.0002). Furthermore, the children with ASD showed reduced connectivity between a striatal network (IC 4), and a cluster in the left middle temporal gyrus (MTG) (pFWE = 0.018). This effect persisted after correction for grey matter density.
Fig. 4.
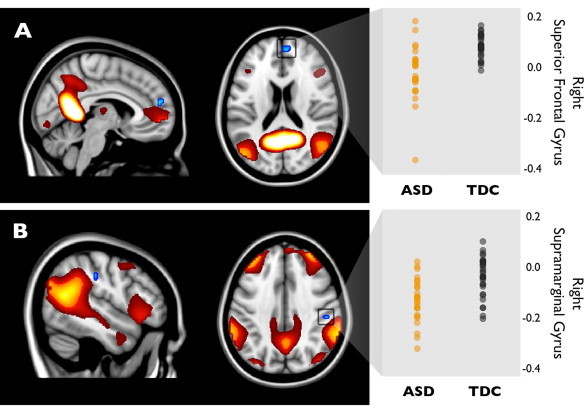
Reduced connectivity in higher order networks in ASD. Panel A shows reduced connectivity in ASD between the DMN (IC 19: heat colours) and a cluster in the right superior frontal gyrus (SFG; blue). Panel B shows the same for a frontoparietal network (IC22: heat colours) and a cluster in the right supramarginal gyrus (blue) (both Familywise Error corrected at p < 0.05). On the right, beta values for both blue clusters are displayed, representing the strength of connectivity for both diagnostic groups.
3.2. Between network connectivity
The strength of connectivity between a frontoparietal network (IC 22) and a cingulate gyrus network (IC 16) was significantly lower for children with ASD in comparison to typically developing children (pFWE = 0.042; see Fig. 5). Within the group of children with ASD these two networks showed no significant relation, whereas in typically developing children these two networks were positively correlated.
Fig. 5.
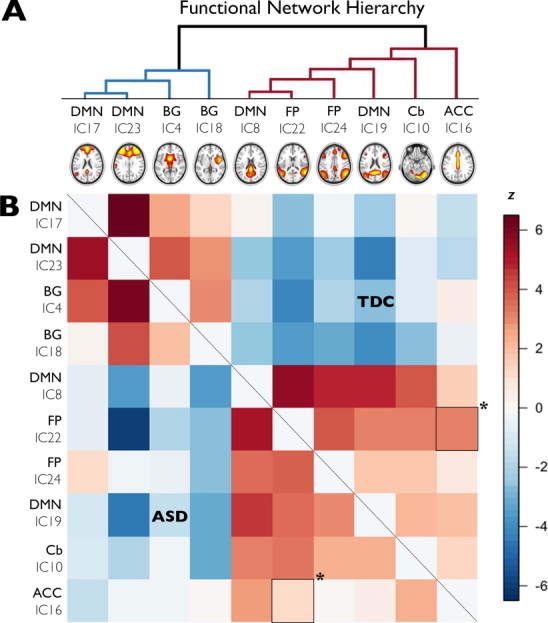
Limited differences in between network connectivity in ASD. Panel A shows the functional hierarchy of correlated and anti-correlated independent components (ICs) for the complete group of subjects. Each component that clusters under the blue lines (left) has a negative correlation with the components clustering under the red lines (right). Within these two groups of components (red and blue), the two components showing the strongest positive correlation are depicted on the bottom left. The further a component is placed to the right, the weaker its correlation with the other components. In panel B, correlations between component time-series are displayed with negative correlations in blue, and positive correlations in red. Correlations for the ASD group are shown under the diagonal, whereas correlations for the TDC group are above the diagonal. There is a between group difference in between-network connectivity between a frontoparietal network (IC 22) and the ACC network (IC 16) (demarcated with asterisk; p < 0.05, FWE corrected for multiple comparisons). DMN: Default Mode Network, BG: basal ganglia, FP: frontoparietal, Cb: cerebellum, ACC: anterior cingulate cortex.
4. Discussion
In this study we set out to investigate within and between network connectivity during rest in high-functioning boys with ASD and matched typically developing controls. Using group ICA, we identified ten resting-state networks related to higher-order cognitive functioning. We found most major adult resting-state networks to be present in our group of relatively young children. We found no differences in within-network connectivity between boys with ASD and controls, although there were subtle changes in between-network connectivity.
Although we did not find any group differences within the networks of interest, our approach permitted us to look beyond the boundaries of the intrinsic connectivity networks: it permitted testing all voxels in the brain that correlated with the network in order to detect differences in connectivity with areas that were less strongly connected with it. Using this method, we found subtle reductions in connectivity between the DMN and an area in the prefrontal cortex in ASD, as well as between a higher-order frontoparietal network and a parietal region. The first finding is consistent with earlier reports on reduced connectivity between superior frontal and more posterior regions of the brain in adults (Cherkassky et al., 2006; Monk et al., 2009; Weng et al., 2010; Wiggins et al., 2011) and children with ASD (Di Martino et al. 2013; Washington et al., 2014). It is noticeable that these areas are adjacent to the networks. It seems plausible that not all networks are fully mature at this young age (Fair et al., 2008; Fair et al., 2009; Jolles et al., 2011; de Bie et al., 2012) and while these areas are not as strongly connected at this young age, they may be incorporated into the network with development (Fair et al., 2007; Fair et al., 2008; Fair et al., 2009; Supekar et al., 2009; Power et al., 2010; Supekar et al., 2010). If interpreted in this way, these results could be taken to suggest that in children with ASD, the process of network development may be altered, or delayed. Further support for this hypothesis comes from our finding of reduced connectivity between networks, specifically between a frontoparietal network and cingulate network. This ties in to other reports on deficits in cognitive control and lower activity in the inferior parietal lobe and dorsal ACC in adults with ASD during performance in cognitive control tasks (Kana et al., 2007; Solomon et al., 2009; Agam et al., 2010).
Further, we found a developmental change in connectivity in ASD: connectivity within the DMN increased with age in subjects with ASD in the right insula, whereas it decreased with age in typically developing controls. This appears to be in contrast to earlier reports on insula function in adults with ASD showing reduced anterior insula activity during a variety of cognitive tasks and resting-state (Uddin and Menon, 2009; Ebisch et al., 2011; von dem Hagen et al., 2013). The insula is a functionally heterogeneous region (Seeley et al., 2007; Menon and Uddin, 2010; Xue et al., 2010; Kelly et al., 2012), with clear functional differentiation between the anterior and posterior insula (Craig, 2002; Critchley et al., 2004). One explanation could be that increased activity in this region is compensatory, in reaction to less effective connectivity of the anterior insula.
Finally, even though we report subtle regional differences in between network connectivity in ASD, the global architecture of the resting-state networks seems intact in our relatively young sample of children with ASD. These findings correspond to recently reported findings of largely typical resting-state functional connectivity in adults with ASD (Tyszka et al., 2013). However, our results challenge the suggestion that differences in functional connectivity may be most pronounced during development (Anderson et al., 2011), followed by normalization into adulthood (Tyszka et al., 2011; Tyszka et al., 2013). Using a similar data-driven approach, our data indicate that although there are some changes in communication between networks, functional connectivity during rest is largely intact in children with ASD.
There are some limitations that need to be taken into consideration. First, motion is a known confounder in fMRI research with children, especially in connectivity analyses (Power et al., 2012; Van Dijk et al., 2012). We addressed this by excluding subjects with excessive motion and stringently removing motion artefacts from the data at the single-subject level. Second, 12 out of our 27 subjects with ASD were on stimulant medication. In order to minimize the effects of medication, subjects were instructed not to take their medication 24 h prior to scanning. This strategy appears to have been effective, as medication status had no significant effect on the results. Third, we could not actively monitor subjects during the acquisition of the resting-state scan. However, none of the subjects reported falling asleep during the scan during debriefing. Finally, we acknowledge that our sample size is modest compared to collaborative resting-state fMRI datasets, such as the ABIDE-initiative. Nonetheless, the subjects included here represent an independent sample, and such datasets will be essential, not only for replicating findings from such datasets, but also for generating new hypotheses to be tested with them.
In conclusion, although we report subtle changes in between network connectivity in young children with ASD, the global architecture of resting-state networks appears to be intact. This argues against recent suggestions that changes in connectivity in ASD may be most prominent during development.
Acknowledgements
The authors would like to thank all the participants and their parents of this study. Furthermore, we thank Juliette Weusten and Sarai van Dijk for the assistance with subject recruitment and MRI assessments. This study was financially supported by the Hersenstichting (F2009(1)-17) and the National Initiative Brain and Cognition (NIHC 056-13-011) of the Netherlands Organization for Scientific Research (NWO). All authors report no (financial) conflicts of interest.
References
- Agam Y., Joseph R.M., Barton J.J.S., Manoach D.S. Reduced cognitive control of response inhibition by the anterior cingulate cortex in autism spectrum disorders. NeuroImage. 2010;52(1):336–347. doi: 10.1016/j.neuroimage.2010.04.010. 20394829 [DOI] [PMC free article] [PubMed] [Google Scholar]
- Allen G., McColl R., Barnard H., Ringe W.K., Fleckenstein J., Cullum C.M. Magnetic resonance imaging of cerebellar–prefrontal and cerebellar–parietal functional connectivity. NeuroImage. 2005;28(1):39–48. doi: 10.1016/j.neuroimage.2005.06.013. 16023375 [DOI] [PubMed] [Google Scholar]
- American Psychiatric Association . Diagnostic and Statistical Manual of Mental Disorders. fourth edition. American Psychiatric Publishing; Washington, D.C.: 1994. [Google Scholar]
- Anderson J.S., Druzgal T.J., Froehlich A., DuBray M.B., Lange N., Alexander A.L., Lainhart J.E. Decreased interhemispheric functional connectivity in autism. Cerebral Cortex (New York, N.Y.: 1991) 2011;21(5):1134–1146. doi: 10.1093/cercor/bhq190. 20943668 [DOI] [PMC free article] [PubMed] [Google Scholar]
- Assaf M., Jagannathan K., Calhoun V.D., Miller L., Stevens M.C., Sahl R., Pearlson G.D. Abnormal functional connectivity of default mode sub-networks in autism spectrum disorder patients. NeuroImage. 2010;53(1):247–256. doi: 10.1016/j.neuroimage.2010.05.067. 20621638 [DOI] [PMC free article] [PubMed] [Google Scholar]
- Beckmann C.F., DeLuca M., Devlin J.T., Smith S.M. Investigations into resting-state connectivity using independent component analysis. Philosophical Transactions of the Royal Society B Biological Sciences. 2005;360:39–48. doi: 10.1098/rstb.2005.1634. [DOI] [PMC free article] [PubMed] [Google Scholar]
- Bell A.J., Sejnowski T.J. An information-maximization approach to blind separation and blind deconvolution. Neural Computation. 1995;7(6):1129–1159. doi: 10.1162/neco.1995.7.6.1129. 7584893 [DOI] [PubMed] [Google Scholar]
- Belmonte M.K., Allen G., Beckel-Mitchener A., Boulanger L.M., Carper R.A., Webb S.J. Autism and abnormal development of brain connectivity. Journal of Neuroscience: the Official Journal of the Society for Neuroscience. 2004;24(42):9228–9231. doi: 10.1523/JNEUROSCI.3340-04.2004. 15496656 [DOI] [PMC free article] [PubMed] [Google Scholar]
- Calhoun V.D., Adali T., Pearlson G.D., Pekar J.J. A method for making group inferences from functional MRI data using independent component analysis. Human Brain Mapping. 2001;14:140–151. doi: 10.1002/hbm.1048. 11559959 [DOI] [PMC free article] [PubMed] [Google Scholar]
- Cherkassky V.L., Kana R.K., Keller T.A., Just M.A. Functional connectivity in a baseline resting-state network in autism. Neuroreport. 2006;17(16):1687–1690. doi: 10.1097/01.wnr.0000239956.45448.4c. 17047454 [DOI] [PubMed] [Google Scholar]
- Costello E.J., Edelbrock C.S., Costello A.J. Validity of the NIMH Diagnostic Interview Schedule for Children: a comparison between psychiatric and pediatric referrals. Journal of Abnormal Child Psychology. 1985;13(4):579–595. doi: 10.1007/BF00923143. 4078188 [DOI] [PubMed] [Google Scholar]
- Courchesne E., Pierce K. Why the frontal cortex in autism might be talking only to itself: local over-connectivity but long-distance disconnection. Current Opinion in Neurobiology. 2005;15(2):225–230. doi: 10.1016/j.conb.2005.03.001. 15831407 [DOI] [PubMed] [Google Scholar]
- Craig A.D. How do you feel? Interoception: the sense of the physiological condition of the body. Nature Reviews. Neuroscience. 2002;3(8):655–666. doi: 10.1038/nrn894. 12154366 [DOI] [PubMed] [Google Scholar]
- Critchley H.D., Wiens S., Rotshtein P., Ohman A., Dolan R.J. Neural systems supporting interoceptive awareness. Nature Neuroscience. 2004;7(2):189–195. doi: 10.1038/nn1176. 14730305 [DOI] [PubMed] [Google Scholar]
- Damoiseaux J.S., Rombouts S.A.R.B., Barkhof F., Scheltens P., Stam C.J., Smith S.M., Beckmann C.F. Consistent resting-state networks across healthy subjects. Proceedings of the National Academy of Sciences of the United States of America. 2006;103(37):13848–13853. doi: 10.1073/pnas.0601417103. 16945915 [DOI] [PMC free article] [PubMed] [Google Scholar]
- De Bie H.M.a., Boersma M., Adriaanse S., Veltman D.J., Wink A.M., Roosendaal S.D., Sanz-Arigita E.J. Resting-state networks in awake five- to eight-year old children. Human Brain Mapping. 2012;33(5):1189–1201. doi: 10.1002/hbm.21280. 21520347 [DOI] [PMC free article] [PubMed] [Google Scholar]
- Martino a Di, Yan C.-G., Li Q., Denio E., Castellanos F.X., Alaerts K., Anderson J.S., Assaf M., Bookheimer S.Y., Dapretto M., Deen B., Delmonte S., Dinstein I., Ertl-Wagner B., Fair D.a, Gallagher L., Kennedy D.P., Keown C.L., Keysers C., Lainhart J.E., Lord C., Luna B., Menon V., Minshew N.J., Monk C.S., Mueller S., Müller R., Nebel M.B., Nigg J.T., O’Hearn K., Pelphrey K.a, Peltier S.J., Rudie J.D., Sunaert S., Thioux M., Tyszka J.M., Uddin L.Q., Verhoeven J.S., Wenderoth N., Wiggins J.L., Mostofsky S.H., Milham M.P. The autism brain imaging data exchange: towards a large-scale evaluation of the intrinsic brain architecture in autism. Molecular Psychiatry. 2013:1–9. doi: 10.1038/mp.2013.78. [DOI] [PMC free article] [PubMed] [Google Scholar]
- Di Martino A., Kelly C., Grzadzinski R., Zuo X.-N., Mennes M., Mairena M.A., Milham M.P. Aberrant striatal functional connectivity in children with autism. Biological Psychiatry. 2011;69(9):847–856. doi: 10.1016/j.biopsych.2010.10.029. 21195388 [DOI] [PMC free article] [PubMed] [Google Scholar]
- Durston S., Nederveen H., van Dijk S., van Belle J., de Zeeuw P., Langen M., van Dijk A. Magnetic resonance simulation is effective in reducing anxiety related to magnetic resonance scanning in children. Journal of the American Academy of Child and Adolescent Psychiatry. 2009;48(2):206–207. doi: 10.1097/CHI.0b013e3181930673. 20040825 [DOI] [PubMed] [Google Scholar]
- Ebisch S.J.H., Gallese V., Willems R.M., Mantini D., Groen W.B., Romani G.L., Bekkering H. Altered intrinsic functional connectivity of anterior and posterior insula regions in high-functioning participants with autism spectrum disorder. Human Brain Mapping. 2011;32(7):1013–1028. doi: 10.1002/hbm.21085. 20645311 [DOI] [PMC free article] [PubMed] [Google Scholar]
- Erhardt E.B., Rachakonda S., Bedrick E.J., Allen E.A., Adali T., Calhoun V.D. Comparison of multi-subject ICA methods for analysis of fMRI data. Human Brain Mapping. 2011;2095:2075–2095. doi: 10.1002/hbm.21170. 21162045 [DOI] [PMC free article] [PubMed] [Google Scholar]
- Fair D.A., Cohen A.L., Dosenbach N.U.F., Church J.A., Miezin F.M., Barch D.M., Schlaggar B.L. The maturing architecture of the brain's default network. Proceedings of the National Academy of Sciences of the United States of America. 2008;105(10):4028–4032. doi: 10.1073/pnas.0800376105. 18322013 [DOI] [PMC free article] [PubMed] [Google Scholar]
- Fair D.A., Cohen A.L., Power J.D., Dosenbach N.U.F., Church J.A., Miezin F.M., Petersen S.E. Functional brain networks develop from a “local to distributed” organization. PLOS Computational Biology. 2009;5(5) doi: 10.1371/journal.pcbi.1000381. [DOI] [PMC free article] [PubMed] [Google Scholar]
- Fair D.A., Dosenbach N.U.F., Church J.a., Cohen A.L., Brahmbhatt S., Miezin F.M., Schlaggar B.L. Development of distinct control networks through segregation and integration. Proceedings of the National Academy of Sciences of the United States of America. 2007;104(33):13507–13512. doi: 10.1073/pnas.0705843104. 17679691 [DOI] [PMC free article] [PubMed] [Google Scholar]
- Fox M.D., Snyder A.Z., Vincent J.L., Corbetta M., Van Essen D.C., Raichle M.E. The human brain is intrinsically organized into dynamic, anticorrelated functional networks. Proceedings of the National Academy of Sciences of the United States of America. 2005;102(27):9673–9678. doi: 10.1073/pnas.0504136102. 15976020 [DOI] [PMC free article] [PubMed] [Google Scholar]
- Geschwind D.H., Levitt P. Autism spectrum disorders: developmental disconnection syndromes. Current Opinion in Neurobiology. 2007;17(1):103–111. doi: 10.1016/j.conb.2007.01.009. 17275283 [DOI] [PubMed] [Google Scholar]
- Greicius M.D., Flores B.H., Menon V., Glover G.H., Solvason H.B., Kenna H., Reiss A.L., Schatzberg A.F. Resting-state functional connectivity in major depression: abnormally increased contributions from subgenual cingulate cortex and thalamus. Biological Psychiatry. 2007;62:429–437. doi: 10.1016/j.biopsych.2006.09.020. [DOI] [PMC free article] [PubMed] [Google Scholar]
- Greicius M.D., Krasnow B., Reiss A.L., Menon V. Functional connectivity in the resting brain: a network analysis of the default mode hypothesis. Proceedings of the National Academy of Sciences of the United States of America. 2003;100(1):253–258. doi: 10.1073/pnas.0135058100. 12506194 [DOI] [PMC free article] [PubMed] [Google Scholar]
- Habas C., Kamdar N., Nguyen D., Prater K., Beckmann C.F., Menon V., Greicius M.D. Distinct cerebellar contributions to intrinsic connectivity networks. Journal of Neuroscience: the Official Journal of the Society for Neuroscience. 2009;29(26):8586–8594. doi: 10.1523/JNEUROSCI.1868-09.2009. 19571149 [DOI] [PMC free article] [PubMed] [Google Scholar]
- Himberg J., Hÿvarinen A., Esposito F. Validating the independent components of neuroimaging time series via clustering and visualization. Neuroimage. 2004;22:1214–1222. doi: 10.1016/j.neuroimage.2004.03.027. 15219593 [DOI] [PubMed] [Google Scholar]
- Jolles D.D., van Buchem M.A., Crone E.A., Rombouts S.A.R.B. A comprehensive study of whole-brain functional connectivity in children and young adults. Cereb Cortex (New York, N.Y.: 1991) 2011;21(2):385–391. doi: 10.1093/cercor/bhq104. [DOI] [PubMed] [Google Scholar]
- Just M.A., Cherkassky V.L., Keller T.A., Kana R.K., Minshew N.J. Functional and anatomical cortical underconnectivity in autism: evidence from an FMRI study of an executive function task and corpus callosum morphometry. Cerebral Cortex (New York, N.Y.: 1991) 2007;17(4):951–961. doi: 10.1093/cercor/bhl006. 16772313 [DOI] [PMC free article] [PubMed] [Google Scholar]
- Just M.A., Cherkassky V.L., Keller T.a., Minshew N.J. Cortical activation and synchronization during sentence comprehension in high-functioning autism: evidence of underconnectivity. Brain: A Journal of Neurology. 2004;127(8):1811–1821. doi: 10.1093/brain/awh199. 15215213 [DOI] [PubMed] [Google Scholar]
- Kana R.K., Keller T.A., Minshew N.J., Just M.A. Inhibitory control in high-functioning autism: decreased activation and underconnectivity in inhibition networks. Biological Psychiatry. 2007;62(3):198–206. doi: 10.1016/j.biopsych.2006.08.004. 17137558 [DOI] [PMC free article] [PubMed] [Google Scholar]
- Kelly C., Toro R., Di Martino A., Cox C.L., Bellec P., Castellanos F.X., Milham M.P. A convergent functional architecture of the insula emerges across imaging modalities. NeuroImage. 2012;61(4):1129–1142. doi: 10.1016/j.neuroimage.2012.03.021. 22440648 [DOI] [PMC free article] [PubMed] [Google Scholar]
- Kleinhans N.M., Richards T., Sterling L., Stegbauer K.C., Mahurin R., Johnson L.C., Aylward E. Abnormal functional connectivity in autism spectrum disorders during face processing. Brain: A Journal of Neurology. 2008;131(4):1000–1012. doi: 10.1093/brain/awm334. 18234695 [DOI] [PubMed] [Google Scholar]
- Kort W., Schittekatte M., Dekker P.H., Verhaeghe P., Compaan E.L., Bosmans M. Wechsler Intelligence Scale for Children. third edition. Psychological Corporation; London: 2005. [Google Scholar]
- Koshino H., Carpenter P.A., Minshew N.J., Cherkassky V.L., Keller T.A., Just M.A. Functional connectivity in an fMRI working memory task in high-functioning autism. NeuroImage. 2005;24(3):810–821. doi: 10.1016/j.neuroimage.2004.09.028. 15652316 [DOI] [PubMed] [Google Scholar]
- Laird A.R., Fox P.M., Eickhoff S.B., Turner J.A., Ray K.L., McKay D.R., Fox P.T. Behavioral interpretations of intrinsic connectivity networks. Journal of Cognitive Neuroscience. 2011;23(12):4022–4037. doi: 10.1162/jocn_a_00077. 21671731 [DOI] [PMC free article] [PubMed] [Google Scholar]
- Langen M., Schnack H.G., Nederveen H., Bos D., Lahuis B.E., de Jonge M.V., Durston S. Changes in the developmental trajectories of striatum in autism. Biological Psychiatry. 2009;66(4):327–333. doi: 10.1016/j.biopsych.2009.03.017. 19423078 [DOI] [PubMed] [Google Scholar]
- Li Y.O., Adali T., Calhoun V.D. Estimating the number of independent components for functional magnetic resonance imaging data. Human Brain Mapping. 2007;28:1251–1266. doi: 10.1002/hbm.20359. 17274023 [DOI] [PMC free article] [PubMed] [Google Scholar]
- Lord C., Rutter M., Le Couteur a. Autism Diagnostic Interview — Revised: a revised version of a diagnostic interview for caregivers of individuals with possible pervasive developmental disorders. Journal of Autism and Developmental Disorders. 1994;24(5):659–685. doi: 10.1007/BF02172145. 7814313 [DOI] [PubMed] [Google Scholar]
- Lynch C.J., Uddin L.Q., Khouzam A., Phillips J., Menon V. Default mode network in childhood autism: posteromedial cortex heterogeneity and relationship with social deficits. Biological Psychiatry. 2013;74(3):212–219. doi: 10.1016/j.biopsych.2012.12.013. 23375976 [DOI] [PMC free article] [PubMed] [Google Scholar]
- Menon V., Uddin L.Q. Brain Structure & Function. 2010;214(5–6):655–667. doi: 10.1007/s00429-010-0262-0. 20512370 [DOI] [PMC free article] [PubMed] [Google Scholar]
- Minshew N.J., Keller T.A. The nature of brain dysfunction in autism: functional brain imaging studies. Current Opinion in Neurology. 2010;23(2):124–130. doi: 10.1097/WCO.0b013e32833782d4. 20154614 [DOI] [PMC free article] [PubMed] [Google Scholar]
- Mizuno A., Villalobos M.E., Davies M.M., Dahl B.C., Müller R.-A. Partially enhanced thalamocortical functional connectivity in autism. Brain Research. 2006;1104(1):160–174. doi: 10.1016/j.brainres.2006.05.064. 16828063 [DOI] [PubMed] [Google Scholar]
- Monk C.S., Peltier S.J., Wiggins J.L., Weng S.-J., Carrasco M., Risi S., Lord C. Abnormalities of intrinsic functional connectivity in autism spectrum disorders. NeuroImage. 2009;47(2):764–772. doi: 10.1016/j.neuroimage.2009.04.069. 19409498 [DOI] [PMC free article] [PubMed] [Google Scholar]
- Padmanabhan A., Lynn A., Foran W., Luna B., O’Hearn K. Age related changes in striatal resting state functional connectivity in autism. Frontiers in Human Neuroscience. 2013;7(814) doi: 10.3389/fnhum.2013.00814. [DOI] [PMC free article] [PubMed] [Google Scholar]
- Power J.D., Barnes K.A., Snyder A.Z., Schlaggar B.L., Petersen S.E. Spurious but systematic correlations in functional connectivity MRI networks arise from subject motion. NeuroImage. 2012;59(3):2142–2154. doi: 10.1016/j.neuroimage.2011.10.018. 22019881 [DOI] [PMC free article] [PubMed] [Google Scholar]
- Power J.D., Fair D.a., Schlaggar B.L., Petersen S.E. The development of human functional brain networks. Neuron. 2010;67(5):735–748. doi: 10.1016/j.neuron.2010.08.017. 20826306 [DOI] [PMC free article] [PubMed] [Google Scholar]
- Seeley W.W., Menon V., Schatzberg A.F., Keller J., Glover G.H., Kenna H., Greicius M.D. Dissociable intrinsic connectivity networks for salience processing and executive control. Journal of Neuroscience: the Official Journal of the Society for Neuroscience. 2007;27(9):2349–2356. doi: 10.1523/JNEUROSCI.5587-06.2007. 17329432 [DOI] [PMC free article] [PubMed] [Google Scholar]
- Shih P., Shen M., Ottl B., Keehn B., Gaffrey M.S., Müller R.-A. Atypical network connectivity for imitation in autism spectrum disorder. Neuropsychologia. 2010;48(10):2931–2939. doi: 10.1016/j.neuropsychologia.2010.05.035. 20558187 [DOI] [PMC free article] [PubMed] [Google Scholar]
- Shirer W.R., Ryali S., Rykhlevskaia E., Menon V., Greicius M.D. Decoding subject-driven cognitive states with whole-brain connectivity patterns. Cerebral Cortex (New York, N.Y.: 1991) 2012;22(1):158–165. doi: 10.1093/cercor/bhr099. 21616982 [DOI] [PMC free article] [PubMed] [Google Scholar]
- Smith S.M., Nichols T.E. Threshold-free cluster enhancement: addressing problems of smoothing, threshold dependence and localisation in cluster inference. NeuroImage. 2009;44(1):83–98. doi: 10.1016/j.neuroimage.2008.03.061. 18501637 [DOI] [PubMed] [Google Scholar]
- Solomon M., Ozonoff S.J., Ursu S., Ravizza S., Cummings N., Ly S., Carter C.S. The neural substrates of cognitive control deficits in autism spectrum disorders. Neuropsychologia. 2009;47(12):2515–2526. doi: 10.1016/j.neuropsychologia.2009.04.019. 19410583 [DOI] [PMC free article] [PubMed] [Google Scholar]
- Supekar K., Musen M., Menon V. Development of large-scale functional brain networks in children. PLOS Biology. 2009;7(7) doi: 10.1371/journal.pbio.1000157. [DOI] [PMC free article] [PubMed] [Google Scholar]
- Supekar K., Uddin L.Q., Prater K., Amin H., Greicius M.D., Menon V. Development of functional and structural connectivity within the default mode network in young children. NeuroImage. 2010;52(1):290–301. doi: 10.1016/j.neuroimage.2010.04.009. 20385244 [DOI] [PMC free article] [PubMed] [Google Scholar]
- Turner K.C., Frost L., Linsenbardt D., McIlroy J.R., Müller R.-A. Atypically diffuse functional connectivity between caudate nuclei and cerebral cortex in autism. Behavioral and Brain Functions: BBF. 2006;2:34. doi: 10.1186/1744-9081-2-34. 17042953 [DOI] [PMC free article] [PubMed] [Google Scholar]
- Tyszka J.M., Kennedy D.P., Adolphs R., Paul L.K. Intact bilateral resting-state networks in the absence of the corpus callosum. Journal of Neuroscience: the Official Journal of the Society for Neuroscience. 2011;31(42):15154–15162. doi: 10.1523/JNEUROSCI.1453-11.2011. 22016549 [DOI] [PMC free article] [PubMed] [Google Scholar]
- Tyszka J.M., Kennedy D.P., Paul L.K., Adolphs R. Largely typical patterns of resting-state functional connectivity in high-functioning adults with autism. Cerebral Cortex (New York, N.Y.: 1991) 2013 doi: 10.1093/cercor/bht040. 23425893 [DOI] [PMC free article] [PubMed] [Google Scholar]
- Uddin L.Q., Menon V. The anterior insula in autism: under-connected and under-examined. Neuroscience and Biobehavioral Reviews. 2009;33(8):1198–1203. doi: 10.1016/j.neubiorev.2009.06.002. 19538989 [DOI] [PMC free article] [PubMed] [Google Scholar]
- Van Dijk K.R.A., Sabuncu M.R., Buckner R.L. The influence of head motion on intrinsic functional connectivity MRI. NeuroImage. 2012;59(1):431–438. doi: 10.1016/j.neuroimage.2011.07.044. 21810475 [DOI] [PMC free article] [PubMed] [Google Scholar]
- Villalobos M.E., Mizuno A., Dahl B.C., Kemmotsu N. Reduced functional connectivity between V1 and inferior frontal cortex associated with visuomotor performance in autism. NeuroImage. 2012;25(3):916–925. doi: 10.1016/j.neuroimage.2004.12.022. [DOI] [PMC free article] [PubMed] [Google Scholar]
- Vincent J.L., Kahn I., Snyder A.Z., Raichle M.E., Buckner R.L. Evidence for a frontoparietal control system revealed by intrinsic functional connectivity. Journal of Neurophysiology. 2008;100(6):3328–3342. doi: 10.1152/jn.90355.2008. 18799601 [DOI] [PMC free article] [PubMed] [Google Scholar]
- Voets N.L., Beckmann C.F., Cole D.M., Hong S., Bernasconi A., Bernasconi N. Structural substrates for resting network disruption in temporal lobe epilepsy. Brain: A Journal of Neurology. 2012;135(8):2350–2357. doi: 10.1093/brain/aws137. 22669081 [DOI] [PubMed] [Google Scholar]
- Von dem Hagen E.A.H., Stoyanova R.S., Baron-Cohen S., Calder A.J. Reduced functional connectivity within and between “social” resting state networks in autism spectrum conditions. Social Cognitive and Affective Neuroscience. 2013;8:694–701. doi: 10.1093/scan/nss053. 22563003 [DOI] [PMC free article] [PubMed] [Google Scholar]
- Washington S.D., Gordon E.M., Brar J., Warburton S., Sawyer A.T., Wolfe A., VanMeter J.W. Dysmaturation of the default mode network in autism. Human Brain Mapping. 2014;35(4):1284–1296. doi: 10.1002/hbm.22252. 23334984 [DOI] [PMC free article] [PubMed] [Google Scholar]
- Weng S.-J., Wiggins J.L., Peltier S.J., Carrasco M., Risi S., Lord C., Monk C.S. Alterations of resting state functional connectivity in the default network in adolescents with autism spectrum disorders. Brain Research. 2010;1313(May):202–214. doi: 10.1016/j.brainres.2009.11.057. 20004180 [DOI] [PMC free article] [PubMed] [Google Scholar]
- Wiggins J.L., Peltier S.J., Ashinoff S., Weng S.-J., Carrasco M., Welsh R.C., Monk C.S. Using a self-organizing map algorithm to detect age-related changes in functional connectivity during rest in autism spectrum disorders. Brain Research. 2011;1380:187–197. doi: 10.1016/j.brainres.2010.10.102. 21047495 [DOI] [PMC free article] [PubMed] [Google Scholar]
- Xue G., Lu Z., Levin I.P., Bechara A. The impact of prior risk experiences on subsequent risky decision-making: the role of the insula. NeuroImage. 2010;50(2):709–716. doi: 10.1016/j.neuroimage.2009.12.097. 20045470 [DOI] [PMC free article] [PubMed] [Google Scholar]