

Abstract
Background:
Obesity is a risk factor for type 2 diabetes mellitus which may be addressed by application of intensive lifestyle interventions. Thus, establishing normative values of anthropometric indices in our environment is crucial. This study aimed to determine normative values of anthropometric indices of nutrition among residents of Calabar.
Materials and Methods:
This cross sectional observational study recruited residents of Calabar aged between 15-79 years using a multistage sampling method. Trained research assistants collected socio-demographic data and did anthropometric measurements.
Results:
There were 645 (56.5%) males and 489 (43.1%) females. Males had significantly lower general adiposity and hip circumference (HC) than females while females had significantly lower waist circumference (WC) and waist hip ratio (WHR) than males. The WHR increased with age particularly among males. Body mass index (BMI) also increased with age in both males and females with a peak in the middle age bracket, followed by a decline among the elderly. The mean (SD) BMI was 27.7 (5.0) kg/m2. Males had a mean (SD) BMI of 27.0 (4.4) kg/m2, while females had a mean (SD) BMI of 28.5 (5.5) kg/m2 respectively. WC correlated positively and significantly with BMI and WHR in males and females. WHR correlated positively and significantly with BMI in males and females.
Conclusion:
There are positive linear inter relationships between the indices of nutrition which is strongest between WC and BMI. In view of the strong independent association of DM with indices of nutrition, it is appropriate to derive normal cut-off values for WC, WHR and BMI nationally.
Keywords: Anthropometric indices, body mass index, Calabar, dysglycaemia, normative values
INTRODUCTION
Anthropometric indices are important clinical parameters which can be easily assessed at a low cost. Obesity has been implicated as a risk factor for type 2 diabetes mellitus (DM) with the pattern of centrally distributed body fat (visceral adiposity) conferring a greater risk than a similar degree of excess that is more uniformly distributed.[1,2,3] The proven link between anthropometric indices and dysglycaemiahas immense public health implications. Dysglycaemia refers to the continuum of impaired glucose tolerance (IGT), impaired fasting glucose (IFG) and type 2 DM.[4] Application of intensive lifestyle interventions among pre-diabetic populations with IGT and IFG could potentially reduce the occurrence of DM. Thus, establishing normative values of anthropometric indices in our environment may be an important first step.
This study aimed to determine normative values of anthropometric indices of nutrition among residents of Calabar.
MATERIALS AND METHODS
Study area
The research was carried out in Calabar, the capital of Cross River State of Nigeria with a population of 371,022.[5]
Study design
This cross sectional observational study recruited residents of Calabar aged between 15-79 years. Pregnant or breast feeding women were excluded.
Ethical considerations
Ethical approval was obtained from the Health Research and Ethics Committee of the Cross River State Ministry of Health, Nigeria. High ethical standards were maintained throughout the entire duration of the study. A signed informed consent was obtained from each participant after detailed explanation of the study objectives and they were free to withdraw from the study at any point. For participants between the age range of 15-18 years, parental consent was obtained.
Sampling
A multistage sampling method was applied to a sampling frame of 22 wards in Calabar. A random sampling technique was used to select four wards. A table of random numbers was utilized to select 50 house-holds from each of the four wards using the census enumeration list from the 2006 national population census. From each of the 200 house-holds selected, eligible individuals were selected.
Study procedure
Trained research assistants comprising medical doctors and medical students were involved in data collection using the World Health Organization (WHO) STEPS instrument.[6] A detailed description of the study objectives, examination process and study confidentiality was provided in English and Efik after which socio-demographic data was obtained. Participants were then requested to come to designated health centres within their vicinity for anthropometry. The following physical measurements were carried out:
Weight: This was done with a weighing scale Detecto PD300DHR Digital-ProDoc (USA) without shoes and with the participants wearing light clothing to the nearest 0.1 kg
Height: This was done with a stadiometre Prestige HM0016D (India) and to the nearest 0.1 metre
WC: With the aid of a non-stretch tape, the WC was taken midway between the inferior margin of the last rib and the iliac crest in a horizontal plane to the nearest 0.1 cm at the end of normal expiration
Hip circumference (HC): This was measured at the level of the greater trochanters with the participants wearing light clothing to the nearest 0.1 cm.
The following definitions were utilized:
Central obesity: WC ≥102 cm (males) ≥88 cm (females) or WHR ≥0.90 (males) ≥0.85 (females)
-
BMI category
- Underweight: BMI <18.5 kg/m2
- Normal weight: BMI 18.5-24.9 kg/m2
- Overweight: BMI 25.0-29.9 kg/m2
- Obesity: BMI ≥30 kg/m21
-
Age category
- Young Age: Age 15 to 39 years
- Middle Age: Age 40 to 59 years
- Elderly Age: Age ≥60 years
- Normal Range: The normal range for values of anthropometric indices was defined as mean values ± 2SD or 95% confidence interval.
Statistical analysis was done using the statistical package for social sciences (SPSS) version 20.0 (SPSS Inc, Chicago, IL, USA). Comparison of means between two groups was done using the student's t-test. Chi-square (χ2) test was used to find associations between categorical variables and to test for differences in proportion. The level of significance was taken as P < 0.05.
RESULTS
Socio-demographic characteristics
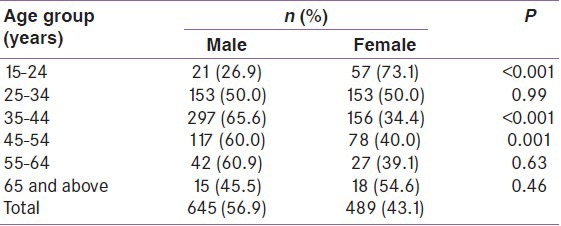
A total of 645 (56.5%) males and 489 (43.1%) females participated in the study. Majority were in their third and fourth decade of life as shown in Table 1. There were more females among the elderly and the young age group, and more males than females among the middle age group.
Table 1.
Distribution of participants by age and sex
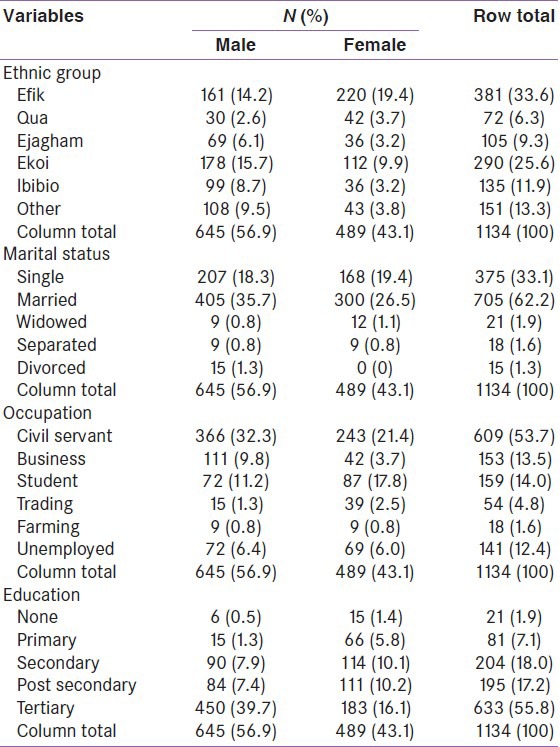
The ethnic representations were Efik (33%), Ekoi (25.6%), and other ethnicities made up 41.1%. About one third of the participants were single and about two thirds were married. Male civil servants made up 32%, female civil servants 21% and about 14% were students while the unemployment rate was 12.4% (males 6.4%; females 6.0%) as shown in Table 2. There was a preponderance of females with no formal education than males, while 35% had at least post-secondary education and more than half the participants had at least tertiary education.
Table 2.
Distribution of study participants by other demographic characteristics and sex
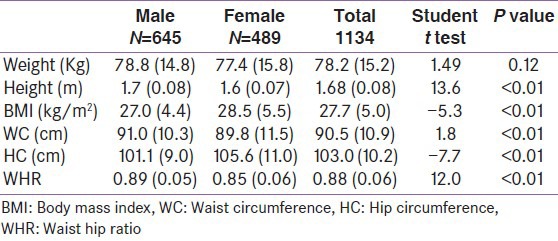
The mean (SD) age of the participants was 38.9 (11.1) years. The mean (SD) ages of the males and females were 39.7 (10.2) and 37.7 (12.2) years respectively, with the former being older; P < 0.001. Table 3 shows the distribution of the study participants by sex. Males had significantly lower general adiposity (27.0 kg/m2 Vs 28.5 kg/m2); and HC (101 cm Vs 106 cm) than females while females had significantly lower WC (90 cm Vs 91 cm) and WHR (0.85 Vs 0.89) than males.
Table 3.
Comparison of the anthropometric and clinical indices of participants
Normative values of indices of anthropometry
Table 4 shows the normative values of indices of anthropometry in male participants. The mean height, weight and BMI of males were 1.7 m (0.08), 78.8 kg (14.8) and 27.0 kg/m2 (4.4) respectively as shown in Table 4. The median of anthropometric indices in males was similar to the mean. The shortest male participant was 1.45 m tall and the heaviest weighed 119 kg.
Table 4.
Normative values of anthropometry in males
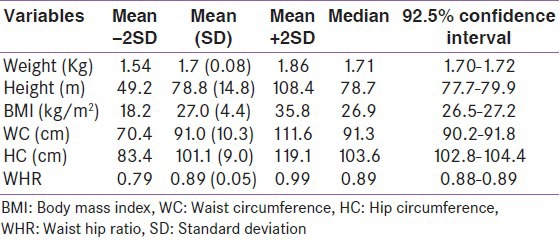
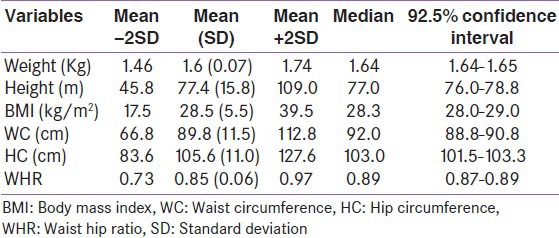
Table 5 shows the normative values of indices of anthropometry in female participants. The mean WC, HC, and WHR of females were 89.8 cm (11.5), 105.6 cm (11.0) and 0.85 (0.06) respectively. The median of anthropometric indices in males were similar to the mean. The shortest female participant was 1.49 m tall and the heaviest weighed 131 kg.
Table 5.
Normative values of anthropometry in females
WC distributed by age and sex
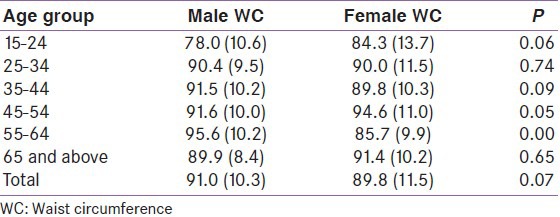
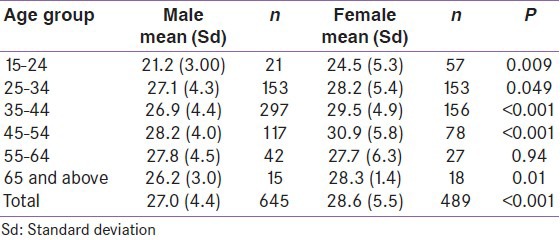
Table 6 shows the mean (SD) WC of the study participants according to age and sex. The mean (SD) WC was 91.0 (10.3) cm in males and 89.8 (11.5) cm in females (P = 0.07). The largest WC values in both sexes were seen in the middle age bracket. Among elderly participants, females had larger WC than males, but the difference was not statistically significant.
Table 6.
Waist circumference distributed by age and sex among study participants
WHR distributed by age and sex
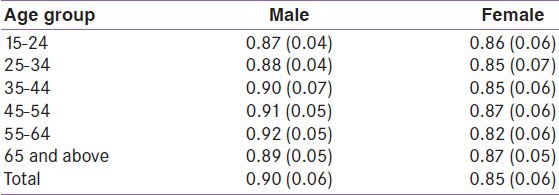
The mean (SD) WHR for males and females were 0.90 (0.06) and 0.85 (0.06) respectively. The WHR increased with age particularly among males as shown in Table 7. The highest values of mean WHR were also observed in the middle age group in both sexes.
Table 7.
Waist hip ratio distributed by age and sex among the study participants
Distribution of WC quartiles by sex
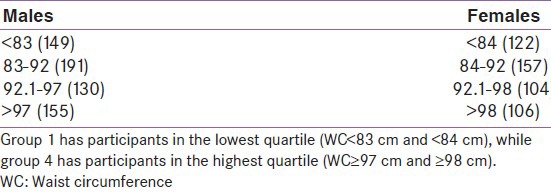
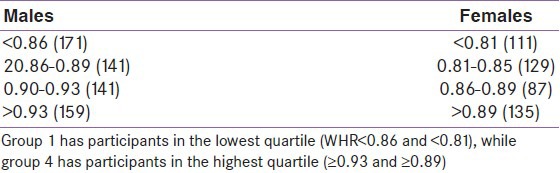
The WC was divided into four groups based on quartiles of distribution [Table 8]. Participants with WC values greater than the highest quartile were considered abnormal. Accordingly, 155 (24.0%) males had abnormal WC, while 106 (21.7%) females had abnormal WC.
Table 8.
Distribution of WC quartiles by sex in the study participants
Quartiles of WHR
The WHR was also divided into four groups based on quartiles of distribution [Table 9]. Participants with WHR greater than the highest quartile were considered abnormal. 159 (24.7%) males had abnormal WHR, while 135 (27.6%) female participants had abnormal WHR.
Table 9.
Quartiles of waist to hip ratio by sex among the study participants
BMI by sex
BMI also increased with age in both males and females with a peak in the middle age bracket followed by a decline among elderly a shown in Table 10. There were significant differences in the BMI values in the age range 35-44 and 45-54 years with the females having significantly higher BMI than their male counterparts. Overall, BMI, WC and WHR increased with age in both sexes, with peaks in the middle age group.
Table 10.
Distribution of body mass index by sex among the study participants
BMI categories by sex
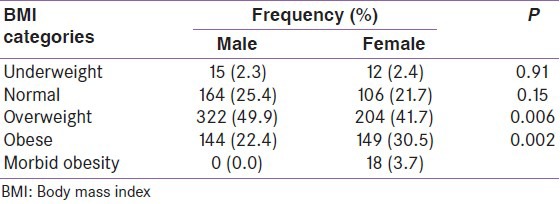
The distribution of participants according to BMI categories by sex is shown in Table 11. The mean (SD) BMI was 27.7 (5.0) kg/m2. Males had a mean (SD) BMI of 27.0 (4.4) kg/m2, while females had a mean (SD) BMI of 28.5 (5.5) kg/m2 respectively, the difference being statistically significant (P < 0.01). Of the male participants, 2.3% had BMI <18.5 kg/m2 (underweight), while 25.4% had BMI in the range 18.5 to 24.9 kg/m2 (normal weight). About 50% of the males were overweight (BMI ≥25 kg/m2) and 22.4% were obese (BMI ≥30 kg/m2). Correspondingly, females had lower percentages in the underweight, normal and overweight categories while there were more obese females (30.5%) than males (P < 0.001).
Table 11.
Body mass index categories by sex
Relationship between WC and BMI in males
Figure 1 shows that WC correlated positively and significantly with BMI (r = +0.70, P < 0.001) in males.
Figure 1.

Relationship between waist circumference and body mass index in male Calabar residents. Waist circumference correlated strongly with BMI (R2 = 0.493; r = + 0.70) and the WC can be predicted from BMI using the regression equation: WC = 68 + 0.85 BMI
Relationship between WC and WHR in males
Figure 2 shows that WC correlated positively and moderately with WHR (r = +0.49, P < 0.001) in males.
Figure 2.
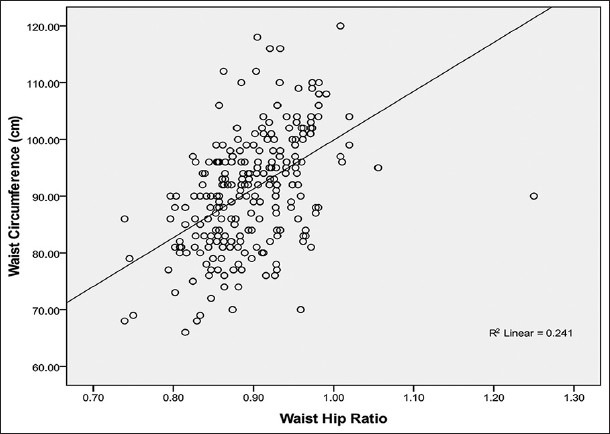
Relationship between waist circumference and waist hip ratio in male Calabar residents. Waist circumference correlated moderately with WHR (R2 = 0.241; r = + 0.49) and the WC can be predicted from WHR using the regression equation: WC= 72 + 0.73WHR
Relationship between WHR and BMI in males
WHR correlated positively and significantly with BMI (r = +0.65, P < 0.001) in males as shown in Figure 3.
Figure 3.
Relationship between waist hip ratio and body mass index in male Calabar residents. Waist Hip Ratio correlated strongly with BMI (R2 = 0.425; r = + 0.65) and the WHR can be predicted from BMI using the regression equation: WHR= 0.78 + 0.004 BMI
Relationship between WC and BMI in females
WC correlated positively and significantly with BMI (r =+0.70, P < 0.001) in females as shown in Figure 4.
Figure 4.
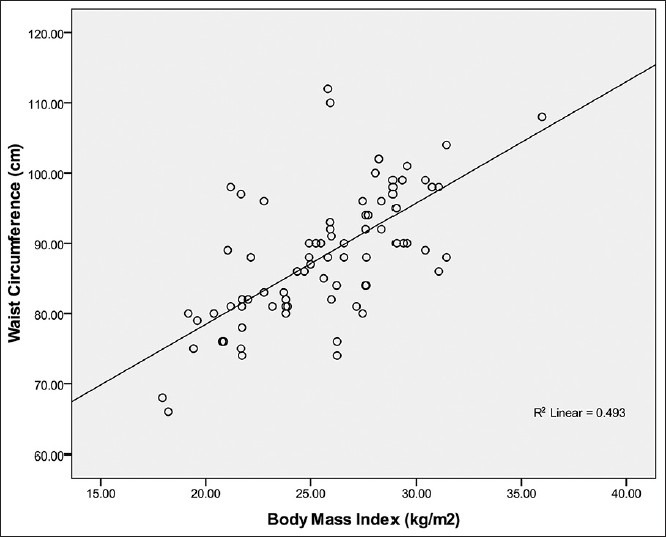
Relationship between waist circumference and body mass index in female Calabar residents. Waist circumference correlated strongly with BMI (R2 = 0.493; r = + 0.70) and the WC can be predicted from BMI using the regression equation: WC= 68 + 0.75 BMI
Relationship between WC and WHR in females
WC correlated positively and moderately with WHR (r = +0.49, P < 0.001) in females as shown in Figure 5.
Figure 5.
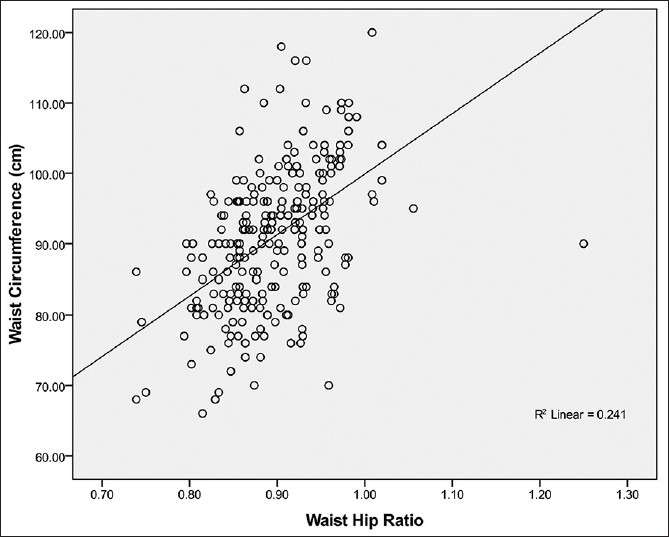
Relationship between waist circumference and waist hip ratio in female Calabar residents. Waist circumference correlated moderately with WHR (R2 = 0.241; r = + 0.49) and the WC can be predicted from WHR using the regression equation: WC= 72 + 0.62 WHR
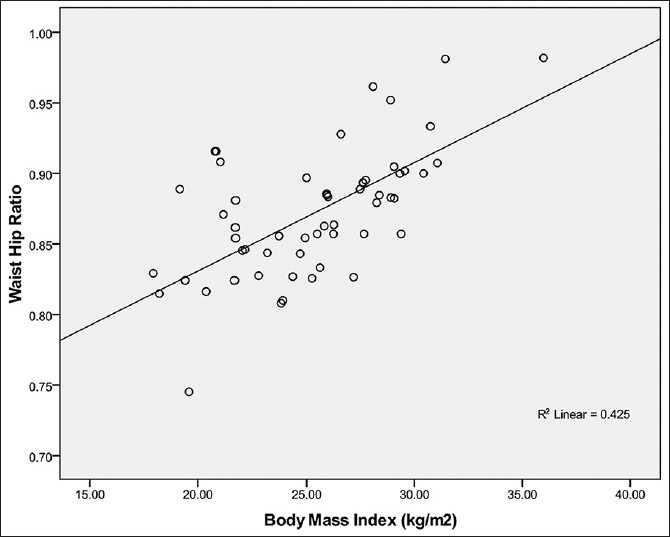
Relationship between WHR and BMI in females
The relationship between WHR and BMI is that WHR correlated positively and significantly with BMI (r = +0.65, P < 0.001) in females as shown in Figure 6.
Figure 6.

Relationship between waist hip ratio and body mass index in female Calabar residents. Waist Hip Ratio correlated strongly with BMI (R2 = 0.425; r = + 0.65) and the WHR can be predicted from BMI using the regression equation: WHR= 0.78 + 0.002 BMI
DISCUSSION
BMI
The mean BMI of males in this study was lower than that of females which is consistent with findings in other studies.[7,8,9] These markers provide common benchmarks for assessment, but the risks of disease in all populations can increase progressively from lower BMI levels.[10] The mean BMI of 28 kg/m2 found in this study is an indication that there might be need to review the WHO's one-size-fits-all scheme for BMI which may not be applicable to Africa as has been shown in Asia.[8] Although BMI is the most frequently used index, it does not reflect body fatness uniformly in all populations, and inter-ethnic extrapolations are not justified.[11] For a given age, sex, and body fat level, Caucasians have higher BMI than the Chinese, Ethiopians, and Polynesians.[12] Epidemiological studies have shown that the ideal BMI may differ for different populations.[13] A positive association between obesity and the risk of developing type 2 DM has been consistently observed in many populations.[14]
The results of prospective and cross-sectional studies that have attempted to find the best anthropometric index are not uniform.[14,15] Studies from the Eastern Mediterranean region also do not agree on the best anthropometric index to predict cardio-metabolic risk.[13,14]
The mean BMI for males was 27.0 kg/m2 (95% CI 26.5-27.2) and 28.5 kg/m2 (95% CI 28.0-29.0) for females. This was higher than those found in studies by Raimi[15] in South West Nigeria (23.5 kg/m2 vs 23.8 kg/m2), Okafor[16] in Eastern Nigeria, Gezawa[16] in North East Nigeria (24.3 kg/m2 vs 25.6 kg/m2), and Sabir[9] in North West Nigeria but similar to findings in Germany.[12] The mean BMI of urban dwellers in Sokoto was 24.0 kg/m2, 23.6 kg/m2 in Sagamu[15], 26.7 kg/m2 in Enugu[17] and 24.7 kg/m2 in Maiduguri.[16] The mean BMI in this study of 27.7 kg/m2 was lower compared with the current definitions of obesity recommended by WHO (BMI ≥30 kg/m2).[10]
For the equivalent incidence rate of diabetes at BMI 30 kg/m2 in white participants, the BMIcut-off values were 24 kg/m2 for South Asians, 25 kg/m2 for Chinese, and 26 kg/m2 for black participants[18] which is similar to that found in this study. Adult males have greater muscle mass, larger and stronger bones than women who have a more peripheral distribution of fat. Therefore the differences in BMI of males and females are attributable primarily to the action of sex steroidsand lower level of physical activity among females.
WC
The NHANES[19] study found that WC was larger in males compared to females as was found in this study. WC is influenced by body weight, body composition and fat distribution and there is no universal agreement to define a healthy WC, and none of the common guidelines is age-specific.[20]
The cut-off point for WC recommended by IDF remains controversial.[20] The African-specific WC cut-off points for central obesity which were adopted in IDF[21] definition were 94 cm for men and 80cm for women. However, this study found a lower cut-off of 92 cm for males and a higher cut-off of 91 cm for females. This finding is dissimilar to that in a study among Asian Indian adults[22] and in other parts of Nigeria[16,18,19] but similar to findings by Schneider in Germans[23] with cut-off point WC for men of ≥103 cm and ≥94 cm for women. The mean WC in this study was 90.5cm which was similar to the 90.8cm found in Enugu.[17] The other findings in Nigeria show differences when compared to this study as mean WC in Sokoto, Sagamu and Maiduguri were 84.3 cm, 81.3 cm and 96.5 cm respectively. These differences may be related to the influences of westernization on the participants who reside in a coastal shore line in addition to the high rate of physical inactivity among the participants who were largely civil servants.
WHR
Most cross sectional studies showed that WC or WHR discriminated better the cases with diabetes from those without, as compared to BMI.[24] The mean (95% CI) values of WHR for males was 0.90 (95% CI 0.88-0.89) and for females 0.85 (95% CI 0.87-0.89) from this study. This finding is similar to those from other studies[8,22,25] but different from a study by Kamadjeu[26] in an urban Cameroon population.
The mean WHR from other studies in Nigeria show WHR of 0.94 for males and 0.90 for females in Maiduguri,[16] 0.94 for males and 0.91 for females in Enugu,[17] 0.90 for males and 0.90 and 0.88 for males and females respectively in Sagamu.[15] In this study, the cut-off value of WHR for males and females was 0.90. The WHR cut-off from a study in North East Nigeria was ≥0.94 and 0.90 for males and females respectively and Oka for[17] reported ≥0.95 for males and ≥0.93 for females. Age might play a significant role in this issue as the mean age in other studies were higher. Also, the differences in sampling methods may be a factor.
Inter- relationships between indices of nutrition
All other anthropometric measurements except WHR correlated positively and significantly with each other. The correlation of general and central obesity is suggestive of an association between increased general adiposity (as measured by BMI) with increased visceral fat (WC). BMI and WC are highly correlated as was found in this study and gender and age associations with BMI, body composition and fat deposition were all pertinent to WC. High correlation between BMI and WC suggests that obesity based on these parameters will provide comparable information. However, WHR showed weaker correlation with other anthropometric measurements. It is likely that BMI and WHR provide different measures of the same phenomenon.
WC correlated strongly with BMI (r = +0.63, P < 0.01) similar to findings of Xhiaosa[27] thus suggesting that WC is not only an indicator of abdominal adiposity but also overall obesity. Xhiaosa's study showed a weaker correlation between that WHR and BMI (r = 0.30, P < 0.001) and the present study also found the same (r =+0.27, P < 0.01) perhaps indicating that WHR provides more unique information on fat distribution. WC reflects abdominal or intra-abdominal fat, whereas HC reflects glutero-femoral muscle, bone and fat mass. It is the biological significance of the latter that is hard to deduce and consequently the exact meaning of WHR is unclear.[20,24] The present study showed a positive relationship between WC and WHR (r = 0.50, P < 0.001) similar to findings in Australia.[25]
BMI is a measure of overall obesity but with known limitations, including the inability to reflect body fat distribution. This has prompted the use of WC or WHR, both alternative indices that are believed to be proxies for abdominal adiposity.[18] WC measures intra-abdominal adiposity and is the putative best predictor of cardiovascular risk; hence it has stronger correlations with other indices of nutrition while WHR has poor correlations with other anthropometric indices.
The epidemic of obesity extends to developing countries as it ranks fifth in the list of leading risk factors in these countries.[18,26,28,29] This may be related to rapid changes in environmental obesogenic factors and individuals’ lifestyles.[30,31] However, obesity is one of the most modifiable risk factors in the aetiology of type 2 DM.[32,33] The prevalence of obesity using BMI in this study was 27.4%, (males 22.3%; females 34.2%) which is higher than the figures reported by Bakari[34] in Northern Nigeria and Sabir[9] in North West Nigeria, but lower than the 30.4% found in a study by Baskin[35] in the United States of America, Rennie[36] in Great Britain and Yumuk[37] in Turkey. The higher BMI in females when compared to males in the present study corroborates findings in other studies.[9,34] The mean BMI of 27.6 in this study was higher than that found by Sabir in Sokoto[9] but similar to that reported in Pima Indians.[38]
The mean WC in this study was higher than that reported by Sabir[10] and males had a higher mean WC than females. The differences in the indices of nutrition in this study compared to those found in other studies especially in Northern Nigeria may be explained by differences in lifestyle, genetic and cultural practices. The Fulanis in Northern Nigeria are essentially herdsmen and thus are more active whereas the Efiks in South East Nigeria are mainly civil servants who lead sedentary lifestyles and still have a culture that equates corpulence to affluence. The prevalence of obesity in Nigeria[39] ranged from 4% in 1993 to 9% in 2000 but it was 27.4% in this study.
CONCLUSION
There are positive linear inter relationships between the indices of nutrition which is strongest between WC and BMI. In view of the strong independent association of DM with indices of nutrition, it is appropriate to derive normal cut-off values for WC, WHR and BMI nationally.
Study limitations
Surrogate markers were used to assess some indices of nutrition during anthropometric measurements. For example, the tape measure was used to measure WC when computerised tomography measurement of visceral adipose tissue (VAT) or bio impedance electrical analysis for fat distribution or obesity would have been more accurate.
ACKNOWLEDGMENT
We thank all our colleagues in the Department of Internal Medicine UCTH Calabar and LUTH, Lagos for their invaluable support and in particular Drs. Victor Umoh and Emmanuel Effa. Our gratitude goes especially to Mrs. Kate Enang who was a pillar of support and encouragement.
Footnotes
Source of Support: Nil
Conflict of Interest: None declared
REFERENCES
- 1.Hu FB, Manson JE, Stampfer MJ. Diet, lifestyle, and the risk of type 2 DM in women. N Engl J Med. 2001;345:790–7. doi: 10.1056/NEJMoa010492. [DOI] [PubMed] [Google Scholar]
- 2.Tuomilehto J, Lindstrom J, Eriksson G. Prevention of type 2 DM by changes in lifestyle among subjects with impaired glucose tolerance. N Engl J Med. 2001;344:1343–50. doi: 10.1056/NEJM200105033441801. [DOI] [PubMed] [Google Scholar]
- 3.Hartz AJ, Ruplay DC, Rimm AA. The Association of Girth measurement with disease in 36,556 women. Am J Epidemiol. 1984;119:71–4. doi: 10.1093/oxfordjournals.aje.a113727. [DOI] [PubMed] [Google Scholar]
- 4.Echouffo-Tcheugui JB, Ali MK, Griffin SJ, Narayan KM. Screening for Type 2 Diabetes and Dysglycemia. Epidemiol Rev. 2011;33:63–87. doi: 10.1093/epirev/mxq020. [DOI] [PubMed] [Google Scholar]
- 5.Akinkugbe OO, Akinyanju OO. Ibadan, Nigeria: Intec Printers; 1997. Non communicable diseases in Nigeria-Final Report of National Survey; pp. 64–99. [Google Scholar]
- 6.Ekoe JM, Zimmet P, Williams R. Vol. 2. New York, NY: John Wiley and Sons, Inc; 2001. The epidemiology of DM: An international perspective; pp. 53–60. [Google Scholar]
- 7.Amoah AG, Owusu SK, Adjei S. Diabetes in Ghana: A community based prevalence study in Greater Accra. Diabetes Res Clin Pract. 2002;56:197–205. doi: 10.1016/s0168-8227(01)00374-6. [DOI] [PubMed] [Google Scholar]
- 8.Nyenwe EA, Odia OJ, Ihekwaba AE, Ojule A, Babatunde S. Type 2 diabetes in Adult Nigerians: A study of its prevalence and risk factors in Port Harcourt, Nigeria. Diabetes Res Clin Pract. 2003;62:177–85. doi: 10.1016/j.diabres.2003.07.002. [DOI] [PubMed] [Google Scholar]
- 9.Sabir AA. Lagos: Dissertation submitted to the National Post Graduate Medical College of Nigeria; 2008. Glucose tolerance among urban and rural Fulani. [Google Scholar]
- 10.Geneva: World Health Organisation; 1999. World Health Organisation: Definition, Diagnosis and Classification of DM and its Complications: Report of WHO consultation. Part 1: Diagnosis and Classification of DM. WHO/NCD/NCS/99.2. [Google Scholar]
- 11.Hadaegh F, Zabetian A, Harati H, Azizi F. Waist/height ratio as a better predictor of type 2 diabetes compared to body mass index in Tehranian adult men- a 3.6-year prospective study. Exp Clin Endocrinol Diabetes. 2006;114:310–5. doi: 10.1055/s-2006-924123. [DOI] [PubMed] [Google Scholar]
- 12.Schulze MB, Heidemann C, Schienkiewitz A, Bergmann MM, Hoffmann K, Boeing H. Comparison of anthropometric characteristics in predicting the incidence of type 2 diabetes in EPIC- Potsdam study. Diabetes Care. 2006;29:1921–3. doi: 10.2337/dc06-0895. [DOI] [PubMed] [Google Scholar]
- 13.Mansour AA, Al-Jazairi MI. Predictors of incident DM in Basrah, Iraq. Ann Nutr Metab. 2007;51:277–80. doi: 10.1159/000105449. [DOI] [PubMed] [Google Scholar]
- 14.Mansour AA, Al-Jazairi MI. Cut-off values for anthropometric variables that confer increased risk of type 2 DM and hypertension in Iraq. Arch Med Res. 2007;38:253–8. doi: 10.1016/j.arcmed.2006.09.014. [DOI] [PubMed] [Google Scholar]
- 15.Raimi TH. Lagos: Dissertation submitted to the National Postgraduate Medical College of Nigeria; 2008. The role of anthropometric indices in the evaluation of the metabolic syndrome. [Google Scholar]
- 16.Gezawa ID. Lagos: Dissertation submitted to the National Postgraduate Medical College of Nigeria; 2009. Normative anthropometric values and glucose intolerance among adults in Maiduguri, North East Nigeria. [Google Scholar]
- 17.Okafor CI. Lagos: Dissertation submitted to the National Postgraduate Medical College of Nigeria; 2009. The relationship between anthropometric indices and Insulin resistance among apparently healthy South Eastern Igbos of Nigeria. [Google Scholar]
- 18.Nathan DM, Davidson MB, DeFronzo RA, Heine RJ, Henry RR, Prately R, et al. Impaired fasting glucose and Impaired glucose tolerance; Implications for care. Diabetes Care. 2007;30:753–9. doi: 10.2337/dc07-9920. [DOI] [PubMed] [Google Scholar]
- 19.Cowie CC, Rust KF, Byrd-Holt DD, Eberhardt MS, Flegal KM, Engelgau MM, et al. Prevalence of diabetes and impaired fasting glucose in adults in the US population: National Health and Nutrition Examination Survey 1999-2002. Diabetes Care. 2006;29:1263–8. doi: 10.2337/dc06-0062. [DOI] [PubMed] [Google Scholar]
- 20.Stevens J, Katz EG, Huxley RQ. Association between gender and waist circumference. Eur J Clin Nutr. 2010;64:6–15. doi: 10.1038/ejcn.2009.101. [DOI] [PMC free article] [PubMed] [Google Scholar]
- 21.International Diabetes Federation: Diabetes Atlas. Brussels, International Diabetes Federation. 2009 [Google Scholar]
- 22.Sesikawa A, Eguchi H, Tominaya M. Prevalence of type 2 DM in a rural area of Japan. The Funagata diabetes study. J Diabetes Complication. 2000;14:78–83. doi: 10.1016/s1056-8727(00)00074-x. [DOI] [PubMed] [Google Scholar]
- 23.Schnieder HJ, Glasnaer H, Klotsche J, Bohler S, Lehert H, Zeiher AM, et al. Accuracy of anthropometric indicators of obesity to predict cardiometabolic risk. J Clin Endocrinol Metab. 2007;92:589–94. doi: 10.1210/jc.2006-0254. [DOI] [PubMed] [Google Scholar]
- 24.Chiu M, Austin PC, Manuel DG, Shah BR, Tu JV. Deriving ethnic-specific BMI cut-off points for assessing Diabetes Risk. Diabetes Care. 2011;34:1741–8. doi: 10.2337/dc10-2300. [DOI] [PMC free article] [PubMed] [Google Scholar]
- 25.Li M, McDermott RA. Using anthropometric indices to predict cardio-metabolic risk factors in Australian indigenous populations. Diabetes Res Clin Pract. 2010;87:401–6. doi: 10.1016/j.diabres.2009.12.004. [DOI] [PubMed] [Google Scholar]
- 26.Kamadjeu RM, Edwards R, Atanga JS, Kiavi EC, Unwin N, Mbanya JC. Anthropometry measures and prevalence of obesity in Urban adult population of Cameroon: An update from Cameroon Burden of Diabetes Baseline Survey. BMC Public Health. 2006;6:228–34. doi: 10.1186/1471-2458-6-228. [DOI] [PMC free article] [PubMed] [Google Scholar]
- 27.Zhaoxia J, Yong Z, Xiurong L, Yilong W, Xingquan Z, Yongjun W, et al. Comparison of different anthropometric measures as predictors of diabetes incidence in a Chinese population. Diabetes Res Clin Pract. 2011;92:265–71. doi: 10.1016/j.diabres.2011.01.021. [DOI] [PubMed] [Google Scholar]
- 28.Stevens J, McClain JE, Truesdale KP. Selection of measures in epidemiologic studies of the consequences of obesity. Int J Obes (Lond) 2008;32:S60–6. doi: 10.1038/ijo.2008.88. [DOI] [PubMed] [Google Scholar]
- 29.Roglic G, Unwin N, Bennett PH, Mathers C, Tuomilehto J, Nag S, et al. The burden of mortality attributable to diabetes: Realistic estimates for the year 2000. Diabetes Care. 2005;28:2130–5. doi: 10.2337/diacare.28.9.2130. [DOI] [PubMed] [Google Scholar]
- 30.Okesina AB, Oparinde DP, Akindoyin KA, Erasmus RT. Prevalence of some risk factors of coronary heart disease in a rural Nigerian population. East Afr Med J. 1999;76:212–6. [PubMed] [Google Scholar]
- 31.Soderberg S, Zimmet P, Tuomilehto J, de Courten M, Dowse GK, Chitson P, et al. Increasing prevalence of Type 2 DM in all ethnic groups in Mauritius. Diabet Med. 2005;22:61–8. doi: 10.1111/j.1464-5491.2005.01366.x. [DOI] [PubMed] [Google Scholar]
- 32.Hu FB, Manson JE, Stampfer MJ. Diet, lifestyle, and the risk of type 2 DM in women. N Engl J Med. 2001;345:790–7. doi: 10.1056/NEJMoa010492. [DOI] [PubMed] [Google Scholar]
- 33.Tuomilehto J, Lindstrom J, Eriksson G. Prevention of type 2 DM by changes in lifestyle among subjects with impaired glucose tolerance. N Engl J Med. 2001;344:1343–50. doi: 10.1056/NEJM200105033441801. [DOI] [PubMed] [Google Scholar]
- 34.Bakari AG, Onyemelukwe GC, Sani BG. Prevalence of diabetes in suburban northern Nigeria: Results of a Public Screening Survey. Diabetes Int. 1999;9:59–60. [Google Scholar]
- 35.Baskin ML, Ard J, Allison DB. Prevalence of obesity in the United States. Obes Rev. 2005;6:5–7. doi: 10.1111/j.1467-789X.2005.00165.x. [DOI] [PubMed] [Google Scholar]
- 36.Rennie KL, Jebb SA. Prevalence of obesity in Great Britain. Obes Rev. 2005;6:11–2. doi: 10.1111/j.1467-789X.2005.00164.x. [DOI] [PubMed] [Google Scholar]
- 37.Yumuk VD. Prevalence of obesity in Turkey. Obes Rev. 2005;6:9–10. doi: 10.1111/j.1467-789X.2005.00172.x. [DOI] [PubMed] [Google Scholar]
- 38.Ravussin E, Valencia ME, Esparza J, Bennett PH, Schulz LO. Effects of a traditional lifestyle on obesity in Pima Indians. Diabetes Care. 1994;17:1067–74. doi: 10.2337/diacare.17.9.1067. [DOI] [PubMed] [Google Scholar]
- 39.Abubakari AR, Bhopal RS. Systematic review on the prevalence of diabetes, overweight and Physical inactivity in Ghanaians and Nigerians. Public Health. 2008;122:173–82. doi: 10.1016/j.puhe.2007.06.012. [DOI] [PubMed] [Google Scholar]