

Abstract
Objectives. Unhealthy eating is a complex-system problem. We used agent-based modeling to examine the effects of different policies on unhealthy eating behaviors.
Methods. We developed an agent-based simulation model to represent a synthetic population of adults in Pasadena, CA, and how they make dietary decisions. Data from the 2007 Food Attitudes and Behaviors Survey and other empirical studies were used to calibrate the parameters of the model. Simulations were performed to contrast the potential effects of various policies on the evolution of dietary decisions.
Results. Our model showed that a 20% increase in taxes on fast foods would lower the probability of fast-food consumption by 3 percentage points, whereas improving the visibility of positive social norms by 10%, either through community-based or mass-media campaigns, could improve the consumption of fruits and vegetables by 7 percentage points and lower fast-food consumption by 6 percentage points. Zoning policies had no significant impact.
Conclusions. Interventions emphasizing healthy eating norms may be more effective than directly targeting food prices or regulating local food outlets. Agent-based modeling may be a useful tool for testing the population-level effects of various policies within complex systems.
The literature on policy interventions to address obesogenic dietary behaviors can be divided into 3 distinct categories. The first is the use of economic measures to alter food consumption, such as taxing unhealthy ingredients and subsidizing healthy foods,1–4 in light of studies that have shown the price of a calorie obtained from unhealthful foods is lower than the price of a calorie from more healthful foods.5,6 The second is targeting the food environment through zoning polices, including increasing the number of healthy food vendors in “food desert” communities7 and restricting the opening of new fast-food restaurants.8
The third and final category is related to combating unhealthy eating norms, given research showing the power of food marketing to change dietary behaviors and proposing restrictions on the time, place, and manner in which obesogenic foods are marketed.9,10 Conversely, pro-nutritional marketing focuses on education as a means of increasing consumers’ awareness of dietary health (e.g., nutrition disclosure on menus and the issuing of dietary guidelines).11,12
The research to date focusing on the effects of these various approaches has incorporated theoretical and empirical techniques that rely on the stable unit treatment value assumption, according to which there are no interactions among people who experience an intervention that would alter the effectiveness of the intervention. However, this assumption is known to be violated in the case of obesity-related behaviors.13,14 What is therefore not clear from existing regression-based and experimental empirical work is the potential magnitude of the population-level impact of these policies if they were implemented in the real world. We performed simulations to contrast the potential of different approaches aiming at tackling unhealthy dietary behaviors in a population of urban US adults.
Simulations involving systems dynamics or agent-based modeling (ABM) are increasingly being used in public health,15,16 particularly in addressing food system issues.17,18 Such techniques can provide virtual laboratories for testing policies19 and can be useful in studying complex systems, such as dietary behaviors, wherein decisions are influenced by the interplay of socioeconomic, psychological, and physiological forces.20–22 We used ABM, a powerful technique when there is heterogeneity among members of the population and when behavior changes as a result of interactions between different individuals or between individuals and their environment (i.e., adaptation).23,24
We developed a computer model explicitly representing how individuals make decisions to examine the impact of policies on their food consumption. Our model was based on a multilevel theory of population health that emphasizes the role of cognitive habits in human behaviors.25 According to this theory, individual beliefs are influenced by incentives—as in rational-choice theory—but also shaped by cognitive habits that are reinforced within a population by social norms and culture. Thus, our model examined how individual beliefs are influenced by interventions either in the social network or in the food environment.
METHODS
Our agent-based model contained 2 kinds of agents: individuals and food outlets. Individuals make dietary choices, and food outlets adapt to those choices. In our model, a single time period was defined as 1 day, and each simulation was run for more than 3 years (1100 days).
In our simulations, individuals were assigned demographic characteristics (age, gender, educational attainment) matching the demographic distribution of downtown Pasadena, CA. The model accounted for spatial as well as social aspects; individuals were assigned a home location and a set of friends that were both constant throughout the 3-year period.
Outlets were categorized as selling either fresh fruits and vegetables (FV) or fast food (FF). These 2 options represent healthy and unhealthy dietary choices for the purposes of modeling. Each food outlet had a constant location and sold only one type of food in each period. However, food outlets could change the type of food they sold from one quarter (i.e., 90 days) to the next.
Process Overview
Formation of social networks.
Individuals belong to groups of friends, and some also have friendship ties to members of other groups. The presence of densely connected groups and the fact that any individual is only a few social ties away from any other is known as the small-world effect, which is commonly accounted for in the modeling of social networks.24 Although our baseline scenario relied on small-world networks, we also ran our model under an alternative case with weaker groups, in which social groups were modeled as a random network. (Appendix A, available as a supplement to the online version of this article at http://www.ajph.org, summarizes the models used to generate both network types, together with their calibration.)
Individual decision-making.
Individuals chose to consume FV or FF each period on the basis of taste preferences, health beliefs, a food-price index, price sensitivity, food accessibility, and demographic factors (age, gender, and education). The weight assigned to each factor was based on data derived from the Food Attitudes and Behaviors (FAB) Survey26 and other empirical studies. The sample for the 2007 version of the FAB Survey (from which our data were taken) comprised 3397 adults; estimates from the 2000 US census were used to provide sampling weights so that the sample was representative of the US population. The survey aimed to evaluate various factors, such as attitudes and beliefs, related to eating behaviors among adults.
During each simulation period, individuals’ taste preferences (the stronger their preferences, the more they like the taste of sugary or salty foods) and health beliefs (the stronger their health beliefs, the more they care about the healthiness of food) were updated according to their habits during the preceding period, the influence of their friends, and the food marketing strategies used in the broader environment (the updating function is presented in Appendix B, available as a supplement to the online version of this article at http://www.ajph.org). The models focusing on individuals also evaluated the amount of accessible food within walking distance, defined as 0.25 miles to 1 mile,27 and food prices.
The models then computed 2 probabilities measured in the FAB data set: the weekly probability of consuming more than 1 meal from an FF restaurant and the daily probability of consuming more than 2 servings of FV. Finally, according to model specifications, individuals consumed FV or FF in proportion to their calculated probabilities. (Equations and parameters are provided in Appendix B.)
Food-outlet adaptation.
In our simulations, food outlets evaluated the food consumption of consumers in the neighborhood and decided whether to sell FV or FF. This evaluation took place quarterly (i.e., once every 90 time points). The model tracked consumption of the type of food sold by each outlet. The probability of switching types of food was proportional to the decline between the current quarter’s consumption and that of the preceding quarter (e.g., if average FF consumption decreased by 75%, an FF outlet had a 75% likelihood of switching to sales of FV). In the simulations, outlets did not switch types of food if their sales remained constant or increased.
Model Calibration and Validation
The setting of the simulations was downtown Pasadena, California, an urban district of 1.3 square miles.28 Pasadena was chosen because its moderate population density, racial diversity, and income levels make it fairly typical of Los Angeles County and similar to the nation as a whole (albeit more diverse). The district was represented by a grid of 260 × 260 cells. In 2010, the district included 113 food outlets that could be categorized as FF venues and 16 outlets that could be categorized as FV venues (e.g., farmers’ markets and supermarkets).29 Each outlet was randomly assigned to one cell, and a sensitivity analysis was performed to assess whether uneven distribution of food outlets would affect model predictions (Appendix C, available as a supplement to the online version of this article at http://www.ajph.org).
Data from the 2010 census showed that the district comprised 17 698 residents aged 18 years or older,28 and those residents were assigned to unique locations chosen at random. Also, each resident was assigned an age, a gender, and a level of educational attainment. On the basis of these characteristics, residents were then assigned taste preferences, health beliefs, and price sensitivities (Table 1).
TABLE 1—
Summary of Model Inputs and Calibrated Statistics at Baseline
| Parameter | Definition and Values |
| Individual attributes | |
| Agei | Age group, y |
| 18–34: 57.00% | |
| 35–54: 31.27% | |
| ≥ 55: 11.73% | |
| Genderi | Gender |
| Male: 48.07% | |
| Female: 51.93% | |
| Educationi | Educational attainment |
| < high school: 10.85% | |
| High school: 16.27% | |
| Some college: 11.64% | |
| College: 61.24% | |
| Ti,ta | Taste preference: person prefers sweet and salty foods; age is negatively associated with taste preference |
| Taste ∈ (0.25–1) if age = 18–54 y | |
| Taste ∈ (0–0.75) if age ≥ 55 y | |
| Hi,ta | Health beliefs: person has a strong value for eating healthfully; age, female gender, and educational attainment are positively associated with health beliefs |
| Health ∈ (0–0.75) if age = 18–54 y and gender = male | |
| Health ∈ (0–0.75) if age ≥ 55 y and gender = male and education < high school | |
| Health ∈ (0–0.75) if age = 18–54 y and gender = female and education < high school | |
| Health ∈ (0.25–1) if all other groups | |
| PSia | Price sensitivity: person has a strong preference for cheaper food; age and educational level are negatively associated, and female gender is positively associated, with price sensitivity |
| PS ∈ (0–0.25) if age ≥ 55 and gender = male and education = college | |
| PS ∈ (0–1) if age = 18–54 y and gender = female and education < high school | |
| PS ∈ (0–0.5) if all other groups | |
| AFV i,t and AFF i,t | Accessibility of fruit and vegetable outlets and accessibility of fast-food restaurants: person is disinclined to purchase food sold outside of walking distance (0.25–1 mile) |
| Accessibility = 1 if within walking distance | |
| Accessibility = 0 if outside of walking distance | |
| α | The extent to which an individual is influenced by friends’ social norms |
| α ∈ (0, 0.3), uniform distribution | |
| Environmental attributes | |
| PIfvb | FV price index: weighted FV price index in 2007; set to 0.72 at baseline |
| PIffc | FF price index: weighted FF price index in 2007; set to 2.71 at baseline |
| γ | Visibility weights on social norm of friends: γ ∈ (−1, 1), uniform distribution; set to 0 at baseline |
| FF/FVd | Ratio of stores selling fast food versus fruits and vegetables; set to 7 at baseline |
| Empirical statistics | |
| Pr(FV)e | Probability of eating at least 2 servings of FV per day among the residents of downtown Pasadena; Pr(FV) = 0.81 |
| Pr(FF)e | Probability of eating at least 1 meal from a fast-food restaurant per wk among the residents of downtown Pasadena; Pr(FF) = 0.47 |
Note. FF = fast food; FV = fruits and vegetables. The age, gender, and education distributions are assumed to be the same as in downtown Pasadena in 2010 (based on the 2010 US census).
Predicted with data from the Food Attitudes and Behaviors Survey.
Derived from Powell et al.,30 who estimated the price index with data from the American Chamber of Commerce Researchers Association (ACCRA). The FV price index was based on price data collected in the following food categories: potatoes, bananas, lettuce, sweet peas, tomatoes, peaches, and frozen corn. Each price index was weighted on the basis of expenditure shares provided by ACCRA, derived from the Bureau of Labor Statistics Consumer Expenditure Survey.
Derived from Powell et al.30 The fast-food price index is based on the following 3 items included in the ACCRA data: a McDonald’s Quarter Pounder with Cheese, a thin-crust regular cheese pizza at Pizza Hut or Pizza Inn, and fried chicken (thigh and drumstick) at Kentucky Fried Chicken or Church’s Fried Chicken.
Calculated with data from the California Department of Public Health.29
Estimated with data from the 2007 Los Angeles County Health Survey; statistics for subpopulations of downtown Pasadena were adjusted via population weights.
To validate our equations, we compared baseline model outcomes (i.e., without interventions) with FF and FV consumption data among the adult population in downtown Pasadena estimated from the 2007 Los Angeles County Health Survey31 (Table 1).
Policy Experiments
On the basis of the calibrated model and assuming constant demographic characteristics, we conducted policy experiments by manipulating the model’s 4 environmental attributes. The following policies were tested.
• Tax on unhealthy food: The FF price index in the model was increased 1% up to 20% to reflect the effects of taxes on fat or sugar.
• Subsidies for healthy food: The FV price index was lowered by 1% up to 20% to reflect the effects of increased agricultural subsidies.
• Promotion of healthy norms: Food advertising is associated with a perception that others (peers, friends, and family) like the advertised foods.32 Therefore, we examined the impact of advertising healthy foods by increasing the visibility (parameter γ in Table 1) assigned to healthy peers from 1% to 10%.
• Regulation of local food environment: We modeled zoning regulations that would alter the makeup of the district with respect to the ratio of stores selling fast food versus fruits and vegetables (FF/FV in Table 1). We lowered the ratio from its baseline value of 7 down to 4 and accounted for the mediating role of accessibility.
These policy experiments and their magnitudes were chosen as realistic policy options. Each run of the simulation took place over 1100 days and included a sample of 5000 participants. For each set of variables, we conducted the simulation 5 times to account for random variation.
RESULTS
Results showed that price-based strategies (i.e., taxing unhealthy food, subsidizing healthy food) could lower FF consumption and increase FV consumption (Table 2). However, improvements were small given the tax increases considered (Figure 1a). Promotion of healthy norms exhibited more of an effect: a 10% improvement in the visibility of positive social norms yielded an increase of 7 percentage points in FV consumption and a decrease of 6 percentage points in FF consumption, whereas the impact of a 20% increase in taxes on FF was only 3 percentage points.
TABLE 2—
Comparison of the Results of Different Policy Interventions on Food Consumption Decisions
| Increasing Taxes on FFa |
Increasing Subsidies for FVb |
Zoning Policiesc |
Promoting Healthy Normsd |
||||||
| Baseline | 10% | 20% | 10% | 20% | 6 | 4 | 1% | 10% | |
| Probability of consuming ≥ 2 servings of fruits and vegetables/d: Pr(FV) × 100 | 75.8 (1.8) | 76.0 (1.0) | 76.0 (1.8) | 76.4 (1.6) | 77.7 (1.6) | 75.5 (1.4) | 76.5 (2.3) | 76.7 (1.0) | 83.1* (1.6) |
| Probability of consuming ≥ 1 fast-food meals/wk: Pr(FF) × 100 | 52.8 (0.8) | 51.2* (0.7) | 49.9* (1.1) | 52.4 (0.9) | 52.8 (1.4) | 52.3 (0.7) | 52.0 (1.7) | 52.2 (1.1) | 47.3* (1.5) |
Note. FF = fast food; FV = fruits and vegetables. Average probabilities and standard deviations are provided.
Increasing the FF price index in the model by 10% and 20%.
Decreasing the FV price index in the model by 10% and 20%.
Adding FV outlets in the region so that the ratio of FF to FV outlets falls from 7 to 6 (first column) or from 7 to 4 (second column).
Increasing the visibility (parameter γ) given to healthy peers from 1% to 10%.
*P < .05 (significant difference from baseline).
FIGURE 1—
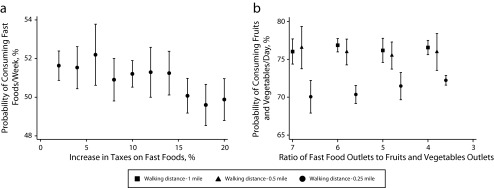
Impact of (a) taxes on the consumption of fast foods and (b) zoning policies on the consumption of fruit and vegetables.
Note. Impact of zoning policies was defined as altering the ratio of stores selling fast food vs fruit and vegetables in the district. We evaluated zoning policies by assuming 3 different food accessibility buffers: 1 mile (squares), 0.5 miles (triangles), and 0.25 miles (circles).
The results also showed that zoning policies aiming at improving the density of stores selling FV would have no significant impact if individuals’ walking distance was set to either 1 mile or 0.5 miles (Table 2 and Figure 1). Even if individuals were to walk only 0.25 miles (Figure 1), the likelihood of finding healthy stores would be improved by only 2 percentage points through extensive rezoning (and locating such stores in that small area would be more difficult). However, one interesting result illustrated in Figure 1b is that expanding the buffer from 0.25 miles to 1 mile greatly increases FV consumption, which may indicate that improving transportation is a more effective strategy than rezoning.
Furthermore, promotion of healthy norms continued to have strong effects in both small-world networks and random networks (Figure 2). The impact on FV consumption remained largely unchanged for each decrease of 10% in the importance of peers’ influence (Figure 2b), and a similar effect was witnessed with respect to the impact on FF consumption (Figure 2a).
FIGURE 2—
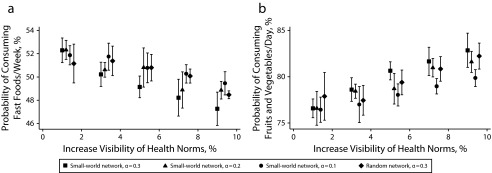
Impact of promoting healthy norms on (a) consumption of fast foods and (b) consumption of fruit and vegetables.
Note. We evaluated 4 scenarios for each outcome. The first 3 scenarios involved a small-world network and varied the strength of the peer influence value (α; see Table 1) from 0.3 (squares) to 0.2 (triangles) and 0.1 (circles). The fourth scenario involved a random network with a peer influence value of up to 0.3.
DISCUSSION
A typical unhealthy diet in the United States is composed of too much high-calorie food and an insufficient amount of fruits and vegetables. Our agent-based simulation model suggests that social networks have significant potential to influence dietary decisions. Although this general point about social networks has been made before,13 the value of our simulation is to put this insight into a comparative perspective: not only do social networks affect dietary behavior, but they may be the most significant modifiable contributor to such behavior, far stronger than other proposed interventions (e.g., strategies designed to affect the relative prices and availabilities of healthy and unhealthy foods).
Targeting food prices by introducing a tax on fat or sugar or by subsidizing healthy foods may not change dietary behaviors to a great extent. Attracting more FV stores may not exert a powerful influence on behaviors in moderately dense urban areas such as downtown Pasadena, given that people have easy access to both healthy and unhealthy foods nearby. However, improving transportation networks may be an alternative to enhance the accessibility of healthy food in instances in which routes are less walkable.
The policies tested in this study are comparable, and all have been proposed as politically feasible interventions to curb the obesity epidemic.2,33 Moreover, the magnitudes of the effects derived from our model simulations are similar to what might be expected from other results in the literature. For instance, a few states have imposed small taxes on carbonated beverages, and their experience has suggested that there is no evidence that a tax on these products would have a positive impact on obesity rates.33 However, one study predicted a slightly larger impact of taxes on food consumption than predicted here.2 There has been increasing adoption of social marketing in public health, and these efforts have achieved important successes.34
The use of ABM to understand this public health problem has certain important strengths. First, it provides a measure of the population-level impact of various policies. Although previous research has carefully tested the significance of effects of various determinants of dietary behavior, the next step is to combine these insights into a single, population-based model. ABM may be a fruitful way forward in assessing the overall determinants of population-health outcomes.
Second, unlike statistical models, ABM allows individuals to be connected and influenced by each other, which has considerable effects, as shown in this and other studies.13,24 The assumption of a stable unit-value treatment effect, on which nearly all statistical analyses depend, makes the statistical testing of social norms difficult35; however, this difficulty should not be taken to imply that social norms are not important in determining behavior.
Moreover, ABM allows interactions between individuals and the external food environment, which itself can adapt to individuals’ consumption. By relaxing this assumption, it is possible to observe the dynamic evolution of obesogenic eating behaviors beyond simply explaining correlations between variables, as statistical models typically do. Unlike most other agent-based models that have studied food systems,24,36 our model is based on existing theories and an empirical database. A baseline validation was conducted to increase the model’s reliability.
Notwithstanding these advantages, our model also has important limitations. First, data are lacking regarding the extent to which people are influenced by their friends. We used a conservative value13 for this variable. Even a small change in the value led to substantial changes in outcomes, suggesting the necessity of carefully parameterizing this factor in food-choice models. Second, there is little empirical information regarding how much adults’ perceptions of social norms can be biased by food advertising, particularly healthy food advertising. The mechanisms relating to how advertising information is disseminated and how it modifies perceptions remain unclear. Third, throughout the simulation, we assumed that population characteristics (age, gender, and education) remained constant at 2010 values and that agents did not change locations. These assumptions may not hold in the presence of in-migration or out-migration, some of which might be endogenous as the food environment evolves.
In summary, our model simulation suggests that norm-based interventions may be more effective in changing unhealthy eating behaviors than tax-based policies or zoning policies. It is beneficial to reinforce and reproduce healthy norms even if individuals do not form communities, suggesting that this strategy does not need to be community based but can also be implemented, for example, via mass media. ABM is useful in developing and testing potential interventions targeting complex health problems.
Acknowledgments
We thank the staff at the Health Behaviors Research Branch, National Cancer Institute, who shared the Food Attitudes and Behaviors Survey data set. Also, we are grateful to participants in the National Institutes of Health Institute on Systems Science and Health workshop and the Johns Hopkins systems workshop hosted by the Global Center on Childhood Obesity for facilitating multidisciplinary teamwork. Finally, we acknowledge the faculty at the Department of Health Policy and Management and the Center for Health Advancement at the University of California, Los Angeles, for their insights and comments on this study.
Human Participant Protection
No protocol approval was necessary because no human participants were involved.
References
- 1.Mytton OT, Clarke D, Rayner M. Taxing unhealthy food and drinks to improve health. BMJ. 2012;344:e2931. doi: 10.1136/bmj.e2931. [DOI] [PubMed] [Google Scholar]
- 2.Powell LM, Chaloupka FJ. Food prices and obesity: evidence and policy implications for taxes and subsidies. Milbank Q. 2009;87(1):229–257. doi: 10.1111/j.1468-0009.2009.00554.x. [DOI] [PMC free article] [PubMed] [Google Scholar]
- 3.Brownell KD, Farley T, Willett WC et al. The public health and economic benefits of taxing sugar-sweetened beverages. N Engl J Med. 2009;361(16):1599–1605. doi: 10.1056/NEJMhpr0905723. [DOI] [PMC free article] [PubMed] [Google Scholar]
- 4.An R. Effectiveness of subsidies in promoting healthy food purchases and consumption: a review of field experiments. Public Health Nutr. 2013;16(7):1215–1228. doi: 10.1017/S1368980012004715. [DOI] [PMC free article] [PubMed] [Google Scholar]
- 5.Drewnowski A, Darmon N. Food choices and diet costs: an economic analysis. J Nutr. 2005;135(4):900–904. doi: 10.1093/jn/135.4.900. [DOI] [PubMed] [Google Scholar]
- 6.Drewnowski A, Darmon N. The economics of obesity: dietary energy density and energy cost. Am J Clin Nutr. 2005;82(suppl 1):265S–273S. doi: 10.1093/ajcn/82.1.265S. [DOI] [PubMed] [Google Scholar]
- 7.Song HJ, Gittelsohn J, Kim M, Suratkar S, Sharma S, Anliker J. A corner store intervention in a low-income urban community is associated with increased availability and sales of some healthy foods. Public Health Nutr. 2009;12(11):2060–2067. doi: 10.1017/S1368980009005242. [DOI] [PMC free article] [PubMed] [Google Scholar]
- 8.Sturm R, Cohen DA. Zoning for health? The year-old ban on new fast-food restaurants in south LA. Health Aff (Millwood) 2009;28(6):w1088–w1097. doi: 10.1377/hlthaff.28.6.w1088. [DOI] [PMC free article] [PubMed] [Google Scholar]
- 9.Zimmerman FJ. Using marketing muscle to sell fat: the rise of obesity in the modern economy. Annu Rev Public Health. 2011;32:285–306. doi: 10.1146/annurev-publhealth-090810-182502. [DOI] [PubMed] [Google Scholar]
- 10.Harris JL, Bargh JA, Brownell KD. Priming effects of television food advertising on eating behavior. J Health Psychol. 2009;28(4):404–413. doi: 10.1037/a0014399. [DOI] [PMC free article] [PubMed] [Google Scholar]
- 11.Nelson MC, Lytle LA, Pasch KE. Improving literacy about energy-related issues: the need for a better understanding of the concepts behind energy intake and expenditure among adolescents and their parents. J Am Diet Assoc. 2009;109(2):281–287. doi: 10.1016/j.jada.2008.10.050. [DOI] [PMC free article] [PubMed] [Google Scholar]
- 12.Willett WC, Ludwig DS. The 2010 dietary guidelines—the best recipe for health? N Engl J Med. 2011;365(17):1563–1565. doi: 10.1056/NEJMp1107075. [DOI] [PubMed] [Google Scholar]
- 13.Christakis NA, Fowler JH. The spread of obesity in a large social network over 32 years. N Engl J Med. 2007;357(4):370–379. doi: 10.1056/NEJMsa066082. [DOI] [PubMed] [Google Scholar]
- 14.VanderWeele TJ. Sensitivity analysis for contagion effects in social networks. Sociol Methods Res. 2011;40(2):240–255. doi: 10.1177/0049124111404821. [DOI] [PMC free article] [PubMed] [Google Scholar]
- 15.Leischow SJ, Milstein B. Systems thinking and modeling for public health practice. Am J Public Health. 2006;96(3):403–405. doi: 10.2105/AJPH.2005.082842. [DOI] [PMC free article] [PubMed] [Google Scholar]
- 16.Maglio PP, Mabry PL. Agent-based models and systems science approaches to public health. Am J Prev Med. 2011;40(3):392–394. doi: 10.1016/j.amepre.2010.11.010. [DOI] [PMC free article] [PubMed] [Google Scholar]
- 17.Malhi L, Karanfil O, Merth T, Acheson M, Palmer A, Finegood DT. Places to intervene to make complex food systems more healthy, green, fair, and affordable. J Hunger Environ Nutr. 2009;4(3–4):466–476. doi: 10.1080/19320240903346448. [DOI] [PMC free article] [PubMed] [Google Scholar]
- 18.Hammond RA, Dubé L. A systems science perspective and transdisciplinary models for food and nutrition security. Proc Natl Acad Sci U S A. 2012;109(31):12356–12363. doi: 10.1073/pnas.0913003109. [DOI] [PMC free article] [PubMed] [Google Scholar]
- 19.Gilbert N, Troitzsch KG.Simulation for the Social Scientist New York, NY: McGraw-Hill International; Book Co2005 [Google Scholar]
- 20.Andreyeva T, Long MW, Brownell KD. The impact of food prices on consumption: a systematic review of research on the price elasticity of demand for food. Am J Public Health. 2010;100(2):216–222. doi: 10.2105/AJPH.2008.151415. [DOI] [PMC free article] [PubMed] [Google Scholar]
- 21.Contento IR, Williams SS, Michela JL, Franklin AB. Understanding the food choice process of adolescents in the context of family and friends. J Adolesc Health. 2006;38(5):575–582. doi: 10.1016/j.jadohealth.2005.05.025. [DOI] [PubMed] [Google Scholar]
- 22.An R, Sturm R. School and residential neighborhood food environment and diet among California youth. Am J Prev Med. 2012;42(2):129–135. doi: 10.1016/j.amepre.2011.10.012. [DOI] [PMC free article] [PubMed] [Google Scholar]
- 23.Auchincloss AH, Riolo RL, Brown DG, Cook J, Diez Roux AV. An agent-based model of income inequalities in diet in the context of residential segregation. Am J Prev Med. 2011;40(3):303–311. doi: 10.1016/j.amepre.2010.10.033. [DOI] [PMC free article] [PubMed] [Google Scholar]
- 24.Giabbanelli PJ, Alimadad A, Dabbaghian V, Finegood DT. Modeling the influence of social networks and environment on energy balance and obesity. J Comp Sci. 2012;3(1–2):17–27. [Google Scholar]
- 25.Zimmerman FJ. Habit, custom, and power: a multi-level theory of population health. Soc Sci Med. 2013;80:47–56. doi: 10.1016/j.socscimed.2012.12.029. [DOI] [PubMed] [Google Scholar]
- 26. National Cancer Institute. Food Attitudes and Behaviors Survey. Available at: http://cancercontrol.cancer.gov/Brp/fab/index.html. Accessed March 29, 2014.
- 27.Moore LV, Roux AVD, Nettleton JA, Jacobs DR, Franco M. Fast-food consumption, diet quality, and neighborhood exposure to fast food: the Multi-Ethnic Study of Atherosclerosis. Am J Epidemiol. 2009;170(1):29–36. doi: 10.1093/aje/kwp090. [DOI] [PMC free article] [PubMed] [Google Scholar]
- 28. US Census Bureau. Census 2010, summary file 1, matrix P7. Available at: http://factfinder2.census.gov. Accessed March 29, 2014.
- 29. California Department of Public Health. Network for a Healthy California. Available at: http://cnngis.org. Accessed March 29, 2014.
- 30.Powell LM, Auld MC, Chaloupka FJ, O’Malley PM, Johnston LD. Associations between access to food stores and adolescent body mass index. Am J Prev Med. 2007;33(4):S301–S307. doi: 10.1016/j.amepre.2007.07.007. [DOI] [PubMed] [Google Scholar]
- 31. Los Angeles County Department of Public Health. Los Angeles County Health Survey. Available at: http://publichealth.lacounty.gov/ha/hasurveyintro.htm. Accessed March 29, 2014.
- 32.Dixon HG, Scully ML, Wakefield MA, White VM, Crawford DA. The effects of television advertisements for junk food versus nutritious food on children’s food attitudes and preferences. Soc Sci Med. 2007;65(7):1311–1323. doi: 10.1016/j.socscimed.2007.05.011. [DOI] [PubMed] [Google Scholar]
- 33.Finkelstein E, French S, Variyam JN, Haines PS. Pros and cons of proposed interventions to promote healthy eating. Am J Prev Med. 2004;27(3):163–171. doi: 10.1016/j.amepre.2004.06.017. [DOI] [PubMed] [Google Scholar]
- 34.Grier S, Bryant CA. Social marketing in public health. Annu Rev Public Health. 2005;26:319–339. doi: 10.1146/annurev.publhealth.26.021304.144610. [DOI] [PubMed] [Google Scholar]
- 35.Manski CF. Identification of endogenous social effects: the reflection problem. Rev Econ Stud. 1993;60(3):531–542. [Google Scholar]
- 36.Hammond RA, Ornstein JT, Fellows LK, Dubé L, Levitan R, Dagher A. A model of food reward learning with dynamic reward exposure. Front Comput Neurosci. 2012;6:82. doi: 10.3389/fncom.2012.00082. [DOI] [PMC free article] [PubMed] [Google Scholar]