

Abstract
Objectives. We examined whether food insecurity was different for children in cohabiting or repartnered families versus those in single-mother or married-parent (biological) families.
Methods. We compared probabilities of child food insecurity (CFI) across different family structures in 4 national data sets: the Early Childhood Longitudinal Study—Birth Cohort (ECLS-B), the Fragile Families and Child Wellbeing Study (FFCWS), the Early Childhood Longitudinal Study—Kindergarten Cohort (ECLS-K), and the Panel Study of Income Dynamics—Child Development Supplement (PSID-CDS).
Results. Unadjusted probabilities of CFI in cohabiting or repartnered families were generally higher than in married-biological-parent families and often statistically indistinguishable from those of single-mother families. However, after adjustment for sociodemographic factors, most differences between family types were attenuated and most were no longer statistically significant.
Conclusions. Although children whose biological parents are cohabiting or whose biological mothers have repartnered have risks for food insecurity comparable to those in single-mother families, the probability of CFI does not differ by family structure when household income, family size, and maternal race, ethnicity, education, and age were held at mean levels.
In 2012, 10% of US households had food-insecure children, meaning that access to adequate food for these children was limited by their households’ lack of money and other resources.1 Food insecurity poses a serious risk to the health and well-being of children; it has been linked to behavioral problems, developmental risk, poor health in infants and toddlers,2,3 and negative academic, social, and psychological outcomes in older children and adolescents.4,5
Traditionally, households headed by single mothers have had the highest rates of child food insecurity (CFI) whereas married-couple households have had the lowest rates: 18.7 versus 6.3%, according to the most recent data from the United States Department of Agriculture (USDA).1 However, federal reports do not provide data on CFI in households characterized by other family structures, which are of increasing prevalence and interest. The most common of these family structures is cohabitation. Today, one fifth of all children in the United States are born to cohabiting, but not married, parents.6–8 There is also little information on CFI in repartnered families, where only 1 of the 2 adults heading the household is a biological parent of the children in the household. Although there are few consistent estimates of the prevalence of these types of families in the United States, US Census Bureau data suggest that between 10% and 20% of children currently live in repartnered families and that more than one third of children will experience this type of living arrangement.9,10 National reports do not provide estimates of CFI for this group; rather, families in which 1 biological parent has remarried are currently grouped with families in which the biological parents of the child are married to each other.1
There is good reason to believe that the prevalence of CFI in cohabiting or repartnered families may be very different from its prevalence in married-biological-parent families. Most studies find that cohabiting unions are less stable and that these families have fewer resources than married-parent families,11–13 although findings on child well-being in cohabitating families are mixed. Regarding repartnered families, new partners may contribute resources, thereby improving food security,14 but previous research suggests that stepparents may underinvest in nonbiological children, because they may be providing resources to their prior biological children in other households or because they are less committed to nonbiological children.15–18 Additionally, the instability that often accompanies repartnering may be harmful for a child’s well-being.19,20
Economic models for the dynamics of food insecurity21,22 suggest that decisions about food consumption are driven in part by families’ past and future resources and their ability to maintain consistent consumption over time, implying that stability and consistency may be as important for children’s food security as absolute level of resources. Thus, although single-mother families may have the fewest resources, they may not necessarily have a higher risk of food insecurity than these other nontraditional family types (cohabiting parents and repartnered parents), because of the potential instability of these family structures. A handful of previous studies have examined food insecurity across different family structures; however, these studies are dated and have relied on limited measures of food insecurity.11,23–26 The USDA’s 18-item food security module (FSM) is considered the best measure of household food security. Previous studies, however, have often used measures of food insecurity based on 3 or fewer questions, making them of questionable validity. As a consequence, most studies have not been able to identify CFI, which involves limited access to adequate food specifically among children. Separately examining CFI is important, as parents often act to protect children from food insecurity by reducing their own food intake,1 implying that general household measures could indicate food insecurity when children themselves may not be food insecure. One recent study of family change, which used the full 18-item FSM, found that transition into a maternal union was associated with lower household food insecurity. However, this study did not investigate CFI, nor did it report on rates of food insecurity by different family structures.27
We investigated 2 complementary research questions: (1) How do rates of CFI for children in cohabiting and repartnered homes compare with those for children living with married biological parents or single mothers? (2) Do any differences in the rates of food insecurity among children in different family structures persist after adjustment for sociodemographic factors typically associated with both family structure and food insecurity? Our study makes a number of concrete contributions. First, we used a highly reliable and valid measure of CFI: the 8 child-referenced items from the USDA’s FSM. Second, our first research question was used to generate comprehensive and contemporary epidemiological evidence about potential differences (or similarities) in rates of CFI in different family types on the basis of analyses of 4 national data sets, an important contribution given limitations in current federal reporting. Last, our adjusted models (which examined differences in CFI between families that were average in all other regards) have the greatest potential to inform policies and programs that aim to eliminate CFI.
METHODS
Each of our 4 data sets contained detailed information on family structure and CFI. These data sets (along with the age of the children in our analytic samples) were as follows: the Early Childhood Longitudinal Study—Birth Cohort (ECLS-B; ages birth–6 years), the Fragile Families and Child Wellbeing Study (FFCWS; ages 2–6 years), the Early Childhood Longitudinal Study—Kindergarten Cohort (ECLS-K; ages 5–14 years), and the Panel Study of Income Dynamics—Child Development Supplement (PSID-CDS; ages 3–17 years). Detailed information on each data set is provided elsewhere.28–31
We examined multiple data sets for 2 main reasons. First, given the lack of recent data on family structure and CFI, the use of multiple, recent data sets offered the opportunity to provide comprehensive evidence regarding an important child health problem. Second, although there are many similarities among our sources of data, each is also unique in some regard, affording us a more nuanced understanding of the relationship between family structure and food insecurity derived from the strengths of each data set. By adopting this approach, our expectation was that consistent results across data sets would offer more compelling evidence, whereas divergent findings would prompt reflection on the causes and consequences of those differences and stimulate future research.
Study Samples
For each data set, we focused on families in which the respondent was the biological mother of at least 1 child in the family and we excluded all other families. To ensure consistency across data sets, we analyzed data for 1 child in a given family, randomly selecting a child from families with twins in the ECLS-K and the ECLS-B and from families with more than 1 focal child in the PSID-CDS. In the FFCWS, data are collected only on a single focal child. For each data set, we retained observations across multiple waves for which complete information on family structure, food insecurity, and applicable covariates were available. Thus, our analytic sample for each data set comprised 1 or more observations on sample families, which we pooled into a combined cross-section. Accordingly, a family that changed structure between survey waves would contribute 2 observations with different family structures to the pooled sample. Sample sizes for our pooled cross-sections as well as the number of unique families in each sample are listed in Table 1. We separated families into 4 groups on the basis of parental reports of family structure: married-biological-parent families, cohabiting-biological-parent families, single-mother families, and repartnered families (in which the biological mother is cohabiting with or married to a partner who is not the biological father of the focal child).
TABLE 1—
Characteristics of the Study Population, by Data Set
| Analytic Sample | ECLS-B (n = 31 900),a No. (%) or Mean ±SD | FFCWS (n = 5761), No. (%) or Mean ±SD | ECLS-K (n = 41 530),a No. (%) or Mean ±SD | PSID-CDS (n = 2788), No. (%) or Mean ±SD |
| Unique families | 9700 | 3494 | 15 380 | 1792 |
| Child food insecurity | 1850 (5.8) | 467 (8.1) | 1960 (4.7) | 189 (6.8) |
| Family type | ||||
| Married | 20 550 (64.5) | 1807 (31.4) | 28 850 (69.5) | 1675 (60.1) |
| Cohabiting | 3350 (10.5) | 1054 (18.3) | 1120 (2.7) | 107 (3.8) |
| Single | 6800 (21.4) | 2192 (38.1) | 7830 (18.9) | 838 (30.1) |
| Repartnered | 1150 (3.6) | 708 (12.3) | 3730 (9.0) | 168 (6.0) |
| Mother’s race/ethnicity | ||||
| Non-Hispanic White | 14 400 (45.2) | 1286 (22.3) | 26 800 (64.5) | 1389 (49.8) |
| Non-Hispanic Black | 5200 (16.3) | 2860 (49.6) | 4380 (10.5) | 1130 (40.5) |
| Hispanic (any race) | 6000 (18.9) | 1431 (24.8) | 6470 (15.6) | 170 (6.1) |
| Non-Hispanic other | 6250 (19.6) | 184 (3.2) | 3890 (9.4) | 99 (3.6) |
| Mother’s education | ||||
| < high school | 5250 (16.5) | 1491 (25.6) | 4320 (10.4) | 522 (18.7) |
| High school or equivalent | 8650 (27.2) | 1598 (27.7) | 10 760 (25.9) | 908 (32.6) |
| > high school | 17 950 (56.4) | 2672 (46.4) | 26 450 (63.7) | 1358 (48.7) |
| Mother’s age, y | 30.4 ±6.6 | 29.0 ±6.1 | 37.3 ±6.69 | 36.3 ±7.0 |
| Household income, $1000s (2011) | 66.8 ±61.6 | 43.8 ±53.6 | 74.0 ±57.0 | 75.3 ±91.9 |
| No. of children in household | 2.34 ±1.19 | 2.44 ±1.34 | 2.46 ±1.13 | 2.18 ±1.04 |
| No. of adults in household | 2.16 ±0.82 | 2.00 ±0.89 | 2.11 ±0.73 | 1.90 ±0.70 |
| Child’s age, y | 2.4 ±1.9 | 3.8 ±1.1 | 8.8 ±2.9 | 9.1 ±3.7 |
Source. ECLS-B = Early Childhood Longitudinal Study—Birth Cohort28; FFCWS = Fragile Families and Child Wellbeing Study30; ECLS-K = Early Childhood Longitudinal Study—Kindergarten Cohort29; PSID-CDS = Panel Study of Income Dynamics—Child Development Supplement.31
Per data license restriction, sample sizes are rounded to the nearest 50 in the ECLS-B and the nearest 10 in the ECLS-K.
The Children’s Food Security Scale
To measure CFI in all 4 data sets, we used the 8 child-referenced questions of the FSM, which separately constitute the Children’s Food Security Scale (CFSS).32 The CFSS was included in the 9-month, 2-year, 4-year, and 5-year waves of the ECLS-B; the 3-year and 5-year waves of the FFCWS; the kindergarten, third-grade, fifth-grade, and eighth-grade waves of the ECLS-K; and the CDS I and CDS II waves of the PSID. We examined these waves of data for our analyses. It is important to note that, because the questions in the CFSS ask about all children in the household, they determine whether any child in the household was food insecure but not the food security status of individual children. Per USDA guidelines,33 we classified households with CFSS raw scores (number of affirmative responses) of 0 or 1 as having children that were food secure and households with raw scores of 2 or higher as having children that were food insecure. Although this approach follows guidance provided by the USDA, it is a conservative assessment of the inability to meet food needs, as even 1 affirmative response to the CFSS could be cause for concern.
Control Variables
In analyses described in “Analysis,” we controlled for a common set of factors in each data set. We selected variables that had been established in previous literature as being related to both family structure and CFI, and which might explain any differences in CFI between family structures. These included the following: mother’s race or ethnicity (non-Hispanic White, non-Hispanic Black, Hispanic of any race, non-Hispanic other), mother’s education (< high school, high school degree, > high school), mother’s age in years (younger than 24, 24–29, 30–35, older than 35), household income (in 2011 thousands of dollars), number of children and adults in the household, and the focal child’s age in years. Table 1 provides descriptive information for all variables.
Analysis
For each data set, we created pooled cross-sections of family wave observations by combining data for cases with complete information from all available waves. To assess the relationship between family structure and CFI, we specified both unadjusted and adjusted logistic regression models. We treated each family wave observation as independent, clustering standard errors at the family level to account for the nonindependence of repeated observations.34 Thus, our primary analytic approach was designed to take advantage of the large sample sizes of our pooled data sets to estimate the cross-sectional relationship between family structure and CFI.
To improve interpretability and to produce what we consider to be more realistic estimates, we used the results of the logistic regression analyses to generate predicted probabilities of CFI, holding all covariates in the adjusted models at their mean values in each data set. We compared these probabilities among family structure types, employing a Bonferroni adjustment for multiple comparisons. Because our predicted probability results adjusted for multiple comparisons and compared food insecurity across different family structures that are average in all other regards, these are our preferred results.
Our unadjusted results indicate whether rates of CFI differ by family structure, an important question given the dearth of recent research and the policy-relevant potential for targeted food assistance programs to alleviate food insecurity. Furthermore, given the limitations of federal reporting, these unadjusted rates fill an important gap by presenting estimates of food insecurity in cohabiting and repartnered families that are most directly comparable to those for married and single-parent families presented in federal reports.1 Our adjusted models provide additional insight, helping to clarify whether differences are due to income, family size, or other family characteristics (which are typically understood to influence food insecurity and are related to family structure), or whether family structure is a risk factor above and beyond the influence of these covariates. We completed all analyses using Stata version 12 (StataCorp LP, College Station, TX).
RESULTS
Table 2 presents results from both the unadjusted and adjusted cross-sectional logistic regression models of CFI on family type. Overall, in our bivariate models, the odds of CFI were higher in other family types than in married-biological-parent families. Except in the PSID-CDS, our unadjusted results indicated that the odds of CFI were higher for children in cohabiting-, single-, and repartnered-parent families than for those living with married biological parents. In the PSID-CDS, odds of food insecurity were significantly higher for children in single-parent and repartnered families, but not in cohabiting-parent families. In our adjusted models, there were fewer statistically significant differences between odds of CFI in married-biological-parent families and in families with other structures, and the magnitudes of the statistically significant coefficients were smaller than in the unadjusted results. Compared with children in married-biological-parent families, children in single-mother and repartnered families had significantly higher odds of food insecurity in the ECLS-B and PSID-CDS; children in cohabiting and single-mother families had higher odds of food insecurity in the ECLS-K, and children in single-mother families had higher odds of food insecurity in the FFCWS.
TABLE 2—
Unadjusted and Adjusted Odds of Child Food Insecurity, by Family Structure and Data Set
| ECLS-B, OR (95% CI) |
FFCWS, OR (95% CI) |
ECLS-K, OR (95% CI) |
PSID-CDS, OR (95% CI) |
|||||
| Variable | Unadjusted | Adjusted | Unadjusted | Adjusted | Unadjusted | Adjusted | Unadjusted | Adjusted |
| Family typea | ||||||||
| Cohabiting | 2.40*** (2.02, 2.85) | 1.08 (0.91, 1.30) | 2.29*** (1.65, 3.19) | 1.40 (0.98, 2.01) | 3.85*** (3.07, 4.82) | 1.45** (1.15, 1.84) | 1.52 (0.65, 3.56) | 0.53 (0.22, 1.31) |
| Single | 3.21*** (2.82, 3.66) | 1.17* (1.01, 1.37) | 2.58*** (1.93, 3.43) | 1.53* (1.09, 2.14) | 3.34*** (2.96, 3.77) | 1.48*** (1.28, 1.71) | 3.71*** (2.60, 5.28) | 2.33** (1.36, 3.98) |
| Repartnered | 2.69*** (2.08, 3.47) | 1.32* (1.00, 1.37) | 1.92*** (1.32, 2.77) | 1.20 (0.80, 1.82) | 1.70*** (1.41, 2.06) | 1.12 (0.91, 1.36) | 2.33** (1.26, 4.30) | 2.20* (1.11, 4.35) |
| Mother’s race/ethnicitya | ||||||||
| Non-Hispanic Black | 0.92 (0.77, 1.10) | 0.82 (0.59, 1.16) | 1.04 (0.86, 1.25) | 1.23 (0.77, 1.96) | ||||
| Hispanic (any race) | 1.20* (1.02, 1.41) | 1.09 (0.78, 1.53) | 1.65*** (1.42, 1.91) | 2.67** (1.48, 4.82) | ||||
| Non-Hispanic other | 1.04 (0.86, 1.25) | 1.08 (0.51, 2.67) | 1.39** (1.14, 1.70) | 1.34 (0.57, 3.17) | ||||
| Mother’s educationa | ||||||||
| High school or equivalent | 0.76*** (0.66, 0.87) | 0.96 (0.74, 1.25) | 0.75*** (0.65, 0.87) | 0.50** (0.33, 0.77) | ||||
| More than high school | 0.57*** (0.48, 0.67) | 0.87 (0.66, 1.14) | 0.63*** (0.54, 0.74) | 0.50** (0.32, 0.79) | ||||
| Mother’s age,a y | ||||||||
| 24–29 | 1.58*** (1.34, 1.85) | 1.24 (0.93, 1.65) | 1.20 (0.85, 1.70) | 2.04 (0.86, 4.82) | ||||
| 30–35 | 2.00*** (1.66, 2.42) | 1.15 (0.81, 1.63) | 1.52* (1.08, 2.16) | 1.25 (0.51, 3.06) | ||||
| > 35 | 2.30*** (1.87, 2.84) | 1.95*** (1.38, 2.77) | 1.65** (1.16, 2.35) | 1.72 (0.69, 4.30) | ||||
| Household income, $1000s (2011) | 0.96*** (0.96, 0.96) | 0.98*** (0.97, 0.98) | 0.97*** (0.97, 0.97) | 0.98*** (0.97, 0.99) | ||||
| No. of children | 1.18*** (1.13, 1.23) | 1.17*** (1.09, 1.25) | 1.23*** (1.18, 1.28) | 1.30*** (1.13, 1.50) | ||||
| No. of adults | 0.99 (0.93, 1.06) | 1.09 (0.97, 1.22) | 1.02 (0.95, 1.09) | 1.47** (1.12, 1.92) | ||||
| Child’s age | 1.04*** (1.02, 1.07) | 0.96 (0.89, 1.04) | 1.01 (0.99, 1.03) | 1.01 (0.95, 1.06) | ||||
Note. CI = confidence interval; OR = odds ratio.
Source. ECLS-B = Early Childhood Longitudinal Study—Birth Cohort28; FFCWS = Fragile Families and Child Wellbeing Study30; ECLS-K = Early Childhood Longitudinal Study—Kindergarten Cohort29; PSID-CDS = Panel Study of Income Dynamics—Child Development Supplement.31
Referent categories include the following: married, mother non-Hispanic White, mother’s education < high school, and mother aged < 24 years.
*P < .05; **P < .01; ***P < .001. All standard errors are clustered by family.
Figure 1 presents predicted probabilities of CFI by family structure and data set based on both the adjusted and unadjusted models. Unlike in Table 2, in this figure we present the predicted probabilities after holding all covariates at their means in the adjusted models. Error bars in the figure indicate 95% confidence intervals for the predictions. Predicted probabilities that share a letter (lowercase for unadjusted results and uppercase for adjusted results) were not significantly different at the P < .05 level. For example, in Figure 1a, the letter “a” shared by cohabitating and repartnered families indicates that the difference in the predicted unadjusted probability of CFI in these 2 family structures was statistically insignificant.
FIGURE 1—
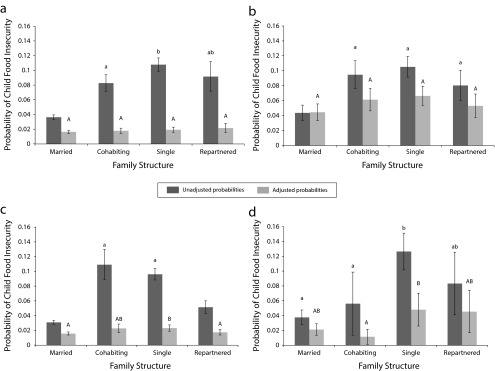
Unadjusted and adjusted predicted probabilities of child food insecurity, by family structure and (a) ECLS-B, (b) FFCWS, (c) ECLS-K, and (d) PSID-CDS.
Note. Predicted probabilities sharing a letter are not significantly different at the α = .05 level. Lower case letters refer to comparisons for unadjusted probabilities. Upper case letters refer to comparisons for adjusted probabilities. Adjusted models control for mother's race/ethnicity, mother's education, mother's age, household income, the number of children and adults in the household, and child age.
Source. ECLS-B = Early Childhood Longitudinal Study—Birth Cohort28; FFCWS = Fragile Families and Child Wellbeing Study30; ECLS-K = Early Childhood Longitudinal Study—Kindergarten Cohort29; PSID-CDS = Panel Study of Income Dynamics—Child Development Supplement.31
Predicted probabilities of CFI varied by family type. Unadjusted predicted probabilities (represented by the darker bars in Figure 1) of CFI are between 0.031 (ECLS-K) and 0.044 (FFCWS) for married-biological-parent families, between 0.056 (PSID-CDS) and 0.109 (ECLS-K) for cohabiting-biological-parent families, between 0.096 (ECLS-K) and 0.126 (PSID-CDS) for single-mother families, and between 0.051 (ECLS-K) and 0.092 (ECLS-B) for repartnered families. Predicted probabilities based on our unadjusted models largely replicated the pattern of results summarized in Table 2.
Two sets of results from these unadjusted models are noteworthy. First, in 3 of the data sets (ECLS-B, FFCWS, and ECLS-K), the predicted unadjusted probabilities for children living with married biological parents were significantly lower than for all other family types. Second, in all 4 data sets, the probability of CFI in single-mother families was statistically indistinguishable from those for children in cohabiting-parent families, repartnered families, or both cohabiting-parent and repartnered families. For example, in the ECLS-B, the probability of food insecurity for children in cohabiting-biological-parent and repartnered families was twice as high as for children from married-biological-parent families, but there was no statistical difference in probabilities between repartnered and single-mother families. Similarly, in the FFCWS, the probability of food insecurity was highest for children in single-mother families, but it was not statistically different from those for children in cohabiting-biological-parent or repartnered families.
The lighter bars in Figure 1 present predicted probabilities from the adjusted models. The inclusion of covariates and the Bonferroni adjustment for multiple comparisons resulted in a pattern of predicted CFI that was markedly different from the adjusted logistic regression results in Table 2. These results indicate that after we held other correlates of food insecurity and family structure (mother’s race and ethnicity, mother’s education, mother’s age, household income, the number of children and adults in the family, and child’s age) at their means, the predicted probability of CFI in an average household was nearly identical for the different family types. Only in the ECLS-K and PSID-CDS data sets were any family-type comparisons still statistically significant in the adjusted models. In the ECLS-K, the probability of CFI was statistically significantly lower in married-biological-parent families and repartnered families than in single-mother families, although these differences were small in magnitude (0.007 and 0.006, respectively). In the PSID-CDS, only the difference between cohabiting-biological-parent and single-mother families remained statistically significant.
DISCUSSION
Using 4 nationally representative US data sets, we found that rates of CFI in families where biological parents were cohabiting but not married and in families where biological mothers were repartnered (cohabiting with or married to new partners who were not the biological father of the focal child) were high and often statistically indistinguishable from those in single-mother families, the group typically identified as being at highest risk of CFI in federal reports.1,33,35 In models that adjusted for household income, family size, and maternal race, ethnicity, education, and age, differences between family structures were attenuated and sometimes not statistically significant. Furthermore, our adjusted results in Figure 1 demonstrated that there were few significant differences in predicted probabilities of food insecurity between children in various family structures when all other variables were held at mean values.
The few previous studies that examined associations between family structure and food insecurity generally found that single-mother families had the highest levels of household food insecurity and married-parent families had the lowest, with cohabiting-parent families in between.11,23–26 The studies able to examine the biological status of parents and children also found that families with 2 biological parents (whether married or cohabiting) had lower food insecurity than families with 1 biological and 1 nonbiological parent; however, regardless of biology, married-parent families had lower food insecurity.11,24–26 Our unadjusted results, which point to levels of CFI in cohabiting-biological-parent and repartnered-mother families that were often indistinguishable from those in single-mother families, are only partially consistent with this previous work, although our finding that rates were lowest in married-biological-parent families supports the conclusions of previous research. Our adjusted results, indicating substantially attenuated differences between family types after we held sociodemographic characteristics at their means, are consistent with some previous research.11,36
These previous studies had a number of limitations that the present study addresses. First and foremost, none of these previous studies specifically investigated food insecurity among children. Second, and related to the first point, none used the USDA FSM,32 which is used to generate the official nationally representative estimates of CFI. Previous studies relied instead on the 3 questions available in the National Survey of American Families,11,23–26 or the single question available in the Survey of Income and Program Participation.23 Thus, our study contributes to this literature by focusing specifically on CFI—a more severe and potentially harmful indicator of material hardship—and by using the full CFSS module, which is a more valid and reliable measure of food insecurity and is comparable to national data.
In addition, our study is the first, to our knowledge, to compare rates of CFI between single-mother families and cohabiting-biological-parent and repartnered families after adjustment for other factors; previous multivariate analyses did not examine single mothers11 or examined food insecurity as part of a group of material hardships.24 Explicit comparisons among cohabiting-, repartnered-, and single-mother families is an important contribution given the increasing prevalence of complex and nontraditional family forms6–10 and the long-held assumption that children in single-mother families are at highest risk for food insecurity. After we controlled for mother’s race/ethnicity, education, and age, household income, child’s age, and the number of adults and children in the household, most of the differences in CFI between the different family structures were no longer statistically significant. This is important because previous research consistently pointed to less material hardship in married 2-parent families than in cohabiting or single-parent families.23,24 Future research should confirm the findings presented here using the CFSS and more recent data from after the Great Recession, when food insecurity substantially increased.1 An additional topic for future research is the potential for changes in family structure to affect food insecurity. Previous research has frequently demonstrated the disruptive effects of these transitions for other child and family well-being outcomes,20,37,38 which may also affect the household resources and dynamics related to food insecurity.
Although our study makes many contributions, it has some limitations. Despite its many benefits, the CFSS (like many other scales) measures food security for all children in the household. Thus, we were unable to explore differences in the relationship between family structure and food insecurity by the age of focal children in our data sets, a topic of potential concern to policymakers. Future research focusing on single-child families or using alternative measures of food insecurity might better explore this issue. Furthermore, despite our use of data from relatively large national surveys, at times, small subgroup sizes precluded us from performing finer-grained analyses. In particular, the ability to separate repartnered families into those in which the parents are cohabiting and those in which they are married would have been desirable. That said, our adjusted models suggest that family structure may be related to CFI through other downstream factors such as household income, parental education, or family size.
Efforts to enroll families with children in nutrition programs such as the Supplemental Nutrition Assistance Program (SNAP) might target children in nontraditional family types given their high levels of risk. An estimated 7.5% of eligible children did not receive SNAP benefits in 2010,39 and participation in other programs like the Special Supplemental Nutrition Program for Women, Infants, and Children has been lower.40 Family structure may provide a mechanism for identifying and targeting children who might most benefit from nutrition assistance programs. However, our results indicated few differences in rates of child food security after we held other factors at mean levels; efforts to eliminate CFI might be better directed at programs that increase household income or provide opportunities for parents to enhance their education or job skills.
Acknowledgments
This project was supported with a grant from the University of Kentucky Center for Poverty Research (UKCPR) through funding by the US Department of Agriculture, Food and Nutrition Service (contract no. AG-3198-B-10-0028).
Note. The opinions and conclusions expressed herein are solely those of the authors and should not be construed as representing the opinions or policies of the UKCPR, any agency of the federal government, or the authors’ affiliations.
Human Participant Protection
This study was exempted from further review by the institutional review boards of Boston University and Rutgers University because all analyses used de-identified secondary data.
References
- 1.Coleman-Jensen A, Nord M, Singh AS. Household food insecurity in the United States in 2012. US Dept of Agriculture, Economic Research Service, 2013. Economic Research Report No. 155. Available at: http://www.ers.usda.gov/ersDownloadHandler.ashx?file=/media/1183208/err-155.pdf. Accessed September 11, 2013.
- 2.Rose-Jacobs R, Black MM, Casey PH et al. Household food insecurity: associations with at-risk infant and toddler development. Pediatrics. 2008;121(1):65–72. doi: 10.1542/peds.2006-3717. [DOI] [PubMed] [Google Scholar]
- 3.Whitaker RC, Phillips SM, Orzol SM. Food insecurity and the risks of depression and anxiety in mothers and behavior problems in their preschool-aged children. Pediatrics. 2006;118(3):e859–e868. doi: 10.1542/peds.2006-0239. [DOI] [PubMed] [Google Scholar]
- 4.Alaimo K, Olson CM, Frongillo EA., Jr Food insufficiency and American school-aged children’s cognitive, academic, and psychosocial development. Pediatrics. 2001;108(1):44–53. [PubMed] [Google Scholar]
- 5.Jyoti DF, Frongillo EA, Jones SJ. Food insecurity affects school children’s academic performance, weight gain, and social skills. J Nutr. 2005;135(12):2831–2839. doi: 10.1093/jn/135.12.2831. [DOI] [PubMed] [Google Scholar]
- 6.Waldfogel J, Craigie T, Brooks-Gunn J. Fragile families and child wellbeing. Future Child. 2010;20(2):87–112. doi: 10.1353/foc.2010.0002. [DOI] [PMC free article] [PubMed] [Google Scholar]
- 7.Wildsmith E, Steward-Streng NR, Manlove J. Childbearing outside of marriage: estimates and trends in the United States. Child Trends, 2011. Publication 2011-29. Available at: http://www.childtrends.org/wp-content/uploads/2013/02/Child_Trends-2011_11_01_RB_NonmaritalCB.pdf. Accessed September 18, 2012.
- 8.Hamilton BE, Martin JA, Ventura SJ et al. Births: preliminary data for 2010. Natl Vital Stat Rep. 2011;60(2):1–26. [PubMed] [Google Scholar]
- 9.US Census Bureau. America’s families and living arrangements: 2009. Housing and Household Economics Statistics Division, Fertility & Family Statistics Branch, 2010. Available at: http://www.census.gov/population/www/socdemo/hh-fam/cps2009.html. Accessed September 20, 2012.
- 10.Coleman M, Ganong L, Fine M. Reinvestigating remarriage: another decade of progress. J Marriage Fam. 2000;62(4):1288–1307. [Google Scholar]
- 11.Manning W, Brown S. Children’s economic well-being in married and cohabiting parent families. J Marriage Fam. 2006;68(2):345–362. [Google Scholar]
- 12.Manning W, Smock PJ, Majumdar D. The relative stability of cohabiting and marital unions for children. Popul Res Policy Rev. 2004;23:135–159. [Google Scholar]
- 13.Osborne C, Manning W. Married and cohabiting parents’ relationship stability: a focus on race and ethnicity. J Marriage Fam. 2007;69(5):1345–1366. [Google Scholar]
- 14.Bzostek SH. Social fathers and child well-being. J Marriage Fam. 2008;70(4):950–961. [Google Scholar]
- 15.Hofferth SL. Residential father family type and child well-being: investment versus selection. Demography. 2006;43(1):53–77. doi: 10.1353/dem.2006.0006. [DOI] [PubMed] [Google Scholar]
- 16.Hofferth SL, Anderson KG. Are all dads equal? Biology versus marriage as a basis for paternal investment. J Marriage Fam. 2003;65(1):213–232. [Google Scholar]
- 17.Case A, Lin I, McLanahan S. Household resource allocation in stepfamilies: Darwin reflects on the plight of Cinderella. Am Econ Rev. 1999;89(2):234–238. [Google Scholar]
- 18.Sweeney MM. Remarriage and stepfamilies: strategic sites for family scholarship in the 21st century. J Marriage Fam. 2010;72(3):667–684. [Google Scholar]
- 19.Cooper CE, McLanahan S, Meadows S, Brooks-Gunn J. Family structure transitions and maternal parenting stress. J Marriage Fam. 2009;71(3):558–574. doi: 10.1111/j.1741-3737.2009.00619.x. [DOI] [PMC free article] [PubMed] [Google Scholar]
- 20.Beck AN, Cooper CE, McLanahan S, Brooks-Gunn J. Partnership transitions and maternal parenting. J Marriage Fam. 2010;72(2):219–233. doi: 10.1111/j.1741-3737.2010.00695.x. [DOI] [PMC free article] [PubMed] [Google Scholar]
- 21.Gundersen C, Gruber J. The dynamic determinants of food insufficiency. In: Andrews MS, Prell MA, editors. Second Food Security Measurement and Research Conference, Vol. 2: Papers. Food Assistance and Nutrition Research Report No. 11-2. Washington, DC: US Dept of Agriculture, Economic Research Service; 2001. pp. 91–109. [Google Scholar]
- 22.Ribar DC, Hamrick KS. Dynamics of poverty and food sufficiency. US Dept of Agriculture, Economic Research Service, 2003. Food Assistance and Nutrition Research Report No. 36. Available at: http://www.ers.usda.gov/publications/fanrr-food-assistance-nutrition-research-program/fanrr36.aspx. Accessed January 10, 2011.
- 23.Lerman RI. How do marriage, cohabitation, and single parenthood affect the material hardship of families with children? Urban Institute, 2002. Available at: http://www.urban.org/publications/410539.html. Accessed March 3, 2012.
- 24.Lerman RI. Impacts of marital status and parental presence on the material hardship of families with children. Urban Institute, 2002. Available at: http://www.urban.org/publications/410538.html. Accessed March 3, 2012.
- 25.Acs G, Nelson S. Changes in family structure and child well-being: evidence from the 2002 National Survey of America’s Families. Urban Institute, 2003. Available at: http://www.urban.org/publications/311025.html. Accessed February 29, 2012.
- 26.Acs G, Nelson S. The kids are alright? Children’s well-being and the rise in cohabitation. Urban Institute, 2002. Series B, No. B-48. Available at: http://www.urban.org/publications/310544.html. Accessed February 29, 2012.
- 27.Hernandez DC, Pressler E. Maternal union transitions and household food insecurity differences by race and ethnicity. J Fam Issues. 2013;34(3):373–393. [Google Scholar]
- 28.Snow K, Thalji L, Derecho A . Early Childhood Longitudinal Study, Birth Cohort (ECLS-B), Preschool Year Data File User’s Manual (2005-06) Washington, DC: National Center for Education Statistics, Institute of Education Sciences; 2007. NCES publication 2008-024. [Google Scholar]
- 29.Tourangeau K, Nord C, Le T, Sorongon AG, Najarian M. Early Childhood Longitudinal Study, kindergarten class of 1998–1999 (ECLS-K), combined user’s manual for the ECLS-K eighth grade and K-8 full sample data files and electronic codebooks. National Center for Education Statistics, US Dept of Education, 2009. NCES publication 2009-004. Available at: http://nces.ed.gov/ecls/data/ECLSK_K8_Manual_part1.pdf. Accessed March 15, 2009.
- 30.Reichman NE, Teitler JO, Garfinkel I, McLanahan SS. Fragile families: sample and design. Child Youth Serv Rev. 2001;23(4–5):303–326. [Google Scholar]
- 31.McGonagle KA, Schoenim RF, Sastry N, Freedman VA. The Panel Study of Income Dynamics: overview, recent innovations, and potential for life course research. Longit Life Course Stud. 2012;3(2):268–284. doi: 10.14301/llcs.v3i2.188. [DOI] [PMC free article] [PubMed] [Google Scholar]
- 32.Nord M, Bickel G. Measuring children’s food security in US households, 1995–1999. US Dept of Agriculture, 2002. Food Assistance and Nutrition Research Report No. 25. Available at: http://webarchives.cdlib.org/sw1tx36512/http:/www.ers.usda.gov/Publications/fanrr25/. Accessed February 1, 2012.
- 33.Coleman-Jensen A, Nord M, Andrews M, Carlson S. Household food security in the United States in 2010. US Dept of Agriculture, 2011. Economic Research Report No. 125. Available at: http://www.ers.usda.gov/media/121076/err125_2_.pdf. Accessed October 2, 2011.
- 34.Wooldridge JM. Cluster-sample methods in applied econometrics. Am Econ Rev. 2003;93(2):133–138. [Google Scholar]
- 35.Coleman-Jensen A, Nord M, Andrews M, Carlson S. Household food security in the United States in 2011. US Dept of Agriculture, Economic Research Service, 2012. Economic Research Report No. ERR-141. Available at: http://www.ers.usda.gov/media/884525/err141.pdf. Accessed September 17, 2012.
- 36.Kalil A, Chen J. Mothers’ citizenship status and household food insecurity among low-income children of immigrants. New Dir Child Adolesc Dev. 2008;2008(121):43–62. doi: 10.1002/cd.222. [DOI] [PubMed] [Google Scholar]
- 37.Osborne C, Berger LM, Magnuson K. Family structure transitions and changes in maternal resources and well-being. Demography. 2012;49(1):23–47. doi: 10.1007/s13524-011-0080-x. [DOI] [PMC free article] [PubMed] [Google Scholar]
- 38.Fomby P, Cherlin A. Family instability and child well-being. Am Sociol Rev. 2007;72(2):181–204. doi: 10.1177/000312240707200203. [DOI] [PMC free article] [PubMed] [Google Scholar]
- 39.Eslami E, Leftin J, Strayer M. Supplemental Nutrition Assistance Program participation rates: fiscal year 2010. Mathematica Policy Research, 2012. Available at: http://www.fns.usda.gov/sites/default/files/Trends2010.pdf. Accessed February 21, 2014.
- 40.Martinez-Schiferl M, Giannarelli L, Zedlewski S. National and state-level estimates of Special Supplemental Nutrition Program for Women, Infants, and Children (WIC) eligibles and program reach, 2010. 2013. Report No. WIC-13-ELIG. Available at: http://www.fns.usda.gov/sites/default/files/WICEligibles2010Vol1.pdf. Accessed February 18, 2014.