

Abstract
Background
Human cytomegalovirus (HCMV) is a virus which has the potential to alter cellular gene expression through multiple mechanisms.
Objective
With the application of DNA microarrays, we could monitor the effects of pathogens on host-cell gene expression programmes in great depth and on a broad scale.
Methods
Changes in mRNA expression levels of human endothelial-like ECV304 cells following infection with human cytomegalovirus AD169 strain was analyzed by a microarray system comprising 21073 60-mer oligonucleotide probes which represent 18716 human genes or transcripts.
Results
The results from cDNA microarray showed that there were 559 differential expressed genes consisted of 471 upregulated genes and 88 down-regulated genes. Real-time qPCR was performed to validate the expression of 6 selected genes (RPS24, MGC8721, SLC27A3, MST4, TRAF2 and LRRC28), and the results of which were consistent with those from the microarray. Among 237 biology processes, 39 biology processes were found to be related significantly to HCMV-infection. The signal transduction is the most significant biological process with the lowest p value (p=0.005) among all biological process which involved in response to HCMV infection.
Conclusion
Several of these gene products might play key roles in virus-induced pathogenesis. These findings may help to elucidate the pathogenic mechanisms of HCMV caused diseases.
Keywords: Human cytomegalovirus, microarray, Gene expression profiling, infectomics
Introduction
Human cytomegalovirus (HCMV), which is a species of the cytomegalovirus family of viruses and is alternatively known as human herpesvirus-5 (HHV-5), is the most common pathogen causing congenital infection and primary infection during pregnancy1. It can cause life-threatening systemic infections in immunocompromised patients and has been recognized as a risk factor for vascular diseases, like arterial restenosis and atherosclerosis2. The impacts of HCMV has increased in recent decades due to the rising risk of organ allografting, immunosuppressive treatment, radiation damage, malignant tumor, and human immunodeficiency virus (HIV)-infected patients3,4. As the number of patients suffering from HCMV infections has steadily increased, there is a growing need to understand the molecular mechanism by which the virus causes disease.
HCMV can infect many different cell types in vivo, such as smooth muscle cells, endothelial cells, epithelialcells, neuronal cells, monocyte/macrophage lineage cells and so on5–7. Cytopathic effects of HCMV are varied in different tissues and cell lines. Endothelial cells are natural sites of HCMV infection in vivo following a primary infection and are a possible viral reservoir, suggesting that endothelial cells may play a role in viral spread and persistence8, 9. HCMV infection of endothelial cells is also associated with atherosclerosis and transplant vascular sclerosis in HCMV-infected patients, pointing to the possible role that infected endothelial cells may play in HCMV-mediated diseases. However, the specific mechanisms by which HCMV infects endothelial cells remain unclear. Virus-induced phenotypic changes in host cells are often accompanied with marked changes in gene expression that are related with the pathogenic mechanisms. In the last few years, studies showed changes in gene expression that occur on different host cell types with different types of viral infections10. Therefore, analysis of changes in gene expression that occur on infection of endothelial cells with HCMV will be better for revealing the pathogenic mechanisms of HCMV.
DNA expression profiling microarrays are designed to monitor of hundreds and thousands of mRNA levels, and therefore, analysis of those data from microarray experiment can provide us with important information to understand the biological processes and complex pathogenesis of infectious diseases. This technology has also been used in studies on differenet target cells infected with HCMV, which have different performance depending on probe characteristics, array density, sample labeling methods and the characteristics of target cell11–14. Because most studies aimed at human foreskin fibroblast (HFF) as target cell which was infected by HCMV, gene expression profiling of endothelial cells infected HCMV has not yet been studied intensively.
In this study, we monitored the effects of HCMV on ECV304 gene expression profiling using 60-mer high-density oligo microarray, which allowed us to explore the effects of HCMV on endothelial cell gene expression programme in great depth and on a broad scale. Transcriptional-profiling study has also made us to further understand the mechanism of infectious disease process.
Methods
Cell Culture and Virus Infection
ECV304 cells were obtained from Southern Medical University, Guangzhou. The human cytomegalovirus (HCMV) AD169 strain was kindly provided by Medical College of China Central South University. ECV304 cells were cultured in maintenance medium (MEM, Gibco, US) supplemented with 10% fetal calf serum, glutamine, sodium bicarbonate, penicillin and streptomycin at 37°C with 5% CO2 in a humidified incubator. The HCMV AD169 strain (4.0 logTCID50/0.1ml) was prepared by harvesting the supernatant of infected cells 6 days post-infection (p.i.). The amount of infectious virus released from the infected cells was determined by the TCID50 method. The ECV304 cells that had been confluent for at least 3 days in a Cell Culture Flasks (25cm2) were infected with 1mL purified HCMV virions, which was prepared by harvesting the supernatant of infected cells 6 days post-infection (4.0 logTCID50 /0.1ml). Confluent cells were then grown in maintenance medium with only 2% fetal calf serum to avoid overstimulating cell growth prior to infection. One batch of uninfected ECV304 cells served as control, while other batches were infected with HCMV AD169 strain.
Detection of HCMV DNA in ECV304 cells by PCR
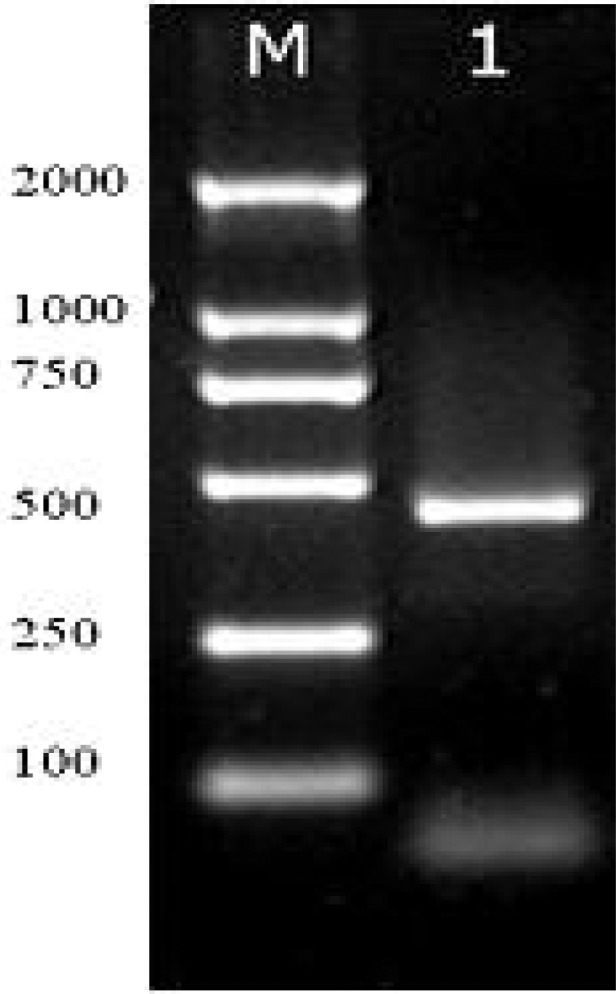
The early protein gene of HCMV genome was amplified by PCR using the primer set: (forward: 5′-CCA AGC GGC CTC TGA TAA CCA AG-3′) and (reverse: 5′-CAG CAC CAT CCT CCT CTT CCT CT -3′), which could be used to produced a 430-bp fragment. PCR was performed in 50 µl reaction mixtures, containing 0.5µg of DNA template, 0.4 µM of each primer, 25 µl of 2×Premix and 18µl of ddH 2O. Cycling conditions consisted of an initial denaturation of 5 min at 94°C; 35 cycles, each cycle consisting of 1 min at 94°C, 30 s at 65°C, and 1 min at 72°C; followed by a final extension step at 72°C for 5 min. The PCR products were electrophoresed using 1.5% agarose gels (Shanghai Yito Enterprise, Shanghai, China) and detected by ethidium bromide staining.
Detection of HCMV pp65 protein expression by immunofluorescence
HCMV pp65 protein expression was demonstrated by immunofluorescence. ECV304 cells were grown on chamber slides and infected with HCMV for 4 days. Infected and uninfected cells were fixed with mixture of 2% paraformaldehyde and 0.1% Triton X-100 for 30 min at room temperature, washed twice with PBS, blocked with normal goat serum for 20 min, and then incubated with mouse anti-HCMV pp65 (US Biological, USA) for 30 min at 37°C. After rinsing with PBS for five times, slides were incubated with FITC-conjugated secondary antibody for 30 min at 37 °C. The slides were visualized with fluorescent microscopy (Nikon TE-2000, US).
Microarray hybridization and analysis
Total RNA from the infected and uninfected cells were extracted using Trizol reagent (Shenergy Biocolor BioScience & Techonology company, Shanghai) according to the manufacturer's instructions. The quality of total RNA for all microarray experiments was controlled by ultraviolet spectrophotometer DU530 (Beckman) and BioAnalyzer 2100 (Agilent, Palo Alto, CA, USA). Total RNAs (500 ng) from the uninfected and infected ECV304 cells were reversed-transcribed and labeled with Cy5- and Cy3-dCTP using Low Input RNA Fluorescent Linear Amplification Kit (Agilent, Palo Alto, CA, USA), respectively. The Cy5- and Cy3- labeled targets are purified using Rneasy mini spin columns (Qiagen), and then mixed and hybridized to the 60mer Human 1A Oligo Microarray Kit (Agilent, Palo Alto, CA, USA). The hybridization volume of 450µl consisted of 7µg of each Cy3- and Cy5-labeled sample, 50µl 10×control target and 225µl 2×hybridization buffer. The mixture was vibrated and centrifuged shortly, then pipetted on a new coverslip and covered with Agilent microarray. The slides were incubated at 60°C for 16 h in the hybridization chamber, and subsequently washed twice with the solution containing 6×SSC and 0.005% Triton X-102 for 10 min at room temperature, followed by ice-cold solution (0.1×SSC, 0.005% Triton X-102) for 5 min. The slides were then dried with nitrogen and stored in dark place. Scanning was performed with an Agilent 2565BA scanner (Agilent, Palo Alto, CA, USA), and the data of the images were acquired using Agilent G2567AA Feature Extraction Software (version 7.1.1). The features were automatically loaded with a grid file and calculated the centroid positions of each spot on the microarray. The Cookie Cutter method was used to define the features. Filtering was automatically performed by first excluding outlier pixels of features and background regions by flagging. The net Cy3 and Cy5 signal intensities for each feature were formed by subtracting the mean of the pixels in the local background from the mean of the pixels in the feature. Considering the features as the real indicators of expression, the spots were included whose foreground signals were significantly greater than the local background signals and additionally, g(r) backgrounds were greater than 2.6 g(r) background standard deviation. Any differences in dye signal intensity were normalized using LOWESS method and a reliable log ratio, p-value and log ratio error for each feature was calculated to give a confidence measure that a gene has been differently expressed. The Onto-Express (OE) software and Annotation Database were used to ananlyze biology processes and annotate genes for the result of microarray, respectively.
Validation of microarray results by Real time qPCR
cDNAs were reverse transcribed from total RNA extracted from HCMV AD169 infected and uninfected ECV304 cells. The cDNAs were amplified by PCR with random six mers and the mixture containing 1×ExScriptTM buffer, 5µM of dNTP mixture, 100 µM of Random 6 mers, 50 U of ExScriptTM RTase, 10 Uof RNase Inhibitor, 400 ng of total RNA and RNase Free dH2 Owere carried out under the following conditions: 10 min at 42°C, 2 s at 95°C. Real-time qPCR was used to to validate microarray and performed on a Rotor Gene 3000 Fluorescence quantitative detection system (CORBETT, Australia) using SYBR RT-PCR Kit DDR041A (Takara, Japan). PCR reactions in a final volume of 10µl reaction mixture contain 5ìl PCR mixture, 1µl diluted cDNA and 0.5 ìM each primer specific primers for six genes selected from differentially expressing genes. The PCR reactions were carried out under the following conditions: an initial denaturation of 5 min at 95°C; 45 cycles, each cycle consisting of 15 s at 95°C, 10 s at 60°C, and 15 s at 72°C. The detail information of special°C primers are showed in Table 1. At the end of the program, the specificity of the primer set was confirmed by melting curve analysis (65–95°C with a heating rate of 0.5°C/min). The copy numbers of target genes and GAPDH mRNA were estimated by comparing the results of real-time PCR with several dilutions (102, 103, 104, 105, 106, 107 copies/reaction). The mRNA level of GAPDH was used to normalize the expression ratio of each gene.
Table 1.
Sequence information of primers designed
| Gene Name | GenBank Accession No. |
Gene name | Sequence | GG(%) | Tm (°C) |
Size (bp) |
| GAPDH | NM_002046 | Homo sapiens glyceraldehyde-3-phosphate | F:- GCACCGTCAAGGCTGAGAAC | 60 | 63.29 | |
| dehydrogenase (GAPDH), | 142 | |||||
| mRNA. | R:-ATGGTGGTGAAGACGCCAGT | 55 | 62.9 | |||
| RPS24 | NM_033022 | Homo sapiens ribosomal protein S24 (RPS24), transcript variant 1, mRNA |
F:-GACAACTGGCTTTGGCATGATTTA | 41.66 | 64.37 | 174 |
| R:-CCA ACATTGGCCTTTGCAGTC | 52.38 | 64.96 | ||||
| LRRC28 | NM_144598 | Homo sapiens leucine rich repeat containing 28 (LRRC28), mRNA. |
F: -GTTTGCCCAGAAATTGGTCGTC | 50 | 64.95 | 190 |
| R:-GGTCCACAGTGAGGTACTGCAGAG | 58.33 | 64.58 | ||||
| MGC8721 | NM_016127 | Homo sapiens hypothetical protein MGC (MGC8721), mRNA |
F: -TTCCCACCGTTACCAGAGATTCA | 47.82 | 64.92 | 179 |
| R:-CAGTTCCCAAGCCTGTCCAGA | 57.14 | 64.87 | ||||
| SLC3 | NM_024330 | Homo sapiens solute carrier family 27, member 3 (SLC3), mRNA. |
F: -AGGTGCTGGAGACATATGGACTGAC | 52 | 64.92 | 142 |
| R: -CCTGTGGTGACATCATAGCGAATC | 50 | 64.97 | ||||
| MST4 | NM_016542 | Homo sapiens Mst3 and SOK1-related | F: -AATACCTGGGCGGTGGTTCA | 55 | 64.72 | |
| kinase (MST4), mRNA | 74 | |||||
| R: -CATGGTAGCAATCTGGAACTCATCA | 44 | 64.5 | ||||
| TRAF2 | NM_021138 | Homo sapiens TNF receptor-associated factor 2 (TRAF2), mRNA. |
F: -GGACCAAGCTGGAAGCCAAGTA | 54.54 | 64.84 | 165 |
| R:-CTTCATATATGCCCTCGTGAACACA | 44 | 64.27 |
Analysis of HCMV infection process by Gene-Ontology and Gene Annotation
According to the biological process defined by Gene Ontology (GO) (http://www.geneontolo-gy.org/), Onto-Express software (OE) (http://vortex.cs.wayne.edu/) was used for analysis of differential expressed genes in HCMV-infected ECV304 cells. Database V2.0 (http://www.genetools.microarray.ntnu.no/) provides information from UniGene (NCBI), EntrezGene, SwissProt and Gene Ontology (GO), which were used
Results
HCMV infection in ECV304 cells
The pp65 is used for rapid diagnosis of infected-host cells, which is expressed in the host cell nuclei during the early phase of the replication cycle (Ho et al, 1998). In this study, we evaluated the expression of pp65 in ECV304 cells using immunofluorescence that is simple, reliable, less time-consuming and cheap. ECV304 cells were infected with HCMV AD169 strain as described in the methods reported for this study. Cells infected with HCMV AD169 showed very intense nuclear staining (figure 1A). In contrast, uninfected cells displayed no detectable staining if subjected to the same conditions as infected cells (figure 1B). In addition, the size of PCR products of HCMV IE gene is consistent to prediction (figure 2). These results indicated that HCMV AD169 stain could infect ECV304 cells.
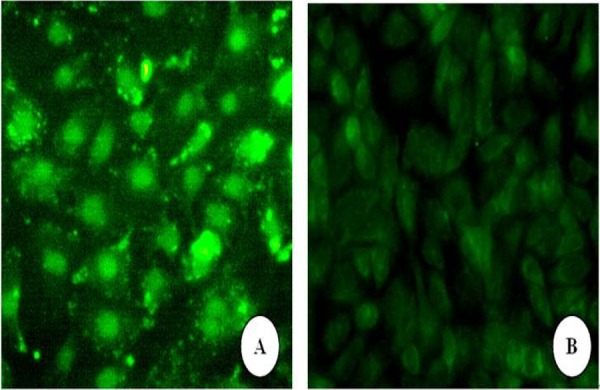
Detection of HCMV pp65 IE protein in HCMV-infected ECV304 cells using immunofluorescence and PCR ECV304 cells were infected with HCMV AD169 strain as escribed in the methods reported for this study.
A: Infected group at 4 d post-infection (green fluorescence show positive pp65 protein locate in infected cells), B: Uninfected group (Original magnification 400×).
Figure 2.
Detection of HCMV pp65 IE protein in HCMV-infected ECV304 cells using immunofluorescence and PCR
Confirmation of total RNA quality
The agar gel electrophoresis showed that there were three bands of 28S rRNA, 18S rRNA and 5S rRNA, with light degradation and little DNA contamination, meeting DNA microarray requirements
Quality control of microarray hybridization
The data is evaluated using Aglient G2567AA Feature Extraction Software (version 7.1) for hybridization efficiency and specificity. The effective hybrid spots were more than 99% meeting the requirements of analysis. As shown in figure 3, the background signal was low. The hybridization signal was homogenous and the shape was regular.
Figure 3.
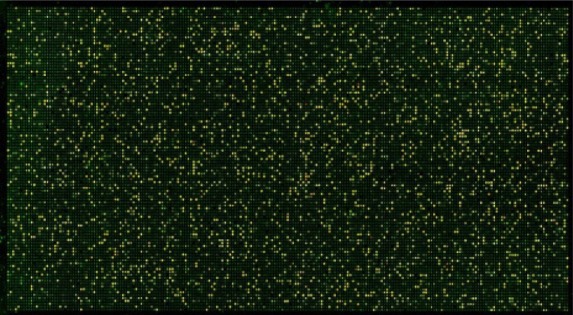
Microarray hybridization scanning picture
The scatter plots of hybridizing signal
The fluorescence intensity of the chip was analyzed using scatter plots. The scatter plot of fluorescence intensities from all points was drawn with gProcessedsignal (Cy3) as ordinate against rProcessedsignal (Cy5) as abscissa as indicated in figure 4). Three colours were used to stand for the distribution of two fluorescence signals from all hybrid dots. The yellow dots represent no significant difference between gProcessedsignal and rProcessedsignal, while red and blue represent significant difference between them. In addition, The red dots indicated upregulated genes of ECV304 cells and the blue dots indicated downregulated genes. According to the distribution of fluorescence intensities, most of the dots were distributed in the yellow region with a few red and blue dots, which is consist with the general rule of high-density cDNA microarray hybridization.
Figure 4.

Scatter plot of Cy3/Cy5 hybridization intensity in microarray
The fluorescence intensity of the chip was analyzed using scatter plots. The scatter plot of fluorescence intensities from all points was drawn with gProcessedsignal (Cy3) as ordinate against rProcessedsignal (Cy5) as abscissa.
Differential expressed gene in HCMV infected-ECV304 cells
The result showed that there were 559 differential expressed genes. 471 genes were found to be expressed up-regulated; 334 of which had clear functions, while 88 genes were found to be expressed down-regulated, 69 of which had clear functions (table 2 and 3). Fold difference is the differences in multiples between HCMV infected-ECV304 cells and uninfected cells. Positive values described up-regulation while negative values described down-regulation.
Table 2.
List of up-regulated genes during HCMV infection in ECV304 cells
| GeneName | Fold difference |
GeneName | Fold difference |
GeneName | Fold difference |
GeneName | Fold difference |
GeneName | Fold difference |
| MGC2668 | 16.83 | FLJ20446 | 7.39 | CNR1 | 5.84 | LOC90355 | 4.64 | FRDA | 3.39 |
| FLJ22757 | 12.59 | TA-LRRP | 7.39 | ZFPL1 | 5.83 | LHFP | 4.58 | SPAG6 | 3.38 |
| GDNF | 11.94 | FGFR2 | 7.37 | CYP11 | 5.71 | POMZP3 | 4.54 | KCNK2 | 3.32 |
| EHF | 11.61 | PPARA | 7.31 | ABCA8 | 5.71 | ART1 | 4.51 | PLA7 | 3.32 |
| TECTB | 11.38 | STAG1 | 7.20 | HD | 5.62 | CISH | 4.37 | SEPX1 | 3.24 |
| STAR | 10.99 | FLJ35808 | 7.11 | CACNA2D1 | 5.60 | ASAH2 | 4.33 | TM9SF2 | 3.22 |
| ATSV | 10.73 | DSCR10 | 7.08 | KREMEN1 | 5.56 | SLC2 | 4.32 | CRB1 | 3.17 |
| NFIB | 10.53 | B3GNT7 | 6.96 | MGC21854 | 5.49 | PCTP | 4.21 | DCOHM | 3.15 |
| HEAB | 10.53 | FLJ90440 | 6.93 | MT1H | 5.35 | MST4 | 4.03 | MRPS | 3.14 |
| GSTM1 | 10.07 | BM039 | 6.87 | CPO | 5.31 | HSD17B2 | 3.98 | HMG20B | 3.12 |
| QDPR | 9.49 | C2GNT3 | 6.76 | RGC32 | 5.26 | CTPS2 | 3.90 | GRIK3 | 3.11 |
| DEFB127 | 9.46 | MGC1203 | 6.75 | HTR7 | 5.26 | MGC10974 | 3.87 | DPM2 | 3.10 |
| BET1 | 9.44 | FLJ21865 | 6.73 | KIAA0570 | 5.22 | ENO3 | 3.85 | BCL10 | 3.08 |
| TNFSF9 | 9.02 | ALS2CR2 | 6.63 | KRTAP9-2 | 5.11 | COP1 | 3.85 | USP13 | 3.08 |
| CYB5R1 | 8.74 | CAPG | 6.62 | C20orf96 | 5.09 | IGLL1 | 3.84 | UNC5H2 | 3.06 |
| FLJ20174 | 8.63 | FLJ13204 | 6.54 | SLC6 | 5.08 | DKFZp131 | 3.83 | ATP6V2 | 3.06 |
| SH2D | 8.23 | CYP1 | 6.29 | CRKL | 5.00 | CAPNS2 | 3.68 | RPS6KA5 | 3.05 |
| SPIB | 8.07 | ARHGAP15 | 6.23 | ZFP2 | 4.87 | SLC22 | 3.67 | VLCS-H1 | 2.99 |
| HSPC023 | 8.07 | MGC49942 | 6.07 | FLJ90311 | 4.86 | GPD1 | 3.64 | PRTN3 | 2.98 |
| LGALS8 | 7.95 | SMARCA2 | 6.06 | TCFL5 | 4.83 | MBD2 | 3.64 | SNFT | 2.98 |
| KCNMB1 | 7.89 | RB1CC1 | 6.05 | TM4SF5 | 4.80 | SMARCA3 | 3.62 | C1orf1 | 2.98 |
| TGFBRAP1 | 7.66 | SNTB2 | 6.04 | CNTN5 | 4.79 | PPIF | 3.61 | ITGA5 | 2.97 |
| SEC24B | 7.64 | FLJ23360 | 5.93 | MUT | 4.78 | CHRNA10 | 3.58 | MGC5528 | 2.96 |
| MGC3295 | 7.50 | FOXL1 | 5.93 | UGT2B11 | 4.75 | LY64 | 3.52 | MPG | 2.96 |
| WBSCR5 | 7.41 | NICE-4 | 5.89 | FLJ14909 | 4.64 | CST5 | 3.43 | ABCC3 | 2.95 |
| GeneName | Fold difference |
GeneName | Fold difference |
GeneName | Fold difference |
GeneName | Fold difference |
GeneName | Fold difference |
| FLJ23168 | 1.71 | MGC15397 | 1.60 | GIT1 | 1.48 | CDH11 | 1.40 | NM_138456.2 | 6.68 |
| UNC45 | 1.71 | HTR | 1.60 | KIF | 1.48 | PAPPA | 1.39 | I_961848 | 6.57 |
| FLJ11785 | 1.70 | LENG5 | 1.59 | SGCE | 1.48 | TNP1 | 1.39 | I_963496 | 6.32 |
| CHGA | 1.70 | NRP2 | 1.59 | HAVCR1 | 1.48 | LOX | 1.39 | NM_178470.1 | 6.14 |
| CCNE2 | 1.68 | EXO1 | 1.58 | ARHGEF1 | 1.48 | RBP3 | 1.38 | NM_173686.1 | 5.81 |
| LOC51142 | 1.68 | TNNC2 | 1.58 | MIP | 1.47 | HOXA11 | 1.38 | I_1100065 | 5.79 |
| MAGEA3 | 1.68 | NELL1 | 1.58 | TBX2 | 1.47 | IDI1 | 1.37 | I_963989 | 5.61 |
| DDX18 | 1.66 | HIST1H2BF | 1.58 | PACRG | 1.47 | FTH1 | 1.37 | NM_001455.1 | 5.22 |
| CD2AP | 1.66 | SYNPR | 1.58 | MNT | 1.46 | MGC16386 | 1.37 | NM_138820.1 | 5.21 |
| MYO | 1.65 | GEMIN7 | 1.58 | PAPSS2 | 1.46 | NM_152669.1 | 50.10 | I_1000218 | 4.99 |
| MGC40499 | 1.65 | NANS | 1.57 | ALEX3 | 1.46 | I_959644 | 16.61 | NM_014693.1 | 4.94 |
| RAB31 | 1.65 | CARD15 | 1.57 | LAMC1 | 1.45 | I_1846457.FL1 | 13.81 | NM_153263.1 | 4.87 |
| TCFL4 | 1.64 | FLJ23259 | 1.56 | MGC3207 | 1.45 | NM_152494.1 | 11.84 | NM_005450.1 | 4.80 |
| BRE | 1.64 | MARS | 1.56 | MGC14161 | 1.44 | NM_015018.1 | 11.52 | I_1000397 | 4.79 |
| DKFZp434E2220 | 1.64 | DMRTC2 | 1.56 | FLJ20637 | 1.43 | I_1109448 | 11.35 | I_1109096 | 4.78 |
| MICB | 1.64 | KIAA0700 | 1.55 | GNB1 | 1.43 | NM_144664.1 | 11.10 | NM_144679.1 | 4.66 |
| C22orf20 | 1.63 | PLA | 1.55 | RPS6KL1 | 1.43 | I_962816 | 10.38 | I_951081 | 4.38 |
| CALM2 | 1.63 | VAPB | 1.55 | ADAMTS5 | 1.43 | I_963159 | 9.84 | I_1151919 | 4.13 |
| HOXD10 | 1.63 | PVRL3 | 1.54 | FLJ22794 | 1.42 | I_1000440 | 9.19 | NM_153030.1 | 4.06 |
| CCNDBP1 | 1.62 | NOS1 | 1.53 | CHAF1B | 1.42 | NM_153010.3 | 9.10 | I_1985061.FL1 | 3.97 |
| GPR10 | 1.62 | TXNIP | 1.51 | MGC13125 | 1.41 | I_963100 | 8.88 | I_964564 | 3.66 |
| SFXN2 | 1.61 | FLJ20605 | 1.50 | DKFZP434P1750 | 1.41 | I_1110275 | 8.86 | NM_152684.1 | 3.63 |
| CYP2 | 1.61 | ATP6V2 | 1.50 | LOC51239 | 1.41 | I_963013 | 7.79 | I_944014 | 3.63 |
| PTK | 1.61 | BTAF1 | 1.50 | C12orf8 | 1.40 | I_960313 | 7.60 | I_931201 | 3.56 |
| CYP27B1 | 1.60 | BAG3 | 1.49 | KRTAP9-4 | 1.40 | NM_152360.1 | 7.48 | I_965874 | 3.56 |
| GeneName | Fold difference |
GeneName | Fold difference |
GeneName | Fold difference |
GeneName | Fold difference |
| I_962880 | 3.53 | NM_178034.1 | 2.34 | I_965027 | 1.82 | NM_016590.2 | 1.53 |
| NM_033416.1 | 3.41 | I_957174 | 2.32 | I_1109565 | 1.81 | I_948919 | 1.52 |
| NM_175053.1 | 3.40 | I_962558 | 2.29 | I_963639 | 1.77 | I_958442 | 1.52 |
| NM_178840.1 | 3.27 | I_964457 | 2.26 | I_931895 | 1.76 | I_936605 | 1.52 |
| I_1912044.FL1 | 3.07 | I_1109311 | 2.23 | I_928385 | 1.76 | I_959893 | 1.51 |
| NM_003017.2 | 2.97 | I_930224 | 2.21 | I_1918165.FL1 | 1.75 | NM_005205.2 | 1.51 |
| I_939261 | 2.93 | I_960356 | 2.18 | NM_138817.1 | 1.75 | I_1100871 | 1.50 |
| I_2015145.FL2 | 2.90 | NM_005737.2 | 2.17 | I_966202 | 1.72 | I_962912 | 1.48 |
| I_1001950 | 2.89 | I_1109914 | 2.15 | I_958498 | 1.68 | NM_176811.1 | 1.48 |
| I_931549 | 2.84 | NM_175906.1 | 2.14 | I_959040 | 1.68 | I_930598 | 1.48 |
| I_928342 | 2.76 | I_2020917.FL1 | 2.07 | I_962848 | 1.67 | NM_153184.1 | 1.47 |
| I_962649 | 2.72 | I_928994 | 2.07 | I_1109458 | 1.67 | I_1109420 | 1.47 |
| I_961465 | 2.71 | NM_175745.1 | 2.05 | I_957145 | 1.66 | I_1109342 | 1.46 |
| I_936604 | 2.71 | NM_152420.1 | 2.03 | I_1847600.FL1 | 1.66 | NM_174900.1 | 1.45 |
| NM_152768.1 | 2.70 | I_930338 | 2.03 | I_961307 | 1.65 | I_930237 | 1.45 |
| NM_032721.2 | 2.69 | NM_001130.4 | 1.99 | NM_002648.1 | 1.65 | I_1109691 | 1.44 |
| I_962007 | 2.66 | I_1100234 | 1.97 | NM_138422.1 | 1.65 | I_1100108 | 1.44 |
| I_929707 | 2.66 | I_965124 | 1.94 | I_1109345 | 1.63 | I_950247 | 1.41 |
| I_965788 | 2.63 | I_956871 | 1.90 | I_931079 | 1.62 | NM_153235.1 | 1.38 |
| NM_178503.1 | 2.60 | I_1958495.FL1 | 1.90 | I_1000606 | 1.62 | I_966412 | 1.37 |
| I_1109303 | 2.59 | NM_080662.1 | 1.88 | I_958063 | 1.57 | I_963553 | 1.37 |
| NM_152371.1 | 2.59 | I_957754 | 1.86 | I_1151935 | 1.54 | ||
| NM_178545.1 | 2.56 | NM_148895.1 | 1.85 | I_929587 | 1.54 | ||
| NM_175918.1 | 2.53 | NM_018338.1 | 1.84 | I_1152052 | 1.53 | ||
| NM_139166.1 | 2.48 | I_931318 | 1.84 | I_963177 | 1.53 |
Table 3.
List of down-regulated genes during HCMV infection in ECV304 cells
| GeneName | Fold difference |
GeneName | Fold difference |
GeneName | Fold difference |
GeneName | Fold difference |
| UEV3 | −131.19 | UBN1 | −1.75 | LOC92906 | −1.54 | I_1100727 | −3.41 |
| LRRC28 | −5.88 | PRM1 | −1.75 | PTCH | −1.54 | I_1109316 | −1.92 |
| EBAG9 | −3.99 | GNE | −1.75 | TTC1 | −1.54 | I_954745 | −1.90 |
| ALLC | −3.86 | HS747E | −1.74 | NR1H2 | −1.52 | I_1109663 | −1.81 |
| DYRK1B | −3.85 | FLJ34389 | −1.72 | CYP4X1 | −1.52 | I_1100463 | −1.76 |
| CDKL5 | −3.74 | AGC1 | −1.72 | NM_004128.1 | −1.51 | I_1109571 | −1.75 |
| NM_152466.1 | −3.49 | FBN1 | −1.71 | SLC8 | −1.51 | I_1151840 | −1.59 |
| C8B | −3.48 | H326 | −1.70 | NM_152680.1 | −1.51 | I_3260602.FL1 | −1.57 |
| OR1 | −3.23 | PCDHB3 | −1.70 | C21orf62 | −1.50 | I_965931 | −1.56 |
| FACL4 | −2.42 | TNFSF10 | −1.67 | MAGEA6 | −1.50 | I_958455 | −1.54 |
| FLJ34658 | −2.21 | RNF2 | −1.66 | COX2 | −1.49 | I_1201909 | −1.49 |
| NM_152693.1 | −2.20 | FAM1 | −1.64 | GPR74 | −1.49 | I_1001952 | −1.49 |
| CAP350 | −2.15 | HDAC5 | −1.63 | LYL1 | −1.49 | I_960767 | −1.42 |
| MGC33212 | −2.13 | KRT1 | −1.62 | CGI-30 | −1.48 | ||
| MGC15737 | −2.00 | RGS2 | −1.61 | GCKR | −1.46 | ||
| ALG12 | −2.00 | SIGIRR | −1.61 | NM_025049.1 | −1.46 | ||
| DDX11 | −1.99 | SNAPAP | −1.60 | KIAA0372 | −1.45 | ||
| RPL24 | −1.96 | CD7 | −1.58 | IL7 | −1.45 | ||
| FAM | −1.91 | SSBP3 | −1.58 | C1orf27 | −1.44 | ||
| MGC4293 | −1.91 | MEL | −1.58 | B4GALT1 | −1.44 | ||
| MGC33214 | −1.88 | RGS6 | −1.57 | IRTA1 | −1.44 | ||
| FLJ20551 | −1.81 | DGUOK | −1.57 | PSMF1 | −1.44 | ||
| UPF3B | −1.80 | TFB | −1.55 | GPCR1 | −1.42 | ||
| GIOT-3 | −1.79 | LOC112840 | −1.55 | DAPK2 | −1.42 | ||
| MRPL30 | −1.76 | ZNF93 | −1.54 | NM_004252.1 | −1.41 |
Validation of microarray results
Six gene selected was performed using real-time RTPCR to validate microarray results and relative quantitation results was showed as follow (table 4). Genes determined by real-time RT-PCR showed similar patterns of expression to those analyzed by microarray, suggesting data reliability from cDNA microarray that settle the base for bio-information analysis and study on the function.
Table 4.
Relative quantitation results of real time RT-PCR
| IS(GADPH) | Target Gene | |||||||||
| Target Gene Name | Result of quantitaion (copies*) |
Relative quantitaion (X) |
Relative quantitaion (Y) (copies*) |
Adjustive quantitaion (Y/X) (copies*) |
Relative quantitaion (Z) |
array (Ratio**) |
difference (Z-Ratio) |
|||
| RPS24 | control | 16238723 | 1 | 60139368 | 60139368 | 1 | 2.44 | / | ||
| infection group |
8862281 | 0.54 | 81432414 | 149211979 | 2.48 | 0.04 | ||||
| MGC8721 | control | 16238723 | 1 | 16839583 | 16839582 | 1 | 2.9 | / | ||
| infection group |
8862281 | 0.54 | 26001917 | 47644388 | 2.83 | -0.07 | ||||
| SLC3 | control | 16238723 | 1 | 451805 | 451805 | 1 | 2.24 | / | ||
| infection group |
8862281 | 0.54 | 1217584 | 2231029 | 4.94 | 2.70 | ||||
| MST4 | control | 16238723 | 1 | 451805 | 451805 | 1 | 4.03 | / | ||
| infection group |
8862281 | 0.54 | 1425852 | 2612647 | 5.78 | 1.75 | ||||
| TRAF2 | control | 16238723 | 1 | 1488105 | 1488105 | 1 | 2.67 | / | ||
| infection group |
8862281 | 0.54 | 3049637 | 5587975 | 3.76 | 1.09 | ||||
| LRRC28 | control | 16238723 | 1 | 11469841 | 11469841 | 1 | 0.17 | / | ||
| infection group |
8862281 | 0.54 | 1272521 | 2331692 | 0.20 | 0.03 | ||||
Biological process analysis of HCMV infection process
559 differential expressed genes were involved in 273 biological processes, 39 of which were significant (P<0.05). As shown in table 5, information from UniGene(NCBI), EntrezGene and Gene Ontology (GO) were used for function annotation and analysis of genes in HCMV infection process. Differential expressed genes induced by HCMV infection were also involved in the pathogenic mechanism of HCMV infection. These genes included apoptosis-related genes (Granzyme B, DAPK2, TARF2, TNFSF9, TNFSF10, Bcl-2L10, TGFBRAP1), G-protein-coupled receptors signal transduction pathway-related genes (RGS6, RGS2, GIT1), c-jun N-terminal kinase and MAPK signaling pathway-related genes (CRKL, SH2D3A, MAP2K2), cell cycle-related genes (cyclinE, E2F), cancer-related genes (MYCL-2). In these biological processes, the P value of signal transduction-related genes is lowest (P=0.005), containing 21 genes. DNA-dependent transcriptional regulation-related genes were the most, containing 29 genes.
Table 5.
Results of Biological process analysis of HCMV Infection process by Gene-Ontology and Gene Annotation
| Biological Process | Gene name | Entrez Gene |
UniGene ID | P-Value |
| 1. signal transduction | 0.005 | |||
| N-acylsphingosine amidohydrolase (non-lysosomal ceramidase) 2 | 56624 | Hs.512645 | ||
| CD2-associated protein | 23607 | Hs.485518 | ||
| Arginine vasopressin receptor 1B | 553 | Hs.1372 | ||
| Prolactin releasing hormone receptor | 2834 | Hs.248119 | ||
| Chemokine (C-X-C motif) receptor 3 | 2833 | Hs.198252 | ||
| Vascular endothelial growth factor | 7422 | Hs.73793 | ||
| Cannabinoid receptor 1 (brain) | 1268 | Hs.75110 | ||
| Guanine nucleotide binding protein (G protein), beta polypeptide 1 | 2782 | Hs.430425 | ||
| Brain and reproductive organ-expressed (TNFRSF modulator) | 9577 | Hs.258314 | ||
| Growth hormone releasing hormone receptor | 2692 | Hs.767 | ||
| Glial cell derived neurotrophic factor | 2668 | Hs.248114 | ||
| Patched homolog (Drosophila) | 5727 | Hs.494538 | ||
| Tumor necrosis factor (ligand) superfamily, member 9 | 8744 | Hs.1524 | ||
| Tumor necrosis factor (ligand) superfamily, member 10 | 8743 | Hs.478275 | ||
| 5-hydroxytryptamine (serotonin) receptor 7 (adenylate cyclase-coupled) | 3363 | Hs.73739 | ||
| 5-hydroxytryptamine (serotonin) receptor | 3355 | Hs.248136 | ||
| TNF receptor-associated factor 2 | 7186 | Hs.522506 | ||
| Taste receptor, type 2, member 1 | 50834 | Hs.567492 | ||
| Membrane-spanning 4-domains, subfamily A, member 1 | 931 | Hs.438040 | ||
| G protein-coupled receptor 74 | 7265 | Hs.519718 | ||
| Ribosomal protein S6 kinase, 90kDa, polypeptide 5 | 9252 | Hs.510225 | ||
| 2.regulation of transcription, | 0.044 | |||
| DNA-dependent | Forkhead | 2300 | Hs.533830 | |
| Transcription factor-like 5 (basic helix-loop-helix) | 10732 | Hs.30696 | ||
| Chromosome 17 open reading frame 49 | 124944 | Hs.511801 | ||
| Ring finger protein 2 | 6045 | Hs.124186 | ||
| Single stranded DNA binding protein 3 | 23648 | Hs.547759 | ||
| Regulatory factor X, 4 (influences HLA class II expression) | 5992 | Hs.388827 | ||
| Interferon regulatory factor 5 | 3663 | Hs.521181 | ||
| Hypothetical protein FLJ14981 | 84954 | Hs.321689 | ||
| Chromatin assembly factor 1, subunit B (p60) | 8208 | Hs.75238 | ||
| MAX binding protein | 4335 | Hs.253552 | ||
| Nuclear receptor subfamily 1, group H, member 2 | 7376 | Hs.432976 | ||
| SWI/SNF related, matrix associated, actin dependent regulator of chromatin, subfamily a, member 3 |
6596 | Hs.3068 | ||
| Bromodomain adjacent to zinc finger domain, | 11177 | Hs.509140 | ||
| High-mobility group 20B | 10362 | Hs.406534 | ||
| E transcription factor 2 | 1870 | Hs.194333 | ||
| Jun dimerization protein p21SNFT | 55509 | Hs.62919 | ||
| DMRT-like family C2 | 63946 | Hs.350507 | ||
| Lymphoblastic leukemia derived sequence 1 | 4066 | Hs.46446 | ||
| Nuclear factor I/B | 4781 | Hs.370359 | ||
| Homeo | 3236 | Hs.123070 | ||
| Homeo | 3207 | Hs.249171 | ||
| Cyclin H | 902 | Hs.292524 | ||
| Peroxisome proliferative activated receptor, alpha | 5465 | Hs.534037 | ||
| Ribosomal protein S6 kinase, 90kDa, polypeptide 5 | 9252 | Hs.510225 | ||
| Histone deacetylase 5 | 10014 | Hs.438782 | ||
| MAX-like protein X | 6945 | Hs.383019 | ||
| T-box 2 | 6909 | Hs.531085 | ||
| 3. cleavage of lamin | 0.03 | |||
| Granzyme B (granzyme 2, cytotoxic T-lymphocyte-associated serine esterase 1) |
3002 | Hs.1051 | ||
| 4. histidine catabolism | 0.039 | |||
| Histidine ammonia-lyase | 3034 | Hs.190783 | ||
| 5. response to chemical substance | 0.027 | |||
| Ribosomal protein S6 kinase, 90kDa, polypeptide 5 | 9252 | Hs.510225 | ||
| 6. regulation of angiogenesis | 0.029 | |||
| Keratin 1 (epidermolytic hyperkeratosis) | 3848 | Hs.80828 | ||
| 7. positive regulation of vascular endothelial growth | 0.034 | |||
| factor receptor signaling pathway | Vascular endothelial growth factor | 7422 | Hs.73793 | |
| 8. response to freezing | 0.019 | |||
| N-acetylneuraminic acid synthase (sialic acid | ||||
| synthase) | 54187 | Hs.522310 | ||
| 9.lipopolysaccharide biosynthesis | 0.045 | |||
| N-acetylneuraminic acid synthase (sialic acid | ||||
| synthase) | 54187 | Hs.522310 | ||
| Glucosamine (UDP-N-acetyl)-2-epimerase/N-acetylmannosamine | ||||
| kinase | 10020 | Hs.5920 | ||
| 10. lactate transport | 0.03 | |||
| Solute carrier 16 (monocarboxylic acid | ||||
| transporters), member 8 | 23539 | Hs.270285 | ||
| 11. UDP-N-acetylglucosamine metabolism | 0.028 | |||
| Glucosamine (UDP-N-acetyl)-2-epimerase/N-acetylmannosamine | ||||
| kinase | 10020 | Hs.5920 | ||
| 12.dihydrobiopterin metabolism | 0.038 | |||
| Quinoid dihydropteridine reductase | 5860 | Hs.75438 | ||
| 13.DNA replication-dependent nucleosome | 0.048 | |||
| assembly | Chromatin assembly factor 1, subunit B (p60) | 8208 | Hs.75238 | |
| 14. cold acclimation | 0.021 | |||
| N-acetylneuraminic acid synthase (sialic acid | ||||
| synthase) | 54187 | Hs.522310 | ||
| 15. sulfate assimilation | 0.028 | |||
| 3′-phosphoadenosine 5′-phosphosulfate synthase 2 | 9060 | Hs.524491 | ||
| 16.neuromuscular junction development | 0.045 | |||
| CUG triplet repeat, RNA binding protein 2 | 10659 | Hs.309288 | ||
| 17.lysyl-tRNA aminoacylation | 0.018 | |||
| Lysyl-tRNA synthetase | 3735 | Hs.3100 | ||
| 18. homoiothermy | 0.024 | |||
| N-acetylneuraminic acid synthase (sialic acid | ||||
| synthase) | 54187 | Hs.522310 | ||
| 19.detection of abiotic stimulus | 0.049 | |||
| G protein-coupled receptor 74 | 10886 | Hs.99231 | ||
| 20.carotenoid biosynthesis | 0.036 | |||
| Isopentenyl-diphosphate delta isomerase 1 | 3422 | Hs.283652 | ||
| 21. protein repair | 0.05 | |||
| Selenoprotein X, 1 | 51734 | Hs.279623 | ||
| 22.endoderm development | 0.044 | |||
| Laminin, gamma 1 (formerly LAMB2) | 3915 | Hs.497039 | ||
| 23.DNA dealkylation | 0.04 | |||
| N-methylpurine-DNA glycosylase | 4350 | Hs.459596 | ||
| 24.aging | 0.048 | |||
| Lysyl oxidase-like 2 | 4017 | Hs.571480 | ||
| 25.platelet activating factor | 0.037 | |||
| biosynthesis | Phospholipase A2, group IVA | |||
| (cytosolic, calcium-dependent) | 5321 | Hs.497200 | ||
| 26.epithelial cell differentiation | 0.047 | |||
| Ets homologous factor | 26298 | Hs.502306 | ||
| 27.spermatid nuclear elongation | 0.022 | |||
| Transition protein 1 (during histone | ||||
| to protamine replacement) | 7141 | Hs.3017 | ||
| 28. estrogen metabolism | 0.045 | |||
| UDP glucuronosyltransferase 2 | ||||
| family, polypeptide B11 | 10720 | Hs.339811 | ||
| 29.methionyl-tRNA aminoacylation | 0.035 | |||
| Methionine-tRNA synthetase | 4141 | Hs.355867 | ||
| 30.fertilization, exchange of | 0.033 | |||
| chromosomal proteins | Transition protein 1 (during histone | |||
| to protamine replacement) | 7141 | Hs.3017 | ||
| 31.S phase of mitotic cell cycle | 0.027 | |||
| DEAD/H (Asp-Glu-Ala-Asp/His) | ||||
| box polypeptide 11 (CHL1-like | ||||
| helicase homolog, S. cerevisiae) | 1663 | Hs.443960 | ||
| 32.complement activation, lectin | 0.042 | |||
| pathway | Keratin 1 (epidermolytic | |||
| hyperkeratosis) | 3848 | Hs.80828 | ||
| 33. leucine catabolism | 0.046 | |||
| Methylcrotonoyl-Coenzyme A | ||||
| carboxylase 2 (beta) | 64087 | Hs.167531 | ||
| 34.N-acetylneuraminate metabolism | 0.017 | |||
| Glucosamine (UDP-N-acetyl)-2-epimerase/N-acetylmannosamine | ||||
| kinase | 10020 | Hs.5920 | ||
| 35.peptidyl-diphthamide | 0.032 | |||
| biosynthesis from peptidyl-histidine | DPH5 homolog (S. cerevisiae) | 51611 | Hs.440776 | |
| 36. DNA damage induced protein | 0.046 | |||
| phosphorylation | Ribosomal protein S6 kinase, 90kDa, | |||
| polypeptide 5 | 9252 | Hs.510225 | ||
| 37. icosanoid metabolism | 0.033 | |||
| Phospholipase A2, group IVA | ||||
| (cytosolic, calcium-dependent) | 5321 | Hs.497200 | ||
| 38.histone phosphorylation | 0.031 | |||
| Ribosomal protein S6 kinase, 90kDa, | ||||
| polypeptide 5 | 9252 | Hs.510225 | ||
| 39. chromatin silencing | 0.041 | |||
| Transition protein 1 (during histone | ||||
| to protamine replacement) | 7186 | Hs.522506 | ||
| Histone deacetylase 5 | 10014 | Hs.438782 |
Discussion
cDNA microarray, which can simultaneously monitor the expression levels of thousands of genes to study the effects of certain treatments, diseases, and developmental stages on gene expression. cDNA microarray has been used to analyses of differential gene expression in virus-infected process, revealing the interaction of virus with host cells, exploring the pathogenic mechanisms of virus and developing antiviral drugs, which is an important research subject of viral infectomics 15–17.
In 1998, Zhu et al18. firstly used DNA array technology to global monitor the levels of about 6600 human mRNAs in HCMV-infected cells as compared with uninfected ones. The level of 258 mRNAs changed by a factor of 4 or more before the onset of viral DNA replication. Several of these mRNAs encode gene products that might play key roles in virus-induced pathogenesis. So it is important to identify them as intriguing targets for further study. In previous study, they used differential display analysis to assess the effect of HCMV infection on the accumulation of cellular RNAs. Fifty-seven partial cDNA clones were isolated, representing about 26 differentially expressed mRNAs. 11 of these mRNAs were virus-coded, and 15 were of cellular origin. But the detection throughout and sensitivity using differential display analysis were lower than those from DNA microarray technology18, 19. Browne et al[11]. used gene chip technology to analyze the effect of HCMV infection on cellular mRNA accumulation and 1425 cellular mRNAs, which include cell cycle regulators, apoptosis regulators, inflammatory pathway genes and immune regulators, were found to be up-regulated or down-regulated by threefold or greater. Simmen et al12. showed that HCMV-regulated gene expression profile in fibroblasts using high-density cDNA microarrays and found that the interaction of gB with its as yet unidentified cellular receptor is the principal mechanism by which HCMV alters cellular gene expression early during infection. These results suggested that HCMV could affect the expression of host genes through many mechanisms. However, most studies just focused on human fibroblast as the host cell infected by HCMV.
In this study, we used ECV304 as target cells to global monitor the effect of HCMV on ECV304 gene expression profiling using 60-mer high-density oligo microarra. ECV304 was reported first in 1990 as a spontaneously - transformed and immortalized cell line, which derived from a Japanese HUVEC20. It is a permanent endothelial cell line and has been used widely as an endothelial cell model and a useful research tool in biomedicine and pharmacology. The result showed that there were 559 differential expressed genes. 471 genes were found to be expressed up-regulated, 334 of which had clear functions, while 88 genes were found to be expressed down-regulated, 69 of which had clear functions. These genes which included apoptosis-related genes, G-protein-coupled receptors signal transduction pathway-related genes, c-jun N-terminal kinase and MAPK signaling pathway-related genes, cell cycle-related genes and cancer-related genes. In these biological processes, signal transduction-related genes and DNA-dependent transcriptional regulation-related genes seem to be important in HCMV infection process. These genes were analyzed by microarray showed similar patterns of expression to those determined by real-time RT-PCR, suggesting data reliability from cDNA microarray that settle the base for bio-information analysis and study on the function. A set of genes were identified as differential expression in this study and some of them might be associated with biological process of HCMV pathogenetic. These genes are elucidated as follows.
VEGF gene is a member of the PDGF/VEGF growth factor family and encodes a protein that is often found as a disulfide linked homodimer. This protein is a glycosylated mitogen that specifically acts on endothelial cells and has various effects, including mediating increased vascular permeability, inducing angiogenesis, vasculogenesis and endothelial cell growth, promoting cell migration, and inhibiting apoptosis. In our study, up-regulated VEGF gene might associate with some damage induced by HCMV as its function in cell biological process.
RGS6 (regulator of G-protein signaling 6) and RGS2 (regulator of G-protein signaling 2), which are decode regulators of G protein and have been shown to modulate the functioning of G proteins by activating the intrinsic GTPase activity of the alpha (guanine nucleotide-binding) subunits. Signalling by G proteins is controlled by the regulator of G-protein signalling (RGS) proteins that accelerate the GTPase activity of Galpha subunits and act in a G-protein-coupled receptor (GPCR)-specific manner. Because GPCRs play a crucial role in cellular communication, and chemokine receptors are essential for leukocyte trafficking in particular. The virus-encoded GPCRs (vGPCRs) may be crucial determinants of viral pathogenesis21. Expression of vGPCRs may play a prominent role in immune evasion, promoting virus dissemination, or modulating cellular responses of infected cells. Within the HCMV genome, four genes encoding GPCRs have previously been identified (US27, US28, UL33, and UL78)22. On the basis of sequence alignments, it has been identified that HCMV may effectively use UL33 to orchestrate multiple signaling networks within infected cells.
TNFSF9 (Tumor necrosis factor (ligand) superfamily, member 9) and TNFSF10 (Tumor necrosis factor (ligand) superfamily, member 10), which encode the protein, are cytokines that belong to the tumor necrosis factor (TNF) ligand family. This cytokine encoded by TNFSF9 is a ligand for TNFRSF9/4-1BB, which is a costimulatory molecule in T lymphocytes. This cytokine and its receptor are involved in the antigen presentation process, and in the generation of cytotoxic T cells. It is found to express in various cancer cell lines, involve in T cell-tumor cell interaction, and also be required for the optimal CD8 responses in CD8 T cells. This protein decoded by TNFSF10 preferentially induces apoptosis in transformed and tumor cells, but does not appear to kill normal cells although it is expressed at a significant level in most normal tissues. This protein binds to several members of TNF receptor superfamily including TNFRSF10A/TRAILR1, NFRSF10B/TRAILR2, TNFRSF10C /TRAILR3, TNFRSF10D /TRAILR4, and possibly also to TNFRSF11B/OPG. The activity of this protein may be modulated by binding to the decoy receptors TNFRSF10C/TRAILR3, TNFRSF10D/TRAILR4, and TNFRSF11B/OPG that cannot induce apoptosis. The binding of this protein to its receptors has been shown to trigger the activation of MAPK8/JNK, caspase 8, and caspase 3. Our study showed the two genes were regulated by HCMV.
It was found that the biological process, such as S phase of mitotic cell cycle, was significant in HCMV infection. DEAD box proteins, characterized by the conserved motif Asp-Glu-Ala-Asp (DEAD), are putative RNA helicases. They are implicated in a number of cellular processes involving alteration of RNA secondary structure such as translation initiation, nuclear and mitochondrial splicing, and ribosome and spliceosome assembly. The protein decoded by DDX11 gene is most important component in regulation of mitotic cell cycle. DDX11 is a homolog of the yeast CHL1 gene, and may function to maintain chromosome transmission fidelity and genome stability. Based on their distribution patterns, some members of this family are believed to be involved in embryogenesis, spermatogenesis, and cellular growth and division23. In our previous study, the change of S phase effected by the HCMV infection in ECV304 cells at four days post-infection was demonstrated. HCMV productively infect terminally differentiated cells of the host that are in the G0 phase of the cell cycle. Human foreskin fibroblast (HFF) cells are widely used for permissive HCMV infection in tissue culture. These cells withdraw from the cell cycle on contact inhibition and are in G0 arrest or G1 phase. Because HCMV do not encode many of the biosynthetic enzymes for DNA precursor synthesis, the virus requires a mechanism to overcome cellular quiescence. HCMV infection induces the progression of quiescent cells toward the G1_S transition point and activates cellular genes required for DNA replication such as thymidine kinase (TK)24, dihydrofolate reductase (DHFR)25, cyclin E26 and DNA polymerase27. Genes that are differentially expressed during infection can potentially provide insights into the complex regulatory phenomena at the transcriptional level within ECV304 cells in response to HCMV infection. Up-regulated genes may represent host responses to stress stimuli and/or viral induced mechanisms of pathogenesis. On the other hand, the down-regulation of other cellular transcripts may be partially attributed to the shutoff of host macromolecular synthesis in favor of viral replication.
MAP2K2 (mitogen-activated protein kinase kinase 2) can encode a protein, which is a dual specificity protein kinase belonging to the MAP kinase kinase family28. This kinase is known to play a critical role in mitogen growth factor signal transduction. Subsequently it phosphorylates and thus activates MAPK1/ERK2 and MAPK2/ERK3. The activation of this kinase itself is dependent on the Ser/Thr phosphorylation by MAP kinase kinase kinases. The inhibition or degradation of this kinase is found to be involved in the pathogenesis of Yersinia and anthrax.
v-CRK avian sarcoma virus CT10-homolog-like (CRKL) contains one SH2 domain and two SH3 domains. CRKL has been shown to activate the RAS and JUN kinase signaling pathways and transform fibroblasts in a RAS-dependent fashion. It is a substrate of the BCR-ABL tyrosine kinase and plays a role in fibroblast transformation by BCR-ABL. In addition, CRKL has oncogenic potential.
MICA gene encodes the higly polymorphic MHC (HLA) class I chain-related gene A. The protein product is expressed on the cell surface, although unlike canonical class I molecules it does not seem to associate with beta-2-microglobulin. It is thought that MICA functions as a stress-induced antigen that is broadly recognized by intestinal epithelial gamma delta T cells. MICB gene encodes a heavily glycosylated protein which is a ligand for the NKG2D type II receptor. Binding of the ligand activates the cytolytic response of natural killer (NK) cells, CD8 alphabeta T cells, and gammadelta T cells which express the receptor. This protein is stress-induced and is similar to MHC class I molecules; however, it does not associate with beta-2-microglobulin or bind peptides. HCMV infection is associated with graft rejection by upregulating expression of MICA and MICB 29. Cyclin E decoded by CCNE1 gene belongs to the highly conserved cyclin family, whose members are characterized by a dramatic periodicity in protein abundance through the cell cycle. Cyclins function as regulators of CDK kinases. Different cyclins exhibit distinct expression and degradation patterns which contribute to the temporal coordination of each mitotic event. This protein accumulates at the G1-S phase boundary and is degraded as cells progress through S phase. Overexpression of this gene has been observed in many tumors, which results in chromosome instability, and thus may contribute to tumorigenesis. Cyclin E/cdk2 kinase activity can be activated by the immediate-early genes, IE1 and IE2, in HCMV infected cells. Transactivation of the cyclin E promoter by IE2 has been reported30, but the mechanism for IE1 activation of cyclin E/cdk2 kinase activity in HCMV-infected cells is still unclear. In this study, our experimental results are in agreement with the results obtained by Vierling et al.
BCL2L10 gene decodes a protein belonging to the BCL-2 protein family. BCL-2 family members form hetero- or homodimers and act as anti- or pro-apoptotic regulators that are involved in a wide variety of cellular activities. The protein encoded by this gene contains conserved BH4, BH1 and BH2 domains. This protein can interact with other members of BCL-2 protein family including BCL2, BCL2L1/BCL-X (L), and BAX. Overexpression of this gene has been shown to suppress cell apoptosis possibly through the prevention of cytochrome C release from the mitochondria, and thus activating caspase-3 activation. The mouse counterpart of this protein is found to interact with Apaf1 and forms a protein complex with Caspase 9, which suggests the involvement of this protein in APAF1 and CASPASE 9 related apoptotic pathway.
Conclusion
Among all biological processes induced by HCMV infection in ECV304 cells, the signal transduction-related genes were the most significant, which contained 21 genes, and those genes involved in various function in different signal transduction pathways. Though the roles of the cellular genes discussed above in HCMV replication and pathogenesis remain highly speculative, the ability to identify cellular genes whose functions provide tantalizing hints of potential mechanistic roles in infectious disease processes underscores the utility of cDNA microarray technology in the study of pathogens. The global analysis of changes in mRNA levels provides a catalog of genes that are modulated as a result of the host-pathogen interaction and therefore deserve further scrutiny. DNA array analysis provides an important new approach for the investigation of pathogenic mechanisms.
Acknowledgements
We thank Prof. WU Guo-jun Institute of Medical Microbiology, Central South University, China for kindly providing HCMV AD169 strain. This study was supported by The Science & Technology Foundation of Guizhou Province (No.[2007]2088).
References
- 1.Numazaki K. Congenital infection and HCMV. Nihon Rinsho. 2006;64 Suppl 3:496–499. [PubMed] [Google Scholar]
- 2.Streblow D N, Orloff S L, Nelson J A. Do pathogens accelerate atherosclerosis? J Nutr. 2001;131(10):2798S–2804S. doi: 10.1093/jn/131.10.2798S. [DOI] [PubMed] [Google Scholar]
- 3.Schottstedt V, Blumel J, Burger R, et al. Human Cytomegalovirus (HCMV) - Revised. Transfus Med Hemother. 2010;37(6):365–375. doi: 10.1159/000322141. [DOI] [PMC free article] [PubMed] [Google Scholar]
- 4.Melnick M, Sedghizadeh PP, Allen CM, et al. Human cytomegalovirus and mucoepidermoid carcinoma of salivary glands: cell-specific localization of active viral and oncogenic signaling proteins is confirmatory of a causal relationship. Exp Mol Pathol. 2012;92(1):118–125. doi: 10.1016/j.yexmp.2011.10.011. [DOI] [PubMed] [Google Scholar]
- 5.Plachter B, Sinzger C, Jahn G. Cell types involved in replication and distribution of human cytomegalovirus. Adv Virus Res. 1996;46:195–261. doi: 10.1016/s0065-3527(08)60073-1. [DOI] [PubMed] [Google Scholar]
- 6.Kahl M, Siegel-Axel D, Stenglein S, et al. Efficient lytic infection of human arterial endothelial cells by human cytomegalovirus strains. J Virol. 2000;74(16):7628–7635. doi: 10.1128/jvi.74.16.7628-7635.2000. [DOI] [PMC free article] [PubMed] [Google Scholar]
- 7.Bissinger AL, Sinzger C, Kaiserling E, et al. Human cytomegalovirus as a direct pathogen: correlation of multiorgan involvement and cell distribution with clinical and pathological findings in a case of congenital inclusion disease. J Med Virol. 2002;67(2):200–206. doi: 10.1002/jmv.2208. [DOI] [PubMed] [Google Scholar]
- 8.Fish KN, Stenglein SG, Ibanez C, et al. Cytomegalovirus persistence in macrophages and endothelial cells. Scand J Infect Dis Supp. 1995;99:34–40. [PubMed] [Google Scholar]
- 9.Jarvis MA, Nelson JA. Human cytomegalovirus persistence and latency in endothelial cells and macrophages. Curr Opin Microbiol. 2002;5(4):403–407. doi: 10.1016/s1369-5274(02)00334-x. [DOI] [PubMed] [Google Scholar]
- 10.Jenner RG, Young RA. Insights into host responses against pathogens from transcriptional profiling. Nat Rev Microbiol. 2005;3(4):281–294. doi: 10.1038/nrmicro1126. [DOI] [PubMed] [Google Scholar]
- 11.Browne E P, Wing B, Coleman D, et al. Altered cellular mRNA levels in human cytomega- lovirus-infected fibroblasts: viral block to the accumulation of antiviral mRNAs. J Virol. 2001;75(24):12319–12330. doi: 10.1128/JVI.75.24.12319-12330.2001. [DOI] [PMC free article] [PubMed] [Google Scholar]
- 12.Simmen KA, Singh J, Luukkonen B G, et al. Global modulation of cellular transcription by human cytomegalovirus is initiated by viral glycoprotein B. Proc Natl Acad Sci U S A. 2001;98(13):7140–7145. doi: 10.1073/pnas.121177598. [DOI] [PMC free article] [PubMed] [Google Scholar]
- 13.Song Y J, Stinski M F. Effect of the human cytomegalovirus IE86 protein on expression of E2F-responsive genes: a DNA microarray analysis. Proc Natl Acad Sci U S A. 2002;99(5):2836–2841. doi: 10.1073/pnas.052010099. [DOI] [PMC free article] [PubMed] [Google Scholar]
- 14.Slobedman B, Stern J L, Cunningham AL, et al. Impact of human cytomegalovirus latent infection on myeloid progenitor cell gene expression. J Virol. 2004;78(8):4054–4062. doi: 10.1128/JVI.78.8.4054-4062.2004. [DOI] [PMC free article] [PubMed] [Google Scholar]
- 15.Nam JH, Hwang KA, Yu C H, et al. Expression of interferon inducible genes following Hantaan virus infection as a mechanism of resistance in A549 cells. Virus Genes. 2003;26(1):31–38. doi: 10.1023/a:1022373904357. [DOI] [PubMed] [Google Scholar]
- 16.Defilippis V, Raggo C, Moses A, et al. Functional genomics in virology and antiviral drug discovery. Trends Biotechnol. 2003;21(10):452–457. doi: 10.1016/S0167-7799(03)00207-5. [DOI] [PMC free article] [PubMed] [Google Scholar]
- 17.Leong W F, Tan H C, Ooi E E, et al. Microarray and real-time RT-PCR analyses of differential human gene expression patterns induced by severe acute respiratory syndrome (SARS) coronavirus infection of Vero cells. Microbes Infect. 2005;7(2):248–259. doi: 10.1016/j.micinf.2004.11.004. [DOI] [PMC free article] [PubMed] [Google Scholar]
- 18.Zhu H, Cong JP, Mamtora G, et al. Cellular gene expression altered by human cytomegalovirus: global monitoring with oligonucleotide arrays. Proc Natl Acad Sci U S A. 1998;95(24):14470–14475. doi: 10.1073/pnas.95.24.14470. [DOI] [PMC free article] [PubMed] [Google Scholar]
- 19.Zhu H, Cong JP, Shenk T. Use of differential display analysis to assess the effect of human cytomegalovirus infection on the accumulation of cellular RNAs: induction of interferon- responsive RNAs. Proc Natl Acad Sci USA. 1997;94(25):13985–13990. doi: 10.1073/pnas.94.25.13985. [DOI] [PMC free article] [PubMed] [Google Scholar]
- 20.Takahashi K, Sawasaki Y, Hata J, et al. Spontaneous transformation and immortalization of human endothelial cells. In Vitro Cell Dev Biol. 1990;26(3 Pt 1):265–274. doi: 10.1007/BF02624456. [DOI] [PubMed] [Google Scholar]
- 21.Casarosa P, Gruijthuijsen YK, Michel D, et al. Constitutive signaling of the human cytomegalovirus-encoded receptor UL33 differs from that of its rat cytomegalovirus homolog R33 by promiscuous activation of G proteins of the Gq, Gi, and Gs classes. J Biol Chem. 2003;278(50):50010–50023. doi: 10.1074/jbc.M306530200. [DOI] [PubMed] [Google Scholar]
- 22.Vischer HF, Leurs R, Smit MJ. HCMV-encoded G-protein-coupled receptors as constitutively active modulators of cellular signaling networks. Trends Pharmacol Sci. 2006;27(1):56–63. doi: 10.1016/j.tips.2005.11.006. [DOI] [PubMed] [Google Scholar]
- 23.Vasa-Nicotera M, Brouilette S, Mangino M, et al. Mapping of a major locus that determines telomere length in humans. Am J Hum Genet. 2005;76(1):147–151. doi: 10.1086/426734. [DOI] [PMC free article] [PubMed] [Google Scholar]
- 24.Colberg-Poley A M, Santomenna LD. Selective induction of chromosomal gene expression by human cytomegalovirus. Virology. 1988;166(1):217–228. doi: 10.1016/0042-6822(88)90163-8. [DOI] [PubMed] [Google Scholar]
- 25.Wade M, Kowalik TF, Mudryj M, et al. E2F mediates dihydrofolate reductase promoter activation and multiprotein complex formation in human cytomegalovirus infection. Mol Cell Biol. 1992;12(10):4364–4374. doi: 10.1128/mcb.12.10.4364. [DOI] [PMC free article] [PubMed] [Google Scholar]
- 26.Jault FM, Jault JM, Ruchti F, et al. Cytomegalovirus infection induces high levels of cyclins, phosphorylated Rb, and p53, leading to cell cycle arrest. J Virol. 1995;69(11):6697–6704. doi: 10.1128/jvi.69.11.6697-6704.1995. [DOI] [PMC free article] [PubMed] [Google Scholar]
- 27.Albrecht T, Boldogh I, Fons M, et al. Cell-activation responses to cytomegalovirus infection relationship to the phasing of CMV replication and to the induction of cellular damage. Subcell Biochem. 1989;15:157–202. [PubMed] [Google Scholar]
- 28.Nadeau V, Guillemette S, Belanger L F, et al. Map2k1 and Map2k2 genes contribute to the normal development of syncytiotrophoblasts during placentation. Development. 2009;136(8):1363–1374. doi: 10.1242/dev.031872. [DOI] [PubMed] [Google Scholar]
- 29.Donaldson P T, Alexander G J, O'Grady J, et al. Evidence for an immune response to HLA class I antigens in the vanishing-bileduct syndrome after liver transplantation. Lancet. 1987;1(8539):945–951. doi: 10.1016/s0140-6736(87)90293-5. [DOI] [PubMed] [Google Scholar]
- 30.Vierling J M, Fennell R J. Histopathology of early and late human hepatic allograft rejection: evidence of progressive destruction of interlobular bile ducts. Hepatology. 1985;5(6):1076–1082. doi: 10.1002/hep.1840050603. [DOI] [PubMed] [Google Scholar]