

Abstract
Aim
The purpose of the present study is to show the application of the IAEA TRS-430 QA procedures of Eclipse™v7.5 TPS for photon energies. In addition, the trends of the deviations found in the conducted tests were determined.
Background
In the past, the lack of complete TPS QA procedures led to some serious accidents. So, QA in the radiotherapy treatment planning process is essential for determination of accuracy in the radiotherapy process and avoidance of treatment errors.
Materials and methods
The calculations of TPS and measurements of irradiations of the treatment device were compared in the study. As a result, the local dose deviation values (δ1: central beam axis, δ2: penumbra and build up region, δ3: inside field, δ4: outside beam edges, δ50–90: beam fringe, RW50: radiological width) and their confidence limit values (including systematic and random errors) were obtained.
Results
The confidence limit values of δ4 were detected to increase with expanding field size. The values of δ1 and δ3 of hard wedge were larger than open fields. The values of δ2 and δ50–90 of the inhomogeneity effect test were larger, especially than other tests of this study. The average deviation was showed to increase with the rise of the wedge angle. The values of δ3 and δ4 of lung irradiation were outside tolerance.
Conclusions
The QA of TPS was done and it was found that there were no reservations in its use in patient treatment. The trend of the deviations is shown.
Keywords: Treatment planning system, Quality assurance, Local dose deviation, Confidence limit, Photon beam
1. Background
In recent years, complexity of TPS has increased significantly and this has led to the requirement for a comprehensive quality assurance (QA) guidelines. Increased attention has been paid to quality assurance of treatment planning systems by many researchers,2,3,6 several national and international organizations.1,4,5,7
In the past, the lack of complete TPS QA procedures led to some serious accidents. So, QA in the radiotherapy treatment planning process is essential for determination of accuracy in the radiotherapy process and avoidance of treatment errors.1
1.1. QA guidelines
A number of task groups1,5,8 over the past several years have developed guidelines and protocols for systematic QA of 3D radiotherapy treatment planning systems (TPSs), including specific QA aspects of a TPS, such as anatomical description, beam description, dose calculations, and data output and transfer. Many studies have been performed to address specific problems associated with treatment planning and dose calculation procedures.9–12 Some studies13–16 were related to the performance of a specific TPS.
The general requirements of QA of TPS in radiotherapy have already been discussed in the literature.1–3 Some reports1–4 have been published to help physicists in the implementation of a comprehensive QA program. Comprehensive report of IAEA for QA is called TRS-430 report.1
TRS-430 report1 includes four steps of QA program; acceptance tests, commissioning, periodic QA program and patient specific QA. The acceptance test is applied to verify functionality and quantity agreement with the specification report attached by manufacturer. The commissioning consists of two different processes. One includes dosimetric study to verify the performance of the dose calculation generated by the TPS. The others are non-dosimetric verifications to verify the functionality of the tools of TPS. Periodic QA program is implemented to verify reproducibility of planning in accordance with that established at commissioning. Patient specific QA is performed to verify the treatment process as a whole.
1.2. Criteria of acceptability
AAPM TG 53 report5 and several researchers2,17,18 have defined different criteria of acceptability of various regions that can be defined in terms of dose and dose gradient in a photon beam, as shown in Fig. 1. Venselaar et al.17 has defined a set of criteria of acceptability based on different tolerances for δ (local dose deviation) based on the knowledge that dose calculation algorithms provide a better accuracy in the high dose and small dose gradient region of the beam than in others. These reports2,5,17 have proposed different tolerances for the various regions in a photon beam, as given in Table 1.
Fig. 1.
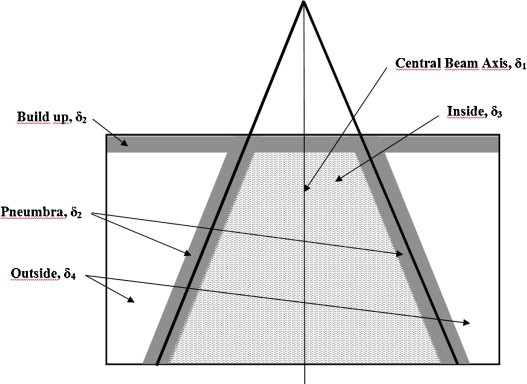
Definition of different regions in a radiation beam, based on the magnitude of the dose and dose gradient (adapted from Ref.8).
Table 1.
The local dose deviations of different dose regions in photon beam.
| Local dose deviation | Region definition | Dose magnitude and dose gradient |
|---|---|---|
| δ1 | ○ PDDs: for data points on the CAX beyond the depth of dmax | ○ High dose ○ Small dose gradient |
| δ2 | ○ PDDs: for data points in the build-up region ○ Profiles: for data points in the penumbra, and in regions close to interfaces of inhomogeneities regions |
○ High dose ○ Large dose gradient |
| δ3 | ○ Profiles: for data points beyond dmax, within the beam but outside the CAX | ○ High dose ○ Small dose gradient |
| δ4 | ○ Profiles: for data points off the geometrical beam edges and below shielding blocks, generally beyond dmax | ○ Low dose ○ Small dose gradient |
| RW50 | ○ Profiles: The radiological width, defined as the width of a profile measured at half its height compared to the value at the beam axis | – |
| δ50–90 | ○ Profiles: The distance between the 50% and the 90% point (relative to the maximum of the profile) in the penumbra | – |
Deviations between results of calculations and measurements can be expressed as a percentage deviation of the local dose according to Venselaar et al.17
| (1) |
where Dcal and Dmeas are calculated dose at particular point in the phantom and measured dose at the same point in the phantom, respectively. In low dose regions where the points were outside the penumbra or under a block, an alternative comparison was made accordingly to Venselaar et al.17
| (2) |
where Dmeas,cax is dose measured at a point at the same depth on the central axis of the open beam. If a study consisting of many points is evaluated, some statistical assessment can be performed on the calculation points and the measurement points. Accordingly, confidence limit, Δ, is as follows:
| (3) |
where SD is the standard deviation.17,18 In Eq. (3), the factor 1.5 is chosen rather arbitrarily, but it was useful for this purpose in clinical practice.18,19 If a factor greater than 1.5 was used in Eq. (3), this would emphasize the random errors, while a factor smaller than 1.5 would increase the relative importance of systematic deviations.
The tolerances of δ as defined in Table 4 can be applied to the confidence limit. At photon beam dose calculation, the three different levels of complexity of geometry are given in Table 2.
Table 4.
According to complexity of geometry, proposed values of the tolerance for percentage deviation of dose at different local.
| Tolerance | Simple geometry | Complex geometry | More complex geometry |
|---|---|---|---|
|
δ1 (central beam axis) High dose, small dose gradient |
% 2 | % 3 | % 4 |
|
δ2 (buildup region of central axis and penumbra region of profiles) High dose, large dose gradient |
2 mm or % 10 | 3 mm or % 15 | 3 mm or % 15 |
|
δ3 (outside central beam axis region) High dose, small dose gradient |
% 3 | % 3 | % 4 |
|
δ4 (outside beam edges) Low dose, small dose gradient |
% 3 | % 4 | % 5 |
| RW50 (radiological width) | 2 mm or % 1 | 2 mm or % 1 | 2 mm or % 1 |
| δ50–90 (beam fringe) | 2 mm | 3 mm | 3 mm |
Table 2.
The different levels for complexity of geometry for photon beam dose calculation.
| Geometry | Definition |
|
|---|---|---|
| Phantom | Beam arrangement | |
| Simple geometry | Homogeneous phantoms | ○ Rectangular field size ○ Variation of SSD ○ Oblique incidence |
| Complex geometry | Non-homogeneous phantoms | ○ Fields with wedge ○ Irregular field ○ Asymmetric collimator settings ○ Missing tissue |
| More complex geometries | Non-homogeneous phantoms | ○ Combinations of complex geometry |
The evaluation of absolute and relative dose tests was used in percent difference between the result of TPS MU calculation and the result of independent MU calculation. According to the TRS-430 report,1 criteria of acceptability recommend that percent difference must be ≤2% for using no accessories, no beam modifiers and no inhomogeneity. Otherwise, difference must be ≤3%.
In case the TPS fails to meet these accuracy requirements, the NCS report7 suggests the following:
-
(i)
Check the basic beam data entered in the TPS and the test beam data set.
-
(ii)
Adjust the model parameters.
-
(iii)
Restrict the clinical use of the TPS to geometries that passed the test.
-
(iv)
Inform the vendor about the findings.
1.3. QA procedure in TPS
A number of authors20–23 have implemented dosimetric and non-dosimetric tests of QA procedure into TPS with the guidance of the IAEA TRS 430 report. These authors have reported that the most critical difference occurred for oblique incidence, oblique incidence-off axis, shaped fields and off axis-wedged.
Some reports24–26 have demonstrated differences of algorithms for various special regions.
2. Aim
The purpose of the present study is to show the application of the IAEA TRS-430 QA procedures of Eclipse™v7.5 TPS for photon energies by using a dosimetric measurement system. As a result of calculations and measurements from test plans, local dose deviation values were obtained as δ1 (central beam axis), δ2 (penumbra and build up region), δ3 (inside field) and δ4 (outside beam edges), δ50–90 (beam fringe), RW50 (radiological width) and their confidence limit values (including systematic and random errors). In addition, the trends of the deviations found in the conducted tests were determined.
3. Materials and methods
The commissioning procedure of the IAEA TRS-430 for clinical photon beams was implemented for pencil-beam convolution algorithm of Eclipse™v7.5 (Varian Medical Systems, Palo Alto, CA, USA) TPS that was installed to beam data of Clinac DHX (2300 CD) linear accelerator (Varian Medical Systems, Palo Alto, CA, USA). Clinac DHX linear accelerator generates 6 MV and 18 MV photon energy beams (quality index: TPR20/10, TPR20/10 = 0.6646 for 6 MV and TPR20/10 = 0.7871 for 18 MV). After the assembly of Clinac DHX linear accelerator, acceptance tests were implemented and performed to verify it within recommended specific tolerance. For beam data for TPS, measurements were carried out by the RFA-300 3D radiation field analysis system (Wellhöfer Dosimerie GmbH, Schwarzenbruck, Germany) controlled by OmniPro-Accept v6.5 software and silicon semiconductor diode detectors (Wellhöfer Dosimerie GmbH, Schwarzenbruck, Germany).
In this commissioning procedure, results of the calculation of the plan at the TPS and were compared with those of the measurement taken from the treatment device in this study. A TPS calculation grid size of 5 mm was preferred for all tests because of clinically relevant general use. As a result of the comparison of test plans, local dose deviation values were obtained as δ1, δ2, δ3, δ4, δ50–90 and RW50 and confidence limit values calculated. In addition, the trends of the deviations found in the conducted tests were determined.
3.1. Commissioning of TPS
The photon beam commissioning tests, operational tests, absolute and relative dose tests, overall clinical tests are all detailed in Table 3.
Table 3.
Details of dosimetric tests performed on TPS in the present study.
| Test type | Test | Test geometry | Detail |
||||
|---|---|---|---|---|---|---|---|
| Energy (MV) | Field size (cm × cm) | Depth (cm) | Measurement systems | Note | |||
| Photon beam commissioning | 1 | Square fields | 6, 18 | 3 × 3, 5 × 5, 10 × 10, 35 × 35 | dmax, 5, 10, 20 | WP, PFD3G | |
| 2 | Rectangular fields | 6, 18 | 5 × 35, 35 × 5 | ||||
| 3 | Asymmetric fields | 6, 18 | X1 = 2, X2 = 8, Y1 = 3, Y2 = 7, X1 = 5, X2 = 5, Y1 = 0, Y2 = 10 | ||||
| 4 | Shaped fields | 6, 18 | Cord and corner block convex and concave aperture | ||||
| 5 | Source to surface distance depence | 6, 18 | 10 × 10 | SSD: 90 cm, 100 cm, 110 cm | |||
| 6 | Hard wedge | 6, 18 | 5 × 5, 10 × 10, 20 × 30 (only15 × 30 for 600 W) | 15°, 30°, 45°, 60° Ws | |||
| 7 | Dynamic wedge | 6, 18 | 5 × 5, 10 × 10, 10 × 20 | 10 | WP, FC23-C, EDR2 | 15°, 45° EDWs | |
| 8 | Oblique incidence | 6, 18 | 10 × 10 | dmax, 5, 10 | WP, PFD3G | Gantry angle: 330° | |
| 9 | Missing scatter | 6, 18 | 20 × 20 | 15 | SP34, FC23-C | ||
| 10 | Buildup behavior | 6, 18 | 5 × 5, 10 × 10, 20 × 20 | 0.2 − dmax | SP34, PPC05 | ||
| 11 | Density correction | 6, 18 | 15 × 10 | 5.5 | SP34-RP, FC23-C, EBT2 | With created special phantom | |
| Operational tests | 12 | Algorithm choice | TPS has single algortihm licence. So test wasn’t performed | ||||
| 13 | Inhomogeneity corrections | 6, 18 | It was used fields of Test 27.a | a. Modified Batho, b. B. Batho power Law, c. Equivalent TAR |
|||
| 14 | Calculation validity | 6, 18 | It was used fields of Test 25.b | ||||
| 15 | Calculation grid | 6, 18 | 10 × 10 | 0 − dmax | Calc. grid = 1.25, 2.5, 10 mm | ||
| Absolute and relative dose tests | 16 | Open fields | 6, 18 | 5 × 5, 10 × 10, 30 × 30 | Isocentre | Box technique, different beam weights | |
| 17 | Tangential Fields | 6, 18 | 10 × 10, 20 × 20 | Tangential technique, MLC | |||
| 18 | Wedged fields | 6, 18 | 5 × 5, 10 × 20, 20 × 20 | Lateral fields + AP field, different beam weights | |||
| 19 | MLC shaped fields | 6, 18 | It was added MLC to fields of Test 16 | Box technique, different beam weights | |||
| 20 | Inhomogeneity corrections | 6, 18 | It was used fields of Test 27.a-b | Modified Batho, same beam weights | |||
| 21 | Off-axis calculations | 6, 18 | 20 × 20 | AP and PA fields, also 30° W | |||
| Overall clinical tests | 22 | Open field | 6, 18 | 5 × 5, 10 × 10, 20 × 20 | Isocentre | SP34, FC65-G | Box technique, different beam weights |
| 23 | Blocking field | 6, 18 | It was added MLC to fields of Test 22 | ||||
| 24 | Wedged field | 6, 18 | 10 × 10, 20 × 20 | 15°, 30° Ws and AP- PA fields | |||
| 25 | CT planning for cranium irradiation | 6 | a. Lateral fields b. Lateral + vertex fields |
RP, TLD-100 | Clinically, the most accordance with MLC, beam weight, dose prescription and accessory was selected | ||
| 26 | CT planning for Head and Neck irradiation | 6 | a. Lateral fields b. Five field techniquesa |
||||
| 27 | CT planning for Lung irradiation | 18 | a. AP and PA fields b. Box technique |
||||
Ref., reference; MLC, multileaf colimator; W, wedge; EDW, enhanced dynamic wedge; CT, computed tomography; AP, anterior–posterior; PA, posterior–anterior; WP, water phantom; SP34, solid water phantom; RP, RANDO® phantom; PFD3G, photon field diode; FC65-G, 0.65 cm3 FC65-G ion chamber; FC23-C, 0.23 cm3 FC23-C ion chamber; PPC05, PPC05 type parallel plane ion chamber; EDR2, EDR2 film; EBT2, gafchromic EBT2 film; TLD, thermoluminescent dosimeter.
Adapted from Ref. 28.
3.1.1. Machine capabilities and beam tests
In this process, there are non-dosimetric tests that are involved in the machine or beam definition and use. These tests are performed to check and document the description, limitations, settings and display etc. of the machine.
3.1.2. Photon beam commissioning tests
These tests aim to compare the measurement dose and the calculated dose by TPS. The central axis percentage depth dose and beam profile measurements were made by using the RFA-300 3D radiation field analysis system controlled by OmniPro-Accept v6.5 software. The absolute dose measurements were performed with 0.65 cm3 FC65-G, 0.23 cm3 FC23-C farmer type ion chambers and PPC05 parallel plane chamber connected to DOSE1 electrometer. The film dosimetry measurements were implemented with EBT2, EDR2 films (Gafchromic EBT2, International Speciality Products, Wayne, NJ; EDR2 films, Eastman Kodak120 Company, Rochester, NY) and a digitizer (VIDAR Dosimetry PRO Advantage, Vidar Systems Corporation, Hendon, VA).
The performance of TPS was investigated the difference between calculated and measured dose values as a percentage of the dose measured locally. So, local dose deviation values were obtained as δ1, δ2, δ3, δ4, δ50–90 and RW50 and confidence limit values calculated. Confidence limit values were evaluated according to Table 4.
3.1.3. Operational tests
Operational tests aim to confirm that the function of TPS is performed whenever a various operational issues related to dose calculations, such as grid size, algorithm choice, inhomogenity correction, etc., are changed.
3.1.4. Absolute and relative dose tests
These tests are intended to confirm the accuracy of the basic monitor unit (MU) calculation method for different fields, accessories and media. At this stage, compared are the results of TPS MU calculation and the results of independent MU calculation. Measured beam data of Varian Clinac DHX for independent MU calculation are used. According to the TRS-430 report,1 the criteria of acceptability recommend that a percent difference must be ≤2% for using no accessories, no beam modifiers and no inhomogeneity. Otherwise, the difference must be ≤3%.
3.2. Overall clinical tests
Overall clinical tests are aimed to confirm that the absolute dose delivered is in the expected tolerance range after a specific clinic plan is prepared through a total planning process. The absolute dose measurements were performed with 0.65 cm3 FC65-G connected to DOSE1 electrometer, calibrated TLD at SP34 solid water phantom (including RW3 material) and RANDO® Phantom (the Phantom Laboratory, Salem, New York, USA). All measurements were performed 3 times. Position of all measurement points is given in Fig. 2. Confidence limit values were evaluated according to Table 4.
Fig. 2.
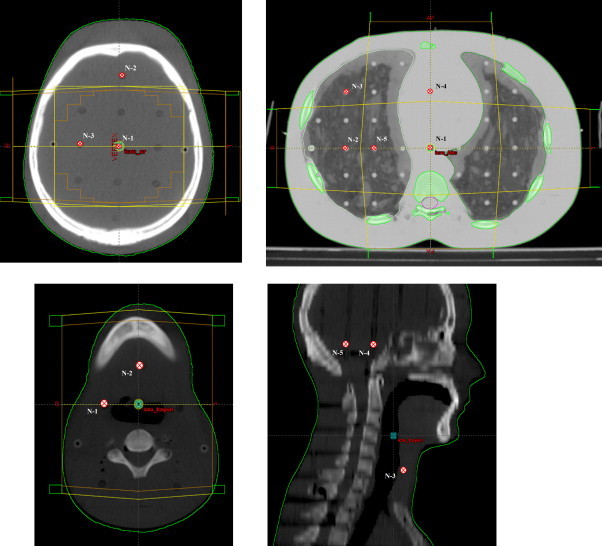
Positions of all measurement points at overall clinical tests.
4. Results
Although many conditions of field size or measurement depth in each test are given in Table 3, Table 5 only shows results of one parameter. These are confidence limit values (calculated with Eq. (3) with results of all field sizes and all measurement depths in each test.
Table 5.
Results of photon beam commissioning performed on TPS.
| Test number | Test geometry | Energy (MV) | Number of pointsa | Confidence limit |
||||||
|---|---|---|---|---|---|---|---|---|---|---|
| %DD |
Profile |
|||||||||
| δ1 (%) | δ2 (mm) | δ2 (mm) | δ3 (%) | δ4 (%) | δ50–90(mm) | RW50 (mm) | ||||
| 1 | Square fields | 6 | SaP | 1.00 | 1.03 | 1.65 | 0.90 | 5.30 [f↑, d↓] | 1.78 | 2.38 [f↑] |
| 18 | SaP | 0.90 | 1.20 | 1.70 | 1.27 | 4.96 [f↑, d↓] | 1.10 | 2.89 [f↑] | ||
| 2 | Rectangular fields | 6 | SaP | 0.79 | 1.27 | 1.00 | 0.97 | 3.28 [f↑, d↓] | 1.53 | 0.78 [f↑] |
| 18 | SaP | 1.26 | 2.25 | 1.27 | 1.65 | 3.73 [f↑, d↓] | 0.99 | 1.63 [f↑] | ||
| 3 | Asymmetric fields | 6 | SaP | 1.42 | 1.48 | 1.37 | 0.72 | 3.05 [f↑, d↓] | 1.63 | 1.41 [f↑] |
| 18 | SaP | 1.17 | 1.53 | 1.06 | 1.90 | 3.10 [f↑, d↓] | 1.72 | 1.32 [f↑] | ||
| 4 | Shaped fields | 6 | SaP | 2.07 [b↑] | 1.68 | 1.64 (5.85) | 0.71 | 5.70 [f↑, d↓] | 2.36 | 1.73 [f↑] |
| 18 | SaP | 2.40 [b↑] | 2.54 | 1.73 (5.25) | 1.37 | 5.51 [f↑, d↓] | 1.35 | 2.56 [f↑] | ||
| 5 | Distance depence | 6 | SaP | 1.40 [ssd↓] | 1.68 [ssd↓] | 1.47 | 0.68 | 3.10 | 1.41 | 1.30 |
| 18 | SaP | 1.62 [ssd↓] | 1.97 [ssd↓] | 1.33 | 1.39 | 2.82 | 1.45 | 1.25 | ||
| 6 | Hard wedge | 6 | SaP | 1.33 | 2.74 [f↑] | 1.36 | 1.13 | 4.74 [f↑, d↓, w↑] | 1.74 | 0.65 [f↑] |
| 18 | SaP | 1.22 | 3.69 [f↑] | 1.30 | 1.10 | 4.54 [f↑, d↓, w↑] | 1.32 | 0.91 [f↑] | ||
| 7 | Dynamic wedge | 6 | SaP | – | – | 2.30 | 1.90 | 3.73 [f↑,w↑] | 1.90 | 1.62 |
| 18 | SaP | – | – | 1.89 | 1.56 | 4.1 [f↑,w↑] | 2.11 | 1.92 | ||
| 8 | Oblique incidence | 6 | SaP | 0.70 | 4.00 | 1.10 | 0.85 | 3.66 [d↓] | 0.63 | 0.55 |
| 18 | SaP | 1.00 | 3.45 | 0.83 | 1.06 | 2.48 [d↓] | 1.13 | 0.30 | ||
| 9 | Missing scatter | 6 | 15 | – | – | – | 1.17 | – | – | – |
| 18 | 15 | – | – | – | 2.28 | – | – | – | ||
| 10 | Build-up region (without 0.2 cm) |
6 | 18 | – | % 0.60–7.40 [d↓] | – | – | – | – | – |
| 18 | 27 | – | % 0.20–53.95 [d↓] | – | – | – | – | – | ||
| 11 | Inhomogeneity effect | 6 | SaP | – | – | 2.62 | 4.83 | 3.61 | 1.75 | 1.25 |
| 18 | SaP | – | – | 3.82 | 2.70 | 5.11 | 2.00 | 1.00 | ||
The trends of deviations depending on depth, field size, shaped field, source to surface distance, wedge angle are denoted by [d↑↓], [f↑↓], [b↑↓], [ssd↑↓], [w↑↓], respectively. For example; it has been denoted that, when the depth is increased, the increasing of dose deviation is showed in the form [d↑], while the reduction of dose deviation is showed in the form [d↓].
The results which are outside the tolerance limits are italicised.
SaP, scanned all point (measurement precision was accepted 0.1 cm, such as obtained point number is 130 for 1D profile measurement of 10 cm × 10 cm field size (%DD and Profile).
4.1. Commissioning of TPS
4.1.1. External beam plans: machine capabilities and beams
At this process, the IAEA TRS 430 checklist was satisfactorily performed to Eclipse™ v7.5 TPS and specifications determined by vendor were provided.
4.1.2. Photon beam commissioning
Results of photon beam commissioning were evaluated separately with respect to each energy and confidence limits of individual measurement type (%DD, profile, point dose) in detail (Table 5).
Results of the square field test were found to be satisfactory. These results were within the tolerance limits. Notably, it was detected that confidence limit values of δ4 increase with expanding field size. The same results were found in the test of rectangular fields.
Results of δ1 and δ3 of the hard wedge were larger than for open fields. These results were within the tolerance limits. Additionally, it was showed that mean deviations of δ2 for %DD increase with expanding field size for each wedge angle. Remarkably, confidence limit values of δ2 were larger than open fields. At the same time, results of the dynamic wedge were within the tolerance limits. It was detected that the δ4 values of the hard wedge and dynamic wedge increase with expanding field size and rising wedge angles (Table 5).
At oblique incidence tests, it was found that δ2 confidence limit values of %DD are outside the tolerances, while the others are within tolerances.
According to missing scatter tests, the results were satisfactory. At investigation of build-up area, it was determined that values of δ2 decrease with expanding depth and field size.
For inhomogeneity effect tests, values of δ3 for low energy were found outside the tolerances because of high SD (Table 5).
4.1.3. Operational tests
Algorithm choice test of operational tests could not be investigated because of the fact that it has a single algorithm licence. It was observed that TPS used inhomogeneity correction effectively. Furthermore, whenever a parameter relevant to the dose calculation is changed, dose calculations are set to be invalid or changing interactively. It was noticed that dose TPS used calculation grid size, this effect being particularly important at large dose gradient area.
4.1.4. Absolute and relative dose tests
Test results were evaluated in terms of percent deviation (mean ± SD) value (Table 6). Many results of investigation were found to be satisfactory. But results of the off-axis points test using asymmetric fields for all photon energies were without the tolerance limits (Table 6).
Table 6.
Results of absolute and relative dose tests performed on TPS.
| Test number | Test geometry | Energy | Deviation (% (mean ± SD)) | Note |
|---|---|---|---|---|
| 1 | Open fields | 6 MV | 0.16 ± 0.4 | 5 cm × 5 cm, 10 cm × 10 cm, 30 cm × 30 cm |
| 18 MV | −0.08 ± 0.7 | |||
| 2 | Tangential fields | 6 MV | 0.53 ± 0.1 1.13 ± 0.0 |
10 cm × 10 cm, 10 cm × 20 cm 10 cm × 20 cm (MLC shielding) |
| 18 MV | 0.77 ± 0.3 2.74 ± 0.0 |
10 cm × 10 cm, 10 cm × 20 cm 10 cm × 20 cm (MLC shielding) |
||
| 3 | Wedge fields | 6 MV | −1.06 ± 1.0 | 5 cm × 5 cm, 10 cm × 20 cm, 20 cm × 20 cm |
| 18 MV | 0.16 ± 1.6 | |||
| 4 | MLC shielding fields | 6 MV | 0.37 ± 0.6 | 5 cm × 5 cm, 10 cm × 10 cm, 30 cm × 30 cm |
| 18 MV | 0.91 ± 0.4 | |||
| 5 | Inhomogenity correction | 6 MV | 0.43 ± 1.3 1.00 ± 1.8 |
2 fields, MLC shielding plan 4 fields, MLC shielding plan |
| 18 MV | 0.19 ± 1.0 1.80 ± 2.1 |
2 fields, MLC shielding plan 4 fields, MLC shielding plan |
||
| 6 | Off-axis points | 6 MV | −0.10 ± 1.3 3.52 ± 0.4 0.12 ± 1 |
Open fields Asymmetric fields Open fields, 45 wedge fields |
| 18 MV | −0.71 ± 1.4 3.51 ± 0.6 −0.60 ± 0.7 |
Open fields Asymmetric fields 45 wedge fields |
The results which are outside the tolerance limits are italicised.
4.2. Overall clinical tests
Clinical tests were performed on homogenous solid phantom and rando-phantom. Although the results of open field, blocking field tests, were found within the tolerance limits, results of wedged field were outside the tolerance limits, especially for high energy. Significantly, it was showed that average deviations increase with the rise of wedge angle. CT planning for treatment was adapted to the treatment techniques used in the clinic (such as the head and neck five-field technique28). While test results of cranium irradiation were found within the tolerances, values of δ3 and δ4 of lung irradiation were outside the tolerance limits. Reasons for the discrepancy could include the choice of beam quality or the presence of low density tissue. For head and neck irradiation, confidence limits were found in high values because of high SD that is based on setup error in five-field techniques. The region near the spinal cord is sensitive to set up errors because of a high dose gradient. But the resultant high dose gradient of this technique is not near to critical organs as the spinal cord.
5. Discussion
In this study, we commissioned Varian Eclipse™v7.5 TPS in accordance with the procedure of the IAEA TRS-430 for clinical photon beams.
The accuracy of the dosimetric calculation of Eclipse™ TPS v7.5.18 has been implemented and reported in detail by Camargo et al.21 It was reported that the most critical difference occurs for oblique incidence, oblique incidence off axis, shaped fields and off axis wedge. The QA of Eclipse™ TPS v7.3.10 has been reported in detail by Jamema et al.20 According to that report, it was determined that oblique incidence calculation does not show a variation outside the tolerance limits. However, for open and wedged asymmetric fields, variation out of the tolerance was found at several points in the penumbral region.
In this study, it was found that deviations occur for δ2 of %DD for oblique incidence test, δ2 of %DD for hard wedge, δ2 of profiles for dynamic wedge. In addition, the δ4 of profiles (dose outside the field) was determined outside the tolerances for many tests. Especially, the δ4 of shaped field, hard wedge and dynamic wedge increased with expanding field size and rising wedge angles (Table 5).
At tests of hard and dynamic wedge fields, the increased deviation between measurement and calculation can depend on resultant small errors of basic beam data as wedge profiles and wedge transmission factors.
Build-up dose tests were observed to show a large difference for depth from 0.2 cm to dmax. User guideline of Eclipse suggested to change the grid size of calculation. When the 5 mm grid size was changed to the smallest grid size available of 1.25 mm, the variation in the dose calculation in the build-up region was reduced. Hence, it was decided that for patients involving (skin tumors) build-up region dose calculation, smaller grid size should be used.20
In the study of the TRS 430 report1 used by Murugan et al.22, the result yields were declared to find a max. deviation of 2.38% (tolerance: 2%) for all simple tests and 5.94% (tolerance: 5%) for complex tests in the presence of inhomogeneity, beam modifiers or beam modifiers with asymmetric field. In this study, values of δ2 (penumbra) and δ50–90 (beam fringe) of inhomogeneity effect test were larger, especially than other tests.
In the study by Engelsman et al.,24 the differences in beam fringe and penumbra width increased with increasing beam energy. For the Modified Batho algorithm, the comparison results of penumbra values were up to 4.3 mm (penumbra) and 6.3 mm (beam fringe) for the low energy beams (≤8 MV), while these results were up to 8.5 and 10.0 mm for the high energy beams (≥15 MV).
In the study by Healy and Murry,25 it was reported that the Eclipse™ analytical anisotropic algorithm (AAA) generally perform better than the PBC algorithm of Eclipse™, but both algorithms did not meet tolerances for asymmetric wedge fields.
In operational tests of this study, it was found that TPS was used effectively in all functions. Results of absolute and relative dose tests were satisfactory. Only results of the off-axis points test asymmetric fields using for each photon energies were outside the tolerance limits (Table 6). Jamema et al.20 reported that results of tests were satisfactory.
According to the study of Gershkevitsh et al.,26 the pilot study included many hospitals, different TPSs, a variety of algorithms of TPS and several beam qualities. The result yields of the pilot study found a better agreements between calculations and measurements for more advanced algorithms (changes in lateral electron and photon transport are approximately modeled). At the same time, pilot study indicated that larger deviations are observed for higher beam energies.
At overall clinical tests of this study, average deviations were showed to increase with a rising wedge angle. In addition, δ3 and δ4 of lung irradiation were outside the tolerance (Table 7). Engelsman et al.24 reported that deviations of up to 3.5% between calculated and measured values of the dose at the ICRU reference point (δ3) were found. In the report by Engelsman et al.,24 the PBC algorithm with one-dimensional corrections, the modified Batho algorithm and the equivalent path length algorithm were investigated. In the AAPM Report 85,27 it is recommended to use photon beams of energy of 12 MV or less for non-small-cell lung cancer therapy because of loss of electron equilibrium within and adjacent to the lung. Low energy beams should be used for low density tissues. Following this study, lung irradiation of our clinic should use only 6 MV or combinations of 6 and 18 MV.
Table 7.
Results of overall clinical tests performed on TPS.
| Test number | Test geometry | Energy |
δ3 |
δ4 |
Note | ||
|---|---|---|---|---|---|---|---|
| Deviation (% (mean ± SD)) | Confidence limit | Deviation (% (mean ± SD)) | Confidence limit | ||||
| 1 | Open field | 6 MV | 1.13 ± 0.8 | 2.33 | −1.84 ± 0.4 | 2.44 | |
| 18 MV | 0.83 ± 1.2 | 2.63 | −1.98 ± 0.5 | 2.73 | |||
| 2 | Blocking field | 6 MV | 0.85 ± 0.4 | 1.45 | −0.77 ± 0.2 | 1.07 | MLC |
| 18 MV | 0.57 ± 0.4 | 1.17 | −0.92 ± 0.4 | 1.52 | |||
| 3 | Wedged field | 6 MV | 1.39 ± 0.7 2.04 ± 0.2 |
2.44 2.34 |
−3.39 ± 1.6 −3.85 ± 2.7 |
5.79 7.90 |
15° W 45° W |
| 18 MV | 1.54 ± 1.1 3.05 ± 0.9 |
3.19 4.40 |
−3.94 ± 1.7 −4.81 ± 3.1 |
6.49 9.46 |
15° W 45° W |
||
| 4 | CT planning for cranium irradiation | 6 MV | 1.35 ± 1.6 −0.44 ± 0.8 |
3.75 1.64 |
−2.80 ± 0.7 −2.47 ± 0.6 |
3.85 3.37 |
a. Lateral f b. Lateral + vertex f |
| 5 | CT planning for head and neck irradiation | 6 MV | 1.86 ± 1.8 0.40 ± 6.4 |
4.56 1000 |
−2.36 ± 0.5 −6.55 ± 0.4 |
3.11 7.15 |
a. Lateral f. b. Five F. techniquesa |
| 6 | CT planning for lung irradiation | 18 MV | 2.73 ± 2.7 0.67 ± 1.2 |
6.78 2.47 |
−7.75 ± 0.4 −7.13 ± 0.6 |
8.35 8.03 |
a. AP, PA f. b. Box technique |
The results which are outside the tolerance limits are italicised.
Adapted from Ref. 28.
6. Conclusion
At commissioning of Eclipse™ TPS, it has been observed that the conducted test is generally within tolerance and is outside the tolerances in some cases. So, there is no need to follow the recommendations of the NCS report.7 In addition, the trends of the deviations found in the conducted tests were determined. Only the errors found in this study for the parameters used in patient treatment planning have to be considered. This procedure must be performed entirely after the upgrade of TPS.
This study confirmed the correctness of the beam data entered in the TPS during the commissioning. With commissioning tests, it was identified as a baseline data for an ongoing QA program.
Conflict of interest
None declared.
Financial disclosure
Scientific Research Project Fund of Erciyes University (Project Code: TSY-09-1047) (only dosimetric equipment support).
Contributor Information
Yıldıray Özgüven, Email: yildq@hotmail.com.
Kadir Yaray, Email: yaray2000@yahoo.com.
Fadime Alkaya, Email: alkayafadime@hotmail.com.
Birsen Yücel, Email: yucelbirsen@yahoo.com.
Serdar Soyuer, Email: soyuers@erciyes.edu.tr.
References
- 1.IAEA . IAEA; Vienna: 2004. Commissioning and quality assurance of computerized treatment planning systems for radiation treatment of cancer, Technical Reports Series No 430. [Google Scholar]
- 2.Van Dyk J., Barnett R.B., Cygler J.E., Shragge P.C. Commissioning and quality assurance of treatment planning computers. Int J Radiat Oncol Biol Phys. 1993;26:261–273. doi: 10.1016/0360-3016(93)90206-b. [DOI] [PubMed] [Google Scholar]
- 3.Shaw J.E. IPEMB; York: 1996. A guide to commissioning and quality control of treatment planning systems. Report No. 68. [Google Scholar]
- 4.SSRMP . 1997. Swiss Society for Radiobiology and Medical Physics. Report 7: quality control of treatment planning systems for teletherapy. [Google Scholar]
- 5.Fraass B., Doppke K., Hunt M., Kutcher G., Starkschall G., Stern R. American Association of Physicists in Medicine Radiation Therapy Committee Task Group 53: quality assurance for clinical radiotherapy treatment planning. Med Phys. 1998;25:836–1773. doi: 10.1118/1.598373. [DOI] [PubMed] [Google Scholar]
- 6.Mayles W.P.M., Lake R., McKenzie A., Macauly E.M., Morgan H.M., Jordan T.J. IPEMB; York: 1999. Physics aspects of quality control in radiotherapy. IPEM Report No. 81. [Google Scholar]
- 7.NCS . NCS; Delft: 2006. Quality assurance of 3-D treatment planning systems for external photon and electron beams: practical guidelines for initial verification and periodic quality control of radiation therapy treatment planning systems. [Google Scholar]
- 8.Mijnheer B., Olszewska A., Fiorino C., Hartmann G., Knöös T., Rosenwald J.-C. ESTRO; Brussels: 2005. Quality assurance of treatment planning systems. Practical examples for non-IMRT photon beams. [Google Scholar]
- 9.Nisbet A., Beange I., Vollmar H.S., Irvine C., Morgan A., Thwaites D.I. Dosimetric verification of a commercial collapsed cone algorithm in simulated clinical situations. Radiother Oncol. 2004;73:79–88. doi: 10.1016/j.radonc.2004.06.007. [DOI] [PubMed] [Google Scholar]
- 10.Cheng C.W., Das I.J., Tang W., Chang S., Tsai J.S., Ceberg C. Dosimetric comparison of treatment planning systems in irradiation of breast with tangential fields. Int J Radiat Oncol Biol Phys. 1997;38:835–842. doi: 10.1016/s0360-3016(97)00078-3. [DOI] [PubMed] [Google Scholar]
- 11.Davidson S.E., Ibbott G.S., Prado K.L., Dong L., Liao Z., Followill D.S. Accuracy of two heterogeneity dose calculation algorithms for IMRT in treatment plans designed using an anthropomorphic thorax phantom. Med Phys. 2007;34:57–1850. doi: 10.1118/1.2727789. [DOI] [PubMed] [Google Scholar]
- 12.Paelinck L., Reynaert N., Thierens H., De Neve W., De Wagter C. Experimental verification of lung dose with radiochromic film: comparison with Monte Carlo simulations and commercially available treatment planning system. Phys Med Biol. 2005;50:69–2055. doi: 10.1088/0031-9155/50/9/009. [DOI] [PubMed] [Google Scholar]
- 13.Miften M., Wiesmeyer M., Kapur A., Ma C.M. Comparison of RTP dose distributions in heterogeneous phantoms with the BEAM Monte Carlo simulation system. J Appl Clin Med Phys. 2001;2:21–31. doi: 10.1120/jacmp.v2i1.2623. [DOI] [PMC free article] [PubMed] [Google Scholar]
- 14.Van Esch A., Tillikainen L., Pyykkonen J., Tenhunen M., Helminen H., Siljamaki S. Testing of the analytical anisotropic algorithm for photon dose calculation. Med Phys. 2006;33:48–4130. doi: 10.1118/1.2358333. [DOI] [PubMed] [Google Scholar]
- 15.Knöös T., Ceberg C., Weber L., Nilsson P. Dosimetric verification of a pencil beam based treatment planning system. Phys Med Biol. 1994;39:28–1609. doi: 10.1088/0031-9155/39/10/007. [DOI] [PubMed] [Google Scholar]
- 16.Aspradakis M.M., Morrison R.H., Richmond N.D., Steele A. Experimental verification of convolution/superposition photon dose calculations for radiotherapy treatment planning. Phys Med Biol. 2003;48:93–2873. doi: 10.1088/0031-9155/48/17/309. [DOI] [PubMed] [Google Scholar]
- 17.Venselaar J., Welleweerd H., Mijnheer B.J. Tolerances for the accuracy of photon beam dose calculations of treatment planning systems. Radiother Oncol. 2001;60:191–201. doi: 10.1016/s0167-8140(01)00377-2. [DOI] [PubMed] [Google Scholar]
- 18.Welleweerd J., van der Zee W. Dose calculations for asymmetric fields using Plato version 2.01. In: Proceedings of 17th Annual ESTRO Meeting. Radiother Oncol. 1998;48:134. [Google Scholar]
- 19.Venselaar J., Welleweerd H. Application of a test package in an intercomparison of the photon dose calculation performance of treatment planning systems used in a clinical setting. Radiother Oncol. 2001;60:203–213. doi: 10.1016/s0167-8140(01)00304-8. [DOI] [PubMed] [Google Scholar]
- 20.Jamema S.V., Urpeti R.R., Sharma S. Commissioning and comprehensive quality assurance of commercial 3D treatment planning system using IAEA Technical Report Series-430. Australas Phys Eng Sci Med. 2008;31:207–215. doi: 10.1007/BF03179346. [DOI] [PubMed] [Google Scholar]
- 21.Camargo P.L., Rodrigues L.N., Furnari L. Implementation of a quality assurance program for computerized treatment planning systems. Med Phys. 2007;34:36–2827. doi: 10.1118/1.2742779. [DOI] [PubMed] [Google Scholar]
- 22.Murugan A., Valas X.S., Thayalan K., Ramasubramanian V. Dosimetric evaluation of a three-dimensional treatment planning system. J Med Phys. 2011;36:15–21. doi: 10.4103/0971-6203.75467. [DOI] [PMC free article] [PubMed] [Google Scholar]
- 23.Kragl G., Albrich D., Georg D. Radiation therapy with unflattened photon beams: dosimetric accuracy of advanced dose calculation algorithms. Radiother Oncol. 2011;100:417–423. doi: 10.1016/j.radonc.2011.09.001. [DOI] [PubMed] [Google Scholar]
- 24.Engelsman M., Damen E.M., Koken P.W., Van’t Veld A.A., Van Ingen K.M., Mijnheer B.J. Impact of simple tissue inhomogeneity correction algorithms on conformal radiotherapy of lung tumours. Radiother Oncol. 2001;60:299–309. doi: 10.1016/s0167-8140(01)00387-5. [DOI] [PubMed] [Google Scholar]
- 25.Healy B.J., Murry R.L. Testing of a treatment planning system with beam data from IAEA TECDOC 1540. J Med Phys. 2011;36:107–110. doi: 10.4103/0971-6203.79688. [DOI] [PMC free article] [PubMed] [Google Scholar]
- 26.Gershkevitsh E., Schmidt R., Velez G., Miller D., Korf E., Yip F. Dosimetric verification of radiotherapy treatment planning systems: results of IAEA pilot study. Radiother Oncol. 2008;89:338–346. doi: 10.1016/j.radonc.2008.07.007. [DOI] [PubMed] [Google Scholar]
- 27.American Association of Physicists in Medicine . AAPM; College Park, MD: 2004. Report 85: tissue inhomogeneity corrections for megavoltage photon beams, Radiation Therapy Committee Task Group 65. [Google Scholar]
- 28.Fogliata A., Cozzi L., Bieri S., Bernier J. Critical appraisal of a conformal head and neck cancer irradiation avoiding electron beams and field matching. Int J Radiat Oncol Biol Phys. 1999;45:8–1331. doi: 10.1016/s0360-3016(99)00319-3. [DOI] [PubMed] [Google Scholar]