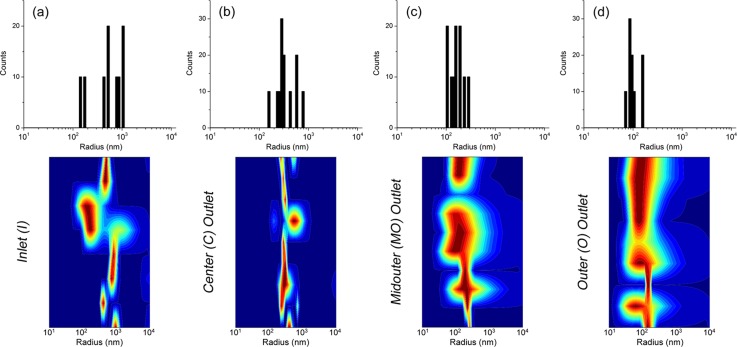
Figure 5.
Size analysis by dynamic light scattering of the sorted hepatic mitochondrial sample. The upper frame shows the histogram size distributions of detected particles and the lower frame shows the heat maps of scattering intensities with respect to particle size (blue = lowest, red = highest, y-axis spans the measurement time). (a) Size distribution of the injected inlet solution. A wide distribution (∼300 nm–2 μm diameters) is observed, qualifying the need for sorting. The smallest particles detected in other fractions are not seen due to their significantly lower scattering intensities. (b) Size distribution of the fraction collected from the C outlet which has the same wide distribution as the inlet since all sample particles flow here. (c) Size distribution of the MO fraction which is shifted towards a smaller particle size range of ∼200 –600 nm. (d) Size distribution of the O fraction showing a further shift towards an even smaller size range of ∼150–350 nm. As observed, the mitochondrial sample was fractionated into three size groups, decreasing from the C to O outlet channels.

