Abstract
Purpose
We tested the hypothesis that pupil apodization is the basis for central pupil bias of spherical refractions in eyes with spherical aberration.
Methods
We employed Fourier computational optics in which we vary spherical aberration levels, pupil size, and pupil apodization (Stiles Crawford Effect) within the pupil function, from which point spread functions and optical transfer functions were computed. Through-focus analysis determined the refractive correction that optimized retinal image quality.
Results
For a large pupil (7 mm), as spherical aberration levels increase, refractions that optimize the visual Strehl ratio mirror refractions that maximize high spatial frequency modulation in the image and both focus a near paraxial region of the pupil. These refractions are not affected by Stiles Crawford Effect apodization. Refractions that optimize low spatial frequency modulation come close to minimizing wavefront RMS, and vary with level of spherical aberration and Stiles Crawford Effect. In the presence of significant levels of spherical aberration (e.g. C40 = 0.4 µm, 7mm pupil), low spatial frequency refractions can induce −0.7D myopic shift compared to high SF refraction, and refractions that maximize image contrast of a 3 cycle per degree square-wave grating can cause −0.75D myopic drift relative to refractions that maximize image sharpness.
Discussion
Because of small depth of focus associated with high spatial frequency stimuli, the large change in dioptric power across the pupil caused by spherical aberration limits the effective aperture contributing to the image of high spatial frequencies. Thus, when imaging high spatial frequencies, spherical aberration effectively induces an annular aperture defining that portion of the pupil contributing to a well-focused image. As spherical focus is manipulated during the refraction procedure, the dimensions of the annular aperture change. Image quality is maximized when the inner radius of the induced annulus falls to zero, thus defining a circular near paraxial region of the pupil that determines refraction outcome.
Keywords: Spherical aberration, apodization, Stiles Crawford Effect, spatial frequency, spherical refraction, refractive error, point spread function, optical transfer function, induced aperture
Introduction
Because human eyes are aberrated, there is no single spherical refracting lens that will correct the refractive error (Rx) at all parts of the pupil simultaneously. With full pupil dilation, human eyes have significant levels of spherical aberration, producing spherical refractions at the pupil margins that can be 2.8 dioptres more myopic than at the pupil centre 1. Koomen 2 and Charman 3 found this myopic drift when refracting through annular pupils of increasing radius. Surprisingly, spherical Rx does not change with increasing circular pupil diameter 2–7 indicating that, at photopic light levels, spherical refractive error is independent of pupil size. It appears therefore, in spite of the fact that most unaccommodated human eyes have positive spherical aberration (SA), the increased power and thus more myopic marginal optics have little or no impact on the full pupil spherical refraction (Rx), which appears to be dominated by the near paraxial optics. Our investigation examines the optical basis for this central pupil bias in spherical refractions.
It has been hypothesized 2–4 that the central pupil bias for light sensitivity, the Stiles Crawford Effect (SCE) 8, 9, is responsible for the central pupil bias in spherical refraction. A second hypothesis argues that, in the presence of SA, optimum image quality for high spatial frequencies is achieved with paraxial focus 3, 10, 11 and subjective refractions are typically determined with high contrast small letters which are dominated by high spatial frequencies. Therefore, a typical subjective refraction, being based upon high spatial frequencies, will be dominated by paraxial optics. Although high spatial frequency refractions achieve a near paraxial focus, a myopic shift is observed in refraction when spatial frequency is reduced 3, 10–12 indicating a more marginal focus. At low light levels, therefore, two significant changes happen: the SCE is absent at scotopic light levels13 and the visual bandwidth is greatly reduced 14. Therefore, both of these hypotheses predict that at scotopic light levels, Rx should shift to myopia as pupil dilates, as was observed by Koomen et al 2. The Koomen 2 scotopic experiment, therefore, fails to distinguish between these two possible explanations for the pupil size independence of subjective spherical Rx at photopic light levels 3. We have, therefore, re-examined the root cause of pupil size independence of Rx in the presence of SA, by separately controlling pupil weighting conditions (normal Stiles Crawford pupil, double Stiles Crawford pupil, uniform pupil, or reverse Stiles Crawford) as well as spatial frequency (low SF or high SF). In this theoretical study, we employ computational Fourier optics 15 to examine this issue.
Methods
Using custom computational programs written in Matlab R2011b (www.mathworks.com), we computed monochromatic (550 nm) wavefront error maps and the images they generate for a model in which both the amplitude and phase of the pupil function are independently controlled 15. The amplitude factor of the pupil function was designed to mirror the effects of the human SCE fit by a Gaussian function exp(σr2), with a sigma (σ) of −0.115 9. We also employed a uniform pupil by setting sigma to zero, a reversed SCE with a sigma value of +0.115, a “doubled” SCE with σ•2 in order to model different pupil weighting conditions. The phase portion of pupil function was derived from the Wave Front Error (WFE) map, which was formed by summing the Zernike polynomials for spherical aberration (Z40) and spherical defocus (Z20). WFE was referenced to the perfect spherical wavefront required to focus an image at the retina, and thus if the Zernike coefficients are set to zero a perfectly focused, diffraction limited image will be generated with a refractive error of zero. Combining these amplitude and phase factors gives the pupil function as:
| (1) |
Spherical refractions are typically determined by varying the power of a spherical refracting lens until the subjective “best focus” is achieved. We simulated this process computationally by systematically varying the Zernike defocus coefficient (C20) in a virtual through-focus experiment. Our wavefront and image analysis employs select levels of primary spherical aberration (Z40) with coefficients C40 varying from −0.7 µm to +0.7 µm for a 7mm pupil diameter. This represents the full range of SA observed in normal human eyes with or without refractive surgery 16–18 and employs the large pupils observed in young adults at low photopic and mesopic light levels 19. Image quality metrics 15 were employed to quantify the impact of spherical defocus and obtain an objective measure of spherical refractive error (Rx). For this paper, we have determined Rx by identifying the target vergence (TV) (or equivalently, correcting lens) that optimizes image modulation at a given SF, minimizes the second-moment width of the point spread function (SM), maximizes the visually weighted Strehl ratio determined from the optical transfer function (VSOTF), and the TV that minimizes WFE RMS (minRMS Rx, C20=0) or flattens the wavefront paraxially. We refer to the latter case as the paraxial Rx, which is achieved by setting . Details of these image quaity metrics are described in Cheng et al 20 and Thibos Hong et al 15.
Results
Part1: Pupil plane description of SA
An issue is why spherical Rx seems so dominated by the paraxial optics in the presence of significant levels of SA. Since some pupil plane metrics have been shown to be accurate predictors of spherical and astigmatic refractions 20, we first examine SA in the pupil plane. Our computational approach defines spherical aberration in terms of wavefront error (in µm) in the pupil plane, but subjective refractions define refractive error in terms of vergence (in dioptres). Therefore, we first examine (Figure 1) the wavefront error and vergence representations of SA.
Figure 1.
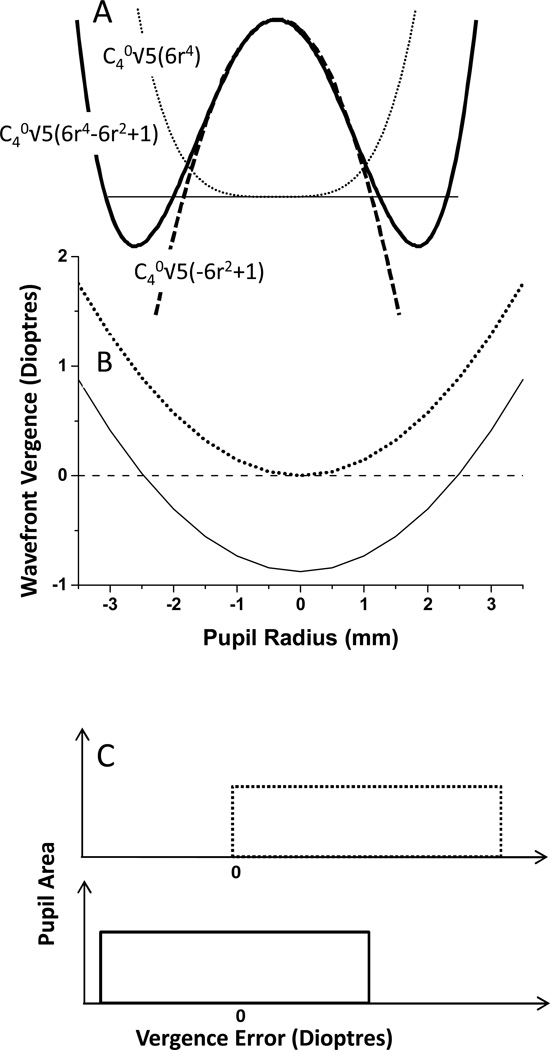
A: WFE profiles through the pupil midline for an optical system with primary spherical aberration with the defocus adjusted to achieve minRMS (solid line) or paraxial focus (dotted line). The dashed line represents the r2 term within Z40 B: Wavefront Vergence profiles for an optical system with primary spherical aberration (C40=0.4µm) across a 7 mm pupil with either minRMS (solid line) or paraxial focus (dotted line). C: Probability density functions of the vergence maps generated with primary SA and either paraxial focus (dotted line) or minRMS (solid line).
Common to all descriptions of primary SA is a wavefront error that varies as the 4th power of pupil radius, in contrast to say spherical defocus that varies as the 2nd power of radius. In the WFE profile (Figure 1A), the solid and dashed lines represent the same level of SA (same amount of r4 terms), but one has a counterbalancing defocus term (−r2) (solid line, which represents the Zernike primary spherical aberration polynomial and is the form of SA that has minimum wavefront RMS). A refraction that achieves minimum RMS in the presence of primary SA, therefore, would generate this wavefront, which is curved in the pupil centre due to the r2 term 21. By adding +Z20 to Z40 (), we can remove the negative r2 term contained within Z40, such that the WFE becomes flat in the pupil centre (dotted line), but has increased WFE RMS. This is the wavefront that would be achieved with a paraxial focus, and we refer to the sphere power required to generate this wavefront as the paraxial Rx. The WFE generated by focusing the wavefront paraxially is equivalent to the Seidel description of primary spherical aberration (a40r4). Several previous studies have shown that, in the presence of SA a minRMS refraction does not provide optimal visual acuity 20, 22–25, and although a paraxial focus may not be ideal 24, it is closer to the optimum than a minRMS refraction21 when SA levels are significant.
By differentiating the wavefront with respect to r, and dividing by r ((dw/dr)/r), wavefront vergence (in dioptres) can be derived from WFE 26. Because our WFE is referenced to the wavefront required to generate perfect focus, wavefront vergence of zero is that required to focus light at the retinal plane. Sample vergence profiles are plotted (Figure 1B) for two wavefronts with equal levels of C40. One is paraxially focused (wavefront vergence = zero on axis), and the other is a wavefront with minimum RMS that is focused at a radial distance of maximum radius. The only difference between these two cases is the Z20 added to achieve paraxial focus, which adds a constant vergence producing two vergence curves that are simply vertically displaced versions of each other. In the minimum RMS case, the vergence at the pupil centre is equal but opposite to the vergence at the pupil margin. The vergence difference between minRMS and paraxial focus is, therefore, half the longitudinal spherical aberrations (LSA). When defined in refractive error terms, the difference between a paraxial and minRMS refraction (ΔRx) is:
| (2) |
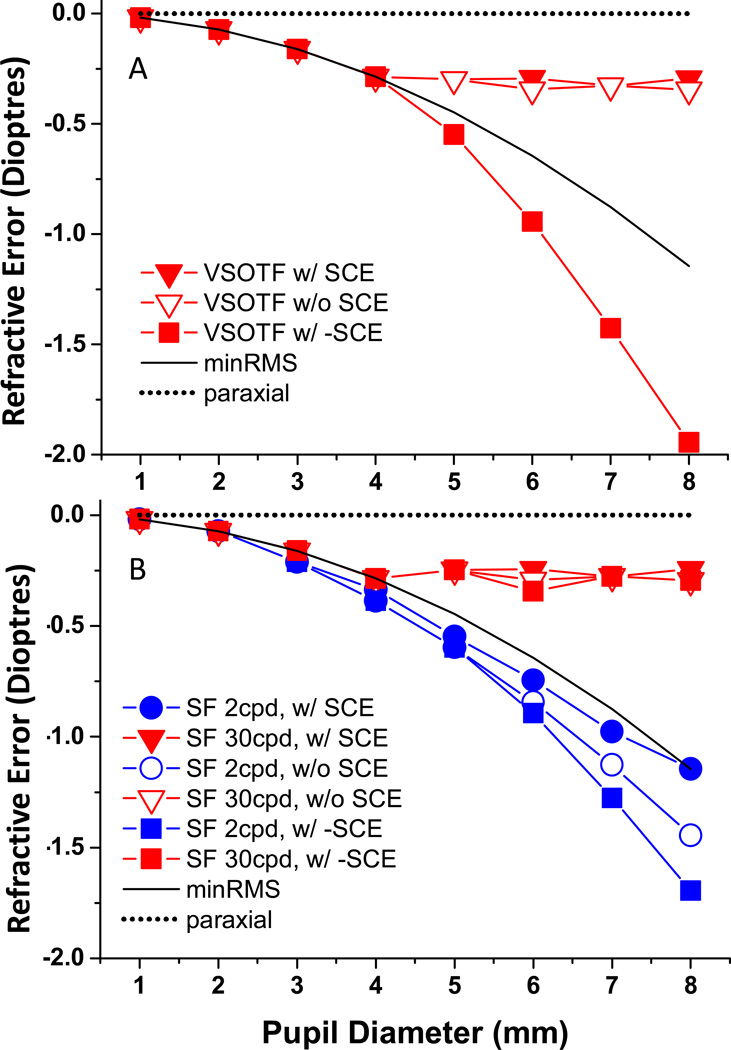
where C40 is in microns and r in mm. Thus, for our model with a pupil diameter of 6mm and C40 = 0.25 µm, the difference between a minRMS Rx and a paraxial Rx is about 0.75D. Therefore, the refractive error difference between minRMS and paraxial will be 6.7, 4.3, 3.0, 2.2, and 1.7 dioptres per micron of C40 for 4, 5, 6, 7, and 8 mm pupil diameters, respectively. Equivalently, although paraxial Rx will not change with pupil size, minRMS Rx will change with the square of pupil diameter (see example in Figure 5), and therefore the pupil size independency of subjective refractions emphasizes that subjective best focus is not achieved by minimizing wavefront RMS24, 25.
Figure 5.
Spherical refractive error (dioptres) is plotted as a function of pupil diameter (mm) with SA level of 0.4 microns for the 7 mm pupil case rescaled for different pupil diameters. Solid black and dotted lines show the minMRS and paraxial refractions, respectively. Rx is plotted for three apodization functions: normal SCE, zero SCE, and reverse SCE for VSOTF (A) and both low SF (2 cpd) and high SF (30 cpd) (B). Zero Rx represents paraxial focus.
From either the WFE or vergence profiles (Fig1A and Fig1B), there appears to be characteristics of the paraxially focused wavefront that would be consistent with high image quality, in that it generates a flat wavefront over a significant portion of pupil radius around the pupil centre. This is not true for the minRMS wavefront, which is curved centrally. Also, in the vergence profiles, the paraxially focused wavefront has wavefront vergence close to zero around the pupil centre, whereas the minRMS wavefront merely passes through zero vergence at one discrete radius (). One can imagine, therefore, based upon these plots that a paraxial or near paraxial (see Figure 10, 21) refraction would provide the greatest probability of achieving a flat wavefront or approximate focus over a significant portion of the pupil, and thus the best image quality. However, these one-dimensional representations of WFE and vergence profile can generate a misleading picture.
Figure 10.
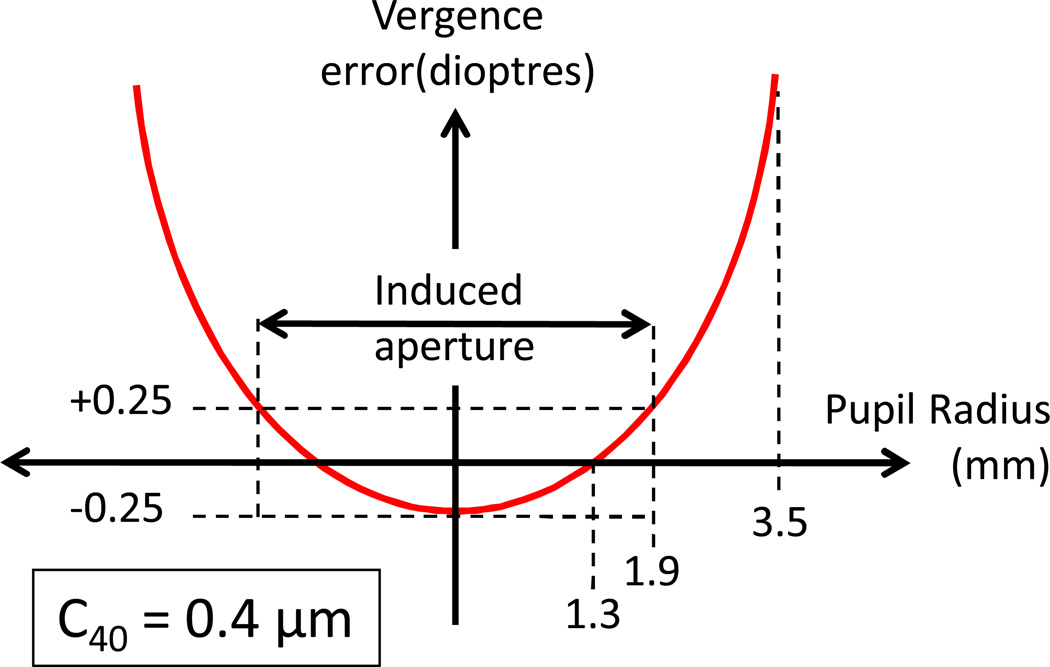
Schematic showing one example of an induced aperture used in the MTF calculations. In this example, RiF = 1.3 mm. In the presence of C40=0.4 µm (across a 7 mm diameter pupil) this radius has a power +0.25D greater than the axial power. Thus, when RiF = 1.3 mm, the axis (r=0) and r=1.9 mm will be defocused by 0.25D. The region between r=0 and r=1.9 mm becomes the effective aperture for this RiF.
When the whole pupil area is considered, and we plot probability density functions of the vergence error maps 26, a unique situation exists for primary SA. The vergence distribution in the presence of primary SA is uniform, thus there is an equal area of the pupil containing each power (Figure 1C). From this figure, we can conclude that any spherical Rx within the range of refraction across the pupil will focus the same amount of light in an eye with primary SA. However, the mean absolute level of defocus will be minimized with a minRMS refraction. That is, when a radial distance of r (max)−0.5 is focused, the average level of absolute defocus for the whole pupil will be minimized (Figure 1C).
Part2: Image plane analysis of impact of primary spherical aberration and SCE
In part 1, we discussed image quality indirectly by examining the fraction of pupil area with a flat wavefront. We now take the direct approach of examining the impact of target vergence on image quality and refraction.
As with subjective refractions, if an eye has +1D excess in power, image focus will be achieved by adding −1D of wavefront vergence. As described in Methods, we ran a virtual through-focus experiment by systematically varying TV in 0.05 dioptre steps. The results of these series (see examples in Figure 2) reveal the predictable sensitivity of IQ metrics to TV 7, 20, 27. We report all Rx values relative to paraxial Rx.
Figure 2.
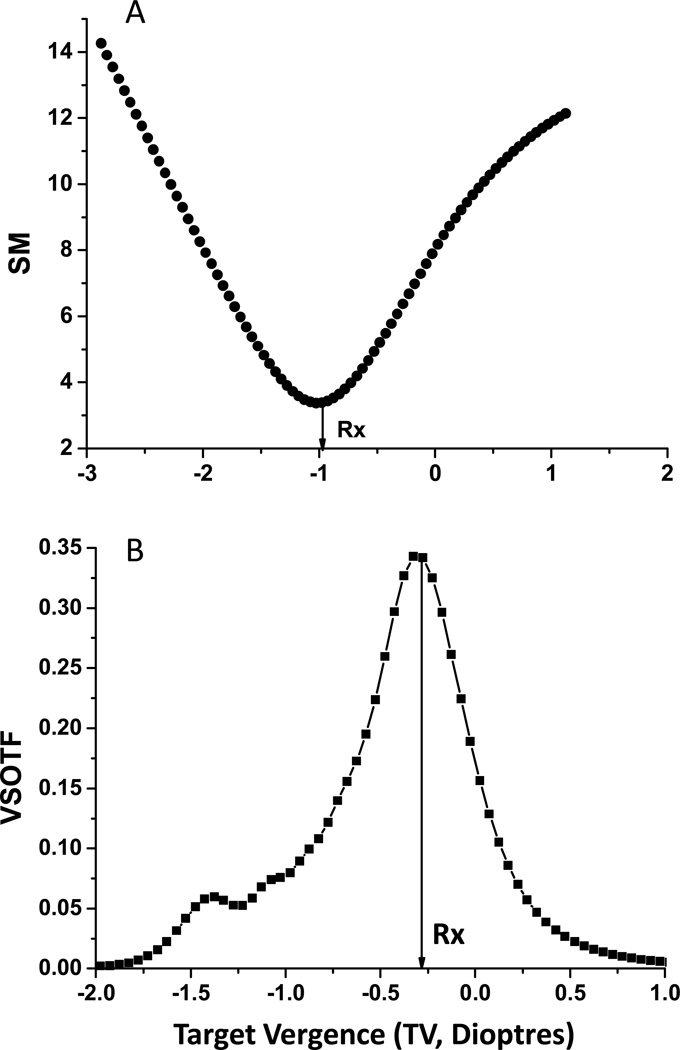
Image quality for two metrics (PSF SM (A), and VSOTF (B)) are plotted as a function of target vergence (dioptres). In both cases, sigma (σ) =−0.115, C40=0.4 µm, and pupil diameter = 7mm. Zero TV represents paraxial focus.
Using the through focus analysis we derive the optimal TV (objective Rx) for each metric (peak or trough of through focus analysis, Figure 2). From Figure 2, we can clearly see that the objective Rx determined for these two different metrics are quite different7. No such Rx difference exists in the absence of SA. In this example with C40 = +0.4 µm, the width of the PSF (SM) is minimized with −1.03D of TV, whereas the visually-weighted Strehl ratio derived from the OTF (VSOTF) is maximized with −0.27D of TV.
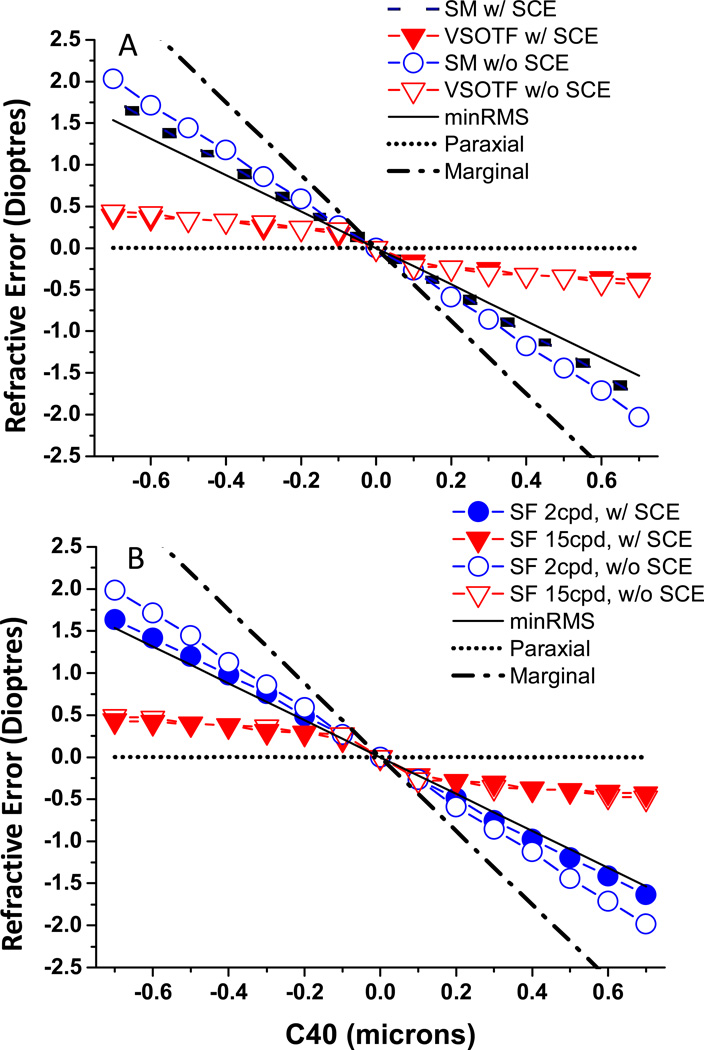
In Figure 3 we show the results of these objective Rx determinations for a range of C40 levels both with and without the SCE included. As predicted by equation 2, minRMS and marginal refractions are linearly related to SA level with slopes of −2.2 and −4.4 dioptres per micron of C40. With positive C40, VSOTF Rx becomes slightly myopic relative to paraxial Rx, and slightly hyperopic in the presence of negative C40. Unlike the small effect of SA on VSOTF Rx, SA has a large impact on SM Rx (Figure 2 and 3A), being more myopic than VSOTF with positive SA and vice versa with negative SA and closely paralleling the minRMS refractions. Pupil apodization had no effect on VSOTF Rx for any value of C40, but the removal of SCE introduced about −0.25D myopic shift in the PSF SM Rx with high levels of positive primary SA. When examining the impact of SA on the MTF, we found that high SF refractions (Fig 3B) are similar to VSOTF refractions, while low SF refractions behave more like SM refractions from Figure 3A. Significantly, adding SCE apodization has no effect on high SF Rx’s but in the presence of high amounts of C40, it shifts low SF Rx closer to marginal refractions. This shift can be as large as 0.5D with high levels of SA.
Figure 3.
shows the relationship between spherical refractive error (Rx in dioptres) and C40 (microns). Pupil diameter is 7mm, and C40 ranged from −0.7µm to 0.7µm. Rx for PSF SM and VSOTF are shown in Figure 3A, and for high (15 cpd) and low (2 cpd) SFs in Figure 3B.
The above results are startling in that they reveal the dramatic impact of choice of image metric on the observed Rx in the presence of SA, while at the same time they reveal the very minor or non-existent role that SCE apodization plays in determining Rx in the presence of SA. The difference between high and low SF Rx can be as high as 1.5D for eyes with high levels of SA (e.g. 0.7 µm with 7mm pupil), and about 0.75 D for an eye with more typical levels of SA C40 (e.g. 0.4 µm). As expected, these differences disappear as SA levels approach zero. These data show that ΔRx (High SF Rx - Low SF Rx) is around 2.5 D/µm without SCE, and this reduced to 2D/µm in the presence of SCE for a 7mm pupil.
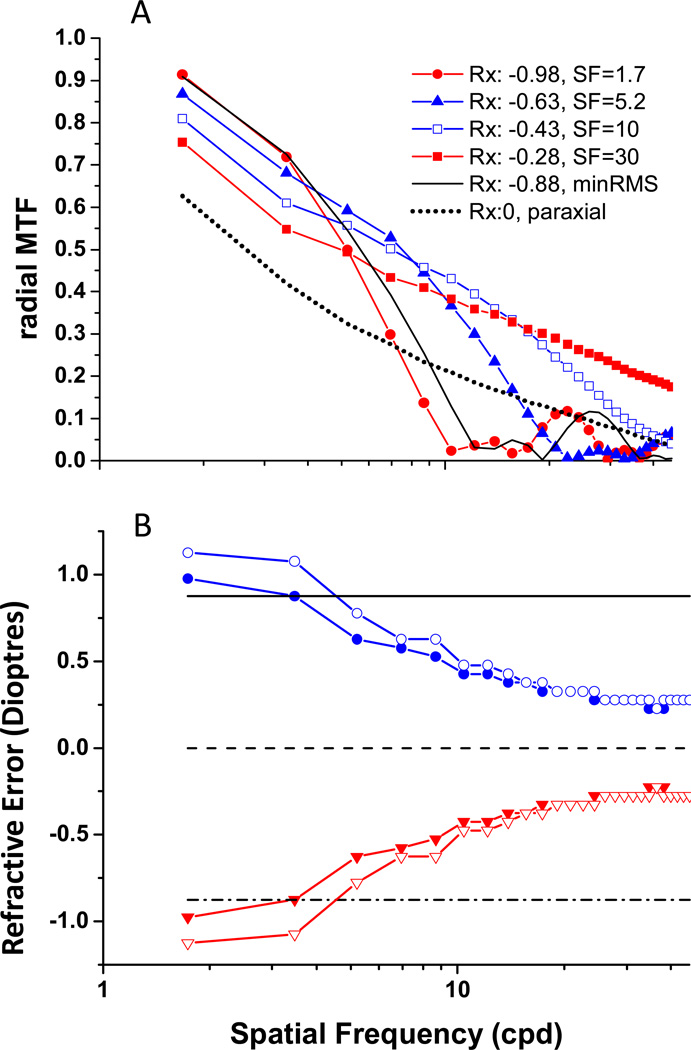
Black and Linfoot 10 and later Charman et al 3 described the impact of spatial frequency on optimal refraction for the full range of SFs, and we repeat their MTF analysis (Figure 4). Fig 4A shows radially averaged MTFs for an eye with C40 = 0.4 µm of primary SA, normal levels of SCE apodization, and a 7 mm pupil. In addition to MTFs for both paraxial and minRMS refractions, we plot the MTFs obtain with the target vergences required to maximize image contrast at four sample frequencies (1.7, 5.2, 10, and 30 cpd). As can be seen in the data of Black and Linfoot 10 and Charman et al 3, in the presence of C40 > 0 an Rx slightly myopic relative to paraxial is required to maximize image modulation for high SF (Figure 4A). In this example, TVs (relative to paraxial Rx) that maximized image modulation at 1.7, 5.2, 10 or 30 cpd were −0.98D, −0.63D, −0.43D, and −0.28D, respectively. The refractive errors measured by these optical criteria vary by about 0.7 D, and reveal considerable differences in what could be considered the best focused MTF for this eye model. The MTF with maximum modulation at low SF (−0.98D) is very similar to the MTF obtained with a minRMS Rx (−0.88D), whereas the paraxially focused MTF is most similar to the MTF that maximized high SF modulation. As TV shifted from that which maximizes high SF modulation to that which maximized low SF modulation, there is little change in low SF image modulation, but very significant changes at high SF. For example, the MTF that maximizes 1.7cpd modulation has almost zero modulation for all SF greater than 10cpd.
Figure 4.
A: Radially average MTFs for the model eye with 7 mm pupil, normal SCE and 0.4 µm of C40. Figure 4B: Rx as a function of SFs for +C40 (red) and − C40 (blue) either w/ SCE (filled) or w/o SCE (open symbols). Dash line: paraxial Rx. Solid line represents minRMS Rx when C40=−0.4µm, and dash-dot line represents minRMS Rx when C40=0.4µm.
The impact of spatial frequency on Rx can be seen directly in Figure 4B for two example cases of C40 = +0.4 and −0.4 µm. In both cases, the high SF Rx is close to paraxial Rx, and as SF decreases Rx drifts toward and eventually exceeds the minRMS Rx. The greatest change in Rx occurs over the SF range 1cpd to 10cpd, and Rx then remains fairly stable between 20cpd to 30cpd. These results mirror those observed computationally by previous authors 3, 10, 28; and experimentally by Green and Campbell, and by Charman et al 3, 11. Interestingly, this myopic shift at low SFs was not observed in a recent study of emmetropes, but was observed in their myopic sample 29. We can see that, as shown in Figure 3, the small effect of SCE is restricted to lower SFs, as shown previously by Atchison et al 28.
Part3: Effect of pupil diameter on refractive error
The core issue motivating these studies related specifically to pupil size: why is subjective Rx dominated by paraxial optics? Therefore, we examined the impact of pupil size on objective Rx determined in the presence of primary SA and SCE. We rescaled the values of C40 from 0.4 for the 7 mm pupil (same as used above in Figure 4) up to 8 mm and down to 1 mm pupil diameters using the method of Schwiegerling 30. This approach generates a scenario that mirrors the situation in the real un-accommodated eye, as pupil size changes the optical components of the eye remain the same and C40 levels vary as the fourth power of pupil radius, e.g. 0.4 µm of SA employed in previous figures for a 7mm pupil scales to 0.4(8/7)4 = 0.6824µm for 8mm pupil. Thus, for a real eye with fixed optics, as pupil dilates, of course paraxial Rx will not change, but min RMS Rx will in that it is determined by the Rx present at a radius of •rmax. That is, in the presence of positive SA, minRMS Rx will drift to myopia as the pupil dilates, or, conversely, drift in the hyperopic direction as pupil size is reduced 30 (Figure 5).
The impact of SCE on pupil size independence of subjective Rx observed by Otero, Koomen and Charman 2, 3, 5, is examined in Figure 5. Zero on the ordinate represents the paraxial refraction for all pupil sizes. In this example, the minRMS Rx for the 7 mm pupil diameter is about −1.1 D myopic relative to this paraxial reference case, and as pupil size decreases, the minRMS refraction approaches this paraxial Rx in direct proportion to r2 (solid lines). The impact of pupil size on the image plane measure of optical quality, VSOTF, is shown in Figure 5A for three different pupil weighting conditions (normal SCE, zero SCE, reversed SCE). When pupil diameters change from 1mm to 4mm, the objective VSOTF Rx and minRMS Rx are similar for all pupil transmission functions, but as pupil increase beyond 4mm, the VSOTF Rx remains constant with and without SCE. We examined the universality of this result by repeating our computations with a reverse SCE (σ = +0.115), which produces a negative Gaussian weight to the pupil centre, thus biasing photon detection toward the pupil margins. With this pupil margin biased weighting function built into the pupil function, we observe the VSOTF Rx to be more myopic/less hyperopic than the minRMS RX, indicating that a marginal pupil radius beyond •rmax is being focused.
When we repeated this pupil size analysis for the objective Rx that maximizes low (2cpd) and high (30cpd) SF modulation, the high SF Rx follows the min RMS Rx for small pupils, but remains fixed between min RMS and paraxial Rx as pupil size is increased beyond 4mm (Figure 5B). The low SF Rx is very similar for small pupil sizes, but unlike the high SF result, remains slightly more myopic relative to the min RMS Rx for all the pupil sizes. These results show that as pupil diameter increased from 1mm to 4mm, high SF and VSOTF refractions show a −0.28D myopic shift relative to a paraxial Rx, but further increases in pupil diameter generate the same spherical Rx. This result directly parallels the psychophysical data from Charman et al 3, in their Figure 7 and 8, when a small letter (high SF) task was used to obtain the subjective refractions. Most significantly for our study, the general pupil size independence of Rx observed subjectively is confirmed objectively, and it occurs with or without a SCE to bias the pupil sensitivity towards its centre.
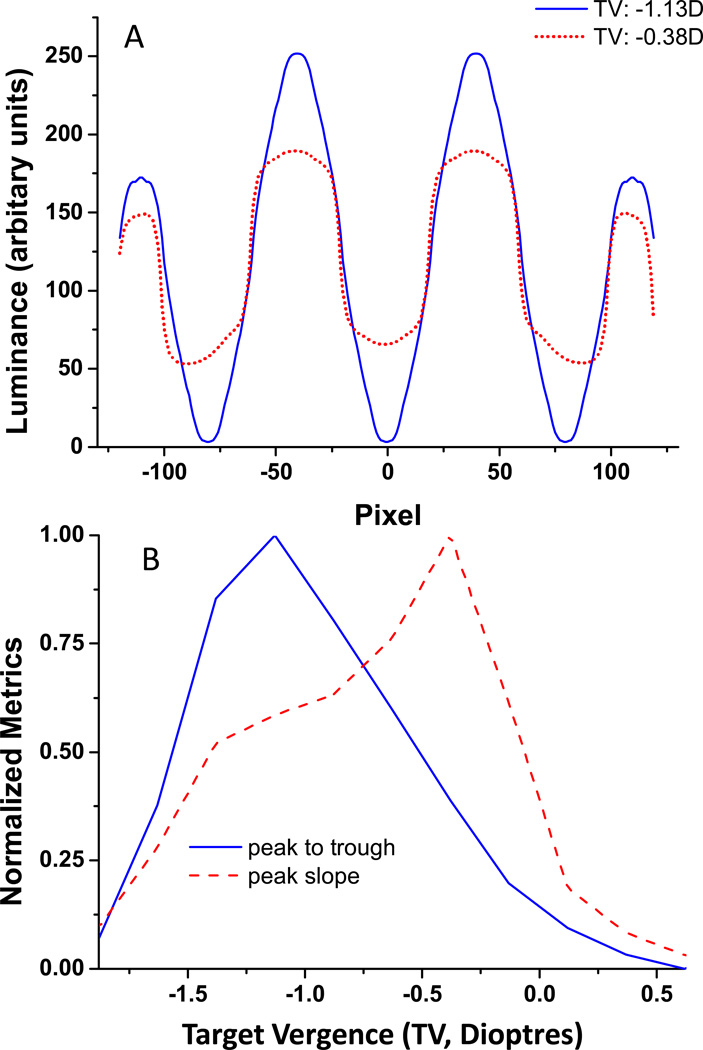
Figure 7.
A: Luminance profiles through two sample images from Figure 6 (3 cpd square wave grating) obtained with TV of −1.13D (blue line), and −0.38D(red dotted line). B: Peak to trough luminance differences (blue line) and maximum edge slopes (red dashed line) normalized to the maxium values are plotted as a function of TV in diopters (zero Target Vergence is parxial focus).
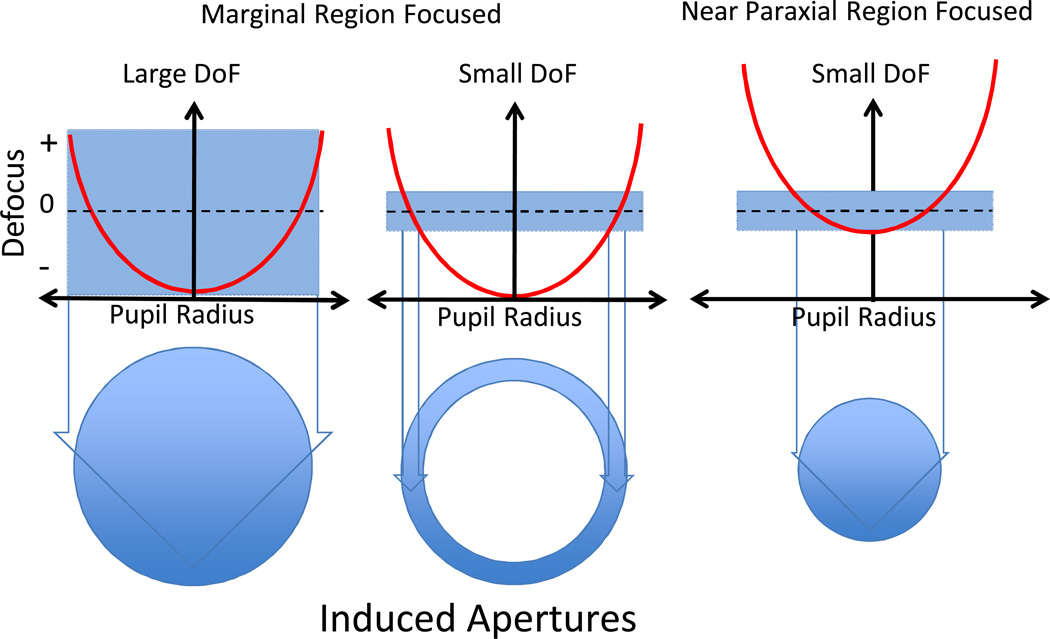
Figure 8.
Schematic showing how depth of focus (DoF) and pupil radius in focus combine to influence the effective apertures in the presence of SA. Each subplot shows the defocus profile across a pupil for an optical system with significant SA (red line). In the left two panels, a radius of is focused (this focus minimizes the WFE RMS), which is the dioptric mid-point half way between the marginal and paraxial focus. In the right panel, a region close to the axis (one depth of focus from the axis) is focused. The vertical height of the blue shaded rectangles represent either a large (left) or small (centre and right) depth of focus associated with low and high SFs, respectively. The blue lines dropped down from these plots enclose the pupil radii that lie within the depth of focus and thus define the effective pupil region (aperture) that contributes to the image.
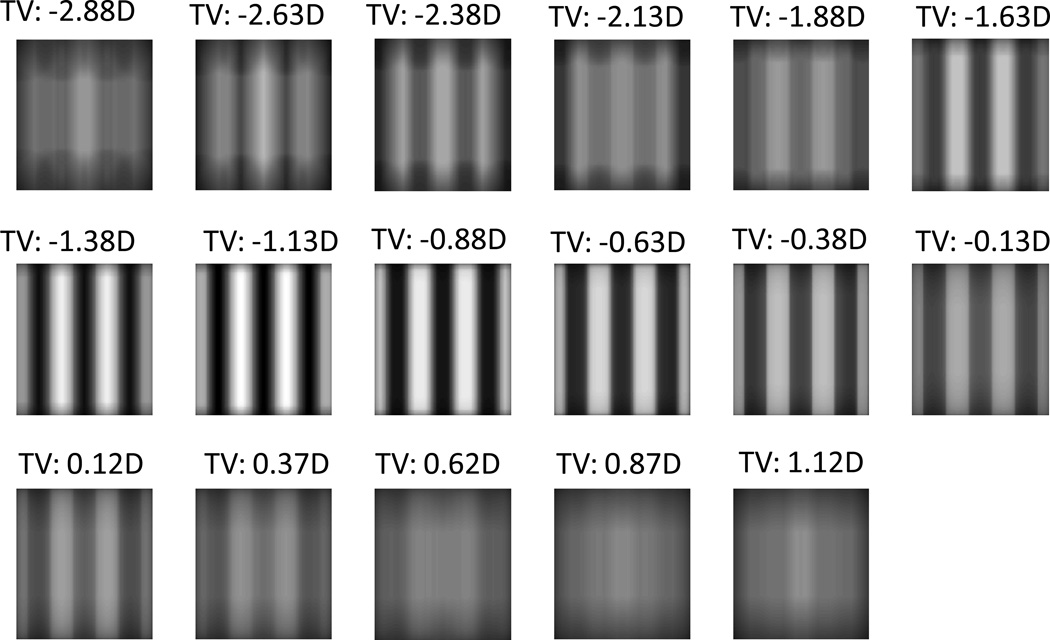
The SF dependence of refraction in the presence of SA (Figure 4B) suggests that an interesting reality exists when imaging broad-spectrum targets: when one region of the spatial spectrum is well focused, another region may be significantly defocused. This can be seen in the example shown in Figure 6 where we include a through focus series of square wave grating images (3 cpd) calculated from a model with a 7 mm pupil and C40=0.4 µm. In this series, zero dioptre refers to the case of paraxial Rx. Notice that for this fairly low spatial frequency grating image contrast at the grating fundamental is approximately maximized with TV= −1.13D or −0.88D, whereas the "sharpness" of the edges of this square wave grating are clearly optimized by a less myopic refraction (approximately −0.38 dioptres). As shown in Figure 3, this slightly myopic refraction will focus most of the visible higher harmonics within the low SF square-wave grating. Notice also the phase reversal that occurs for TV < −2.13 D as the bright bars of the grating become dark and dark bars become bright. Contrast reversal is absent for the same amount of positive defocus. This asymmetric effect, where negative defocus (TV < 0) produces phase reversals but positive defocus (TV > 0) does not is linked to the sign of C40 31.
Figure 6.
A through-focus series of images computed for a 3 cpd vertical square-wave grating for a model with a 7 mm pupil and +0.4 µm of C40. Each image was obtained with a different TV (relative to paraxial focus) reported in dioptres above each image. minRMS Rx achieved with −0.88D TV.
Quantitative analysis of the images from Figure 6 reveals that a refraction based upon maximizing contrast was approximately the same as that which minimized WFE RMS, whereas the Rx that maximized edge slope (sharper edges 32) is also myopic, but closer to a paraxial refraction. In Figure7A we plot the luminance profile through the computed images of these square wave gratings with TV of −1.13D and −0.38D. Figure 7B plots peak-to-trough luminance difference and edge slope as a function of TV for these grating images, which reveals quantitatively the difference in refraction for these two image characteristics in the presence of significant SA. Rx for image contrast is −1.13 D, while Rx for image sharpness is −0.38D. Since perceived sharpness is highly correlated with edge slope33, it is likely that patients employing a perceived sharpness criterion will likely choose the refraction that maximized edge slope.
Discussion
The primary motivation for this study was to explain the central pupil bias seen in spherical refractions of human eyes at photopic light levels 2–6 that seems to disappear at low light levels 2. Two explanations have been proposed for these results. One hypothesis argues that the failure to see a myopic shift with increasing pupil size and positive SA is due to the pupil function being biased to its centre by the photopic Stiles-Crawford Effect 2–4, and the myopic shift observed with pupil dilation at scotopic light levels 2 is due to the absence of a scotopic SCE 13. The second hypothesis2, 3 attributes the myopic shift in Rx that accompanies pupil dilation at scotopic light levels to the reduction in spatial bandwidth of human eye that accompanies decreases in light level 14, 34, 35, and not the absence of SCE 13. This second hypothesis stems from studies showing that, in the presence of positive primary SA, low SF refractions focus more marginal regions of the pupil, whereas high SF refractions focus more paraxial regions of the pupil 2, 3, 10, 11, 28 Our results generally support the data of Atchison who also found that SCE has little impact on refractions that optimized high SFs but a small effect on low SF Rx 28, and thus reject hypothesis 1. Our data clearly show that, in the presence of +SA, low SF Rx will be more myopic and thus focus a more marginal region of the pupil than a high SF Rx (Figures 4 & 5), which supports hypothesis 2. The fact that this myopic shift is observed in both our simple model including only primary SA and human eyes which include a wide range of higher order aberrations16 indicates that other higher order aberrations do not significantly modify this SA phenomenon12, 23. It is important to note that, in itself, this second hypothesis provides no optical explanation for why high SF refractions should be biased to the pupil centre.
This story is complicated by the fact that Koomen et al 2 employed a white light stimulus and they did not cycloplege their subjects. Therefore, as pointed out by Charman 3, the myopic shift in the Koomen experiment could have been the result of the Purkinje shift 4. According to Wald and Griffin, when switching from photopic to scotopic vision an Rx change of about −0.4 dioptres is expected on the basis of the Purkinje shift and chromatic aberration of the eye alone. This myopic shift may also have been due to low light level accommodation 36.
One striking feature of the pupil size data in Figure 5 is the way that high SF Rx and VSOTF Rx change as pupil size increases to 4mm but then remain constant as pupil size in enlarged further. A similar pattern can be seen in the psychophysical data of Charman3. This fixed Rx means that as pupil dilates beyond 4mm, the Rx continues to keep one pupil radius in focus. Since we know that the min RMS Rx is achieved when rmax/√2 is focused, we can see from Figure 5 that with a 4mm pupil diameter, the radius in focus (RiF) = 2mm/√2 = 1.4mm. Since the high SF Rx remains unchanged as pupil size is increased, this 1.4mm pupil radius remains focused for all large pupil sizes.
We asked why does an Rx that focuses this one radius achieve maximum image quality when, as shown in Figure 1C, there is no special bias in the power distribution related to this radius? One could also ask what is the optical basis for the similarity in the low SF and minRMS Rx? There must be some significant difference in the imaging of low and high SFs responsible for these Rx differences that are absent without primary SA.
Although a single Rx can focus only a single pupil radius (radius in focus, RiF) in an eye dominated by SA, due to the depth of focus there will be a range of pupil regions that will be approximately focused. Because DOF is much larger for low SFs than for high SFs 3, 11, 37, 38 it is possible that the whole pupil can contribute to the image of low SFs even in the presence of significant SA, as illustrated in Figure 8 (left panel). As shown in Figure 1B&C, with the minRMS Rx, the mean absolute levels of defocus will be minimized, and thus if all parts of the pupil contribute to image contrast (as they might for low SFs due to the large DOF), a minRMS refraction will result in the minimum space-averaged defocus, and might be expected to generate maximum image modulation. Therefore, a near minRMS refraction for low SFs is not unexpected. A greater challenge is to gain insight into why the high SF Rx remains close to the axis (1.3 or 1.4 mm radius) as the pupil dilates.
Because DOF associated with high SFs can be small 3, 11, 39, it is likely that only regions near the RiF will contribute substantially to the retinal image modulation, as illustrated in Figure 8 (middle panel). Consider, for example, a model of high SF imaging that is based upon a small DOF. As the defocus term changes and different annular regions of the pupil become focused, the effective aperture contributing to the image will be the pupil area near to the RiF. This means that the shape and size of the “induced” aperture will change as RiF changes. In general, when a more marginal point in the pupil is brought into focus, the effective aperture imaging high SFs will be an annular zone centred on RiF (Figure 8, middle panel). When RiF approaches the pupil centre, the annulus will degenerate to a circular disk (i.e. an annulus with inner radius = 0) (Figure 8 right panel).
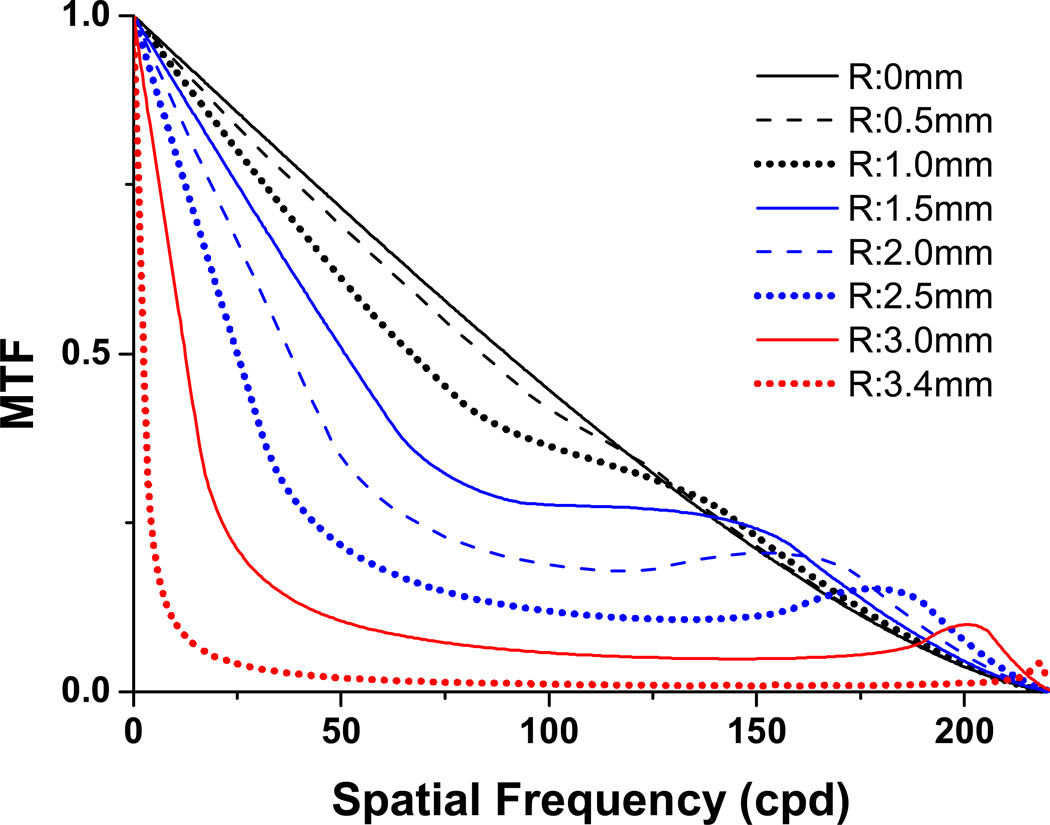
Although it has been demonstrated that annular pupils with equal diameter of a circular pupil exhibit the same diffraction limited cut-off frequency (DL) 40–42 and an annular pupil with the same area of a circular pupil will have the same depth of focus 43, 44, annular and circular pupils have very different imaging abilities, best demonstrated by the diffraction limited MTF 40–42. In Figure 9 we show this trend for a series of annular pupils, all with an outer diameter of 7mm, thus each has the same DL (≈210 cpd). Only the SF range from zero to about 40 or 50 cpd has significance for human vision, and over this SF range, the image modulation for all but the very low SFs drops rapidly as the inner diameter of the annulus increases and thus the annulus thins.
Figure 9.
Diffraction limited MTFs for a series of annular apertures all with a 7mm outer diameter (inner diameters 0, 1, 2, 3, 4, 5, 6, 6.8 mm). A circular pupil will be generated with an inner zone diameter of zero.
We employ a quantitative version of the schematic model shown in Figure 8 to evaluate the impact of pupil RiF in the presence of significant SA (see example in Figure 10). First, we introduce primary SA into the WFE map across a 7 mm diameter pupil (C40=0.4µm). As shown in Figure 1B, this generates a vergence error that is proportional to r2. We set the DOF as +/− 0.25 D, which is widely reported for subjects viewing high spatial frequency and small high contrast targets 37, 45. Interestingly, 0.25D of defocus reduces the log of VSOTF by 0.22 (Figure 2B), which, as shown recently by Ravikumar et al 31, is associated with a 0.1 drop in logMAR. We then select a series of different RiF values, and define the induced aperture as that pupil region for which defocus will be < 0.25D. Figure 10 shows a quantitative example of the impact of DOF and RiF on the effective aperture with RiF selected to be one DOF away from the pupil centre (1.3 mm for this level of SA). In this case, the effective aperture, defined as the pupil region where defocus is within +/− 0.25D, is a circular aperture that includes the axis, and extends out to a radius of 1.9 mm. It is important to note that when the RiF is one DoF from the pupil centre, the induced aperture generated will always be the largest circular aperture that can generate an image, and therefore will have the maximum optical bandwidth without the demodulation present in annular apertures associated with larger RiF (Figure 9).
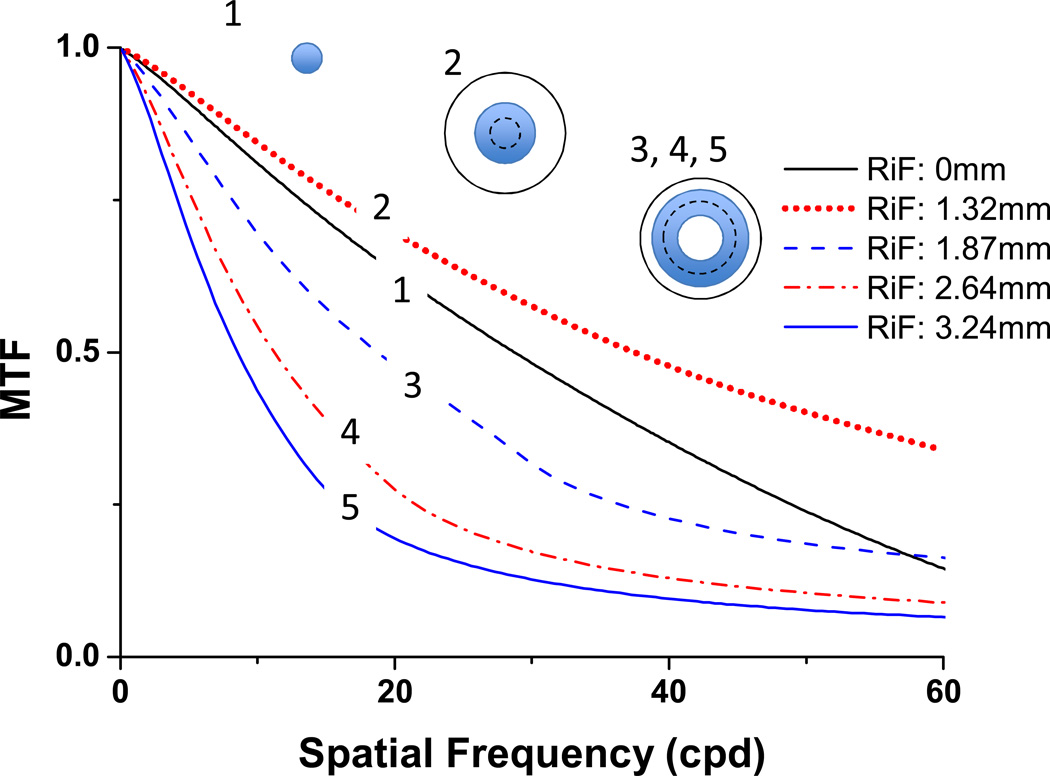
To evaluate this model, we computed MTFs for selected sample RiF and their resulting induced apertures: (1) RiF=0 (paraxial focus), aperture radius=1.32 mm; (2) RiF=1.32 mm (0.25D from pupil centre is focused, thus the DOF region includes the pupil centre out to the radius with 0.5D extra power (1.87 mm)), (3) RiF=1.87 mm (an annular pupil focusing from 1.32 mm to 2.29 mm), (4) RiF=2.64 mm (annulus from 2.29–2.96 mm), (5) RiF=3.24 mm (annulus from 2.96–3.5 mm). Because power is proportional to r2 (Figure 1B), as RiF increases, annulus areas remain fixed, but the annuli become thinner. The MTFs computed for this series of +/− DOF sub-apertures are shown in Figure 11. These results confirm our predictions showing maximal high and medium SF image modulation when RiF is selected that focuses one DOF from the pupil centre (induced aperture #2, Figure 11). As a more central location is focused, diffraction limits the bandwidth, and as a more marginal RiF is selected, image modulation over most of the visible range decreases because of the increased thinning of these induced annular apertures.
Figure 11.
MTF profiles for a series of apertures in the presence of primary SA (C40=0.4 µm for a 7 mm pupil diameter). Each aperture is defined by +/− 0.25D about the focused radius (RiF). Aperture #1 is focused at r=0, with the outer edge of the aperture at r=1.32mm. Aperture #2 is focused at 1.32 mm, and ranges from r=0 to r= 1.87mm. Schematics of these apertures are included showing the aperture range in blue and the RiF as a black dashed line.
Our analysis reveals that, in the presence of significant levels of primary SA, optimum image quality for high SFs will be achieved with a near paraxial focus irrespective of the presence or absence of SCE, and unaffected by the refractive errors present near the pupil margins. This analysis reveals, therefore, that the pupil size independency of spherical refractions stems from the fact that, in the presence of significant amounts of SA, only a limited region of the pupil (the induced aperture) surrounding the region in focus can contribute to the image, and the optimum induced aperture is created by focusing a near paraxial region.
The above explanation for pupil-size independence of spherical Rx assumes that subjective refractions focus high SFs. Typical refractions are performed photopically, with stimuli containing high SFs (small high contrast letters). Studies by Watt and Morgan 32 indicate that human observers quantify blur or, conversely, edge sharpness by the slope (first derivative) of the luminance profile across an edge, and because edge slope is determined by the high SF content, sharper images typically contain more high SF signal. Therefore, maximizing the perceived sharpness of a luminance edge maximizes edge slope, and this increases the ability to locate the edge, a key component in feature detection 46. We predict therefore, that in the presence of significant SA, subjective refractions will generally be dominated by the Rx that maximizes high SF modulation, in that this will maximize edge sharpness and minimize subjective blur. However, this subjective judgment of best focus can be modified by adjusting the subjective criterion from sharper edges to maximum contrast, as observed by clinicians who routinely get patients to discriminate between refractions that make the image “sharper and clearer” vs. “darker” 47. In the presence of +SA, the “sharper” criterion should select a more hyperopic Rx than that observed with the “darker” criterion. This analysis predicts therefore, that autorefractors which refract a near paraxial region of the pupil are likely to generate the best high SF image quality and the best subjective focus.
Acknowledgements
This research was funded by a grant to Arthur Bradley from Essilor Corporation. We are grateful to programming help from Huachun Wang.
References
- 1.Thibos LN, Ye M, Zhang X, Bradley A. Spherical aberration of the reduced schematic eye with elliptical refracting surface. Optom Vis Sci. 1997;74:548–556. doi: 10.1097/00006324-199707000-00024. [DOI] [PubMed] [Google Scholar]
- 2.Koomen M, Scolnik R, et al. A Study of Night Myopia. JOSA. 1951;41:80–90. [Google Scholar]
- 3.Charman WN, Jennings JA, Whitefoot H. The refraction of the eye in the relation to spherical aberration and pupil size. Br J Physiol Opt. 1978;32:78–93. [PubMed] [Google Scholar]
- 4.Wald G, Griffin DR. The change in refractive power of the human eye in dim and bright light. J Opt Soc Am. 1947;37:321–336. doi: 10.1364/josa.37.000321. [DOI] [PubMed] [Google Scholar]
- 5.Otero JM, Aguilar M. Accommodation and Night Myopia. JOSA. 1951;41:1061–1062. [PubMed] [Google Scholar]
- 6.Holladay JT, Lynn MJ, Waring GO, 3rd, Gemmill M, Keehn GC, Fielding B. The relationship of visual acuity, refractive error, and pupil size after radial keratotomy. Arch Ophthalmol. 1991;109:70–76. doi: 10.1001/archopht.1991.01080010072036. [DOI] [PubMed] [Google Scholar]
- 7.Martin J, Vasudevan B, Himebaugh N, Bradley A, Thibos L. Unbiased estimation of refractive state of aberrated eyes. Vision research. 2011;51:1932–1940. doi: 10.1016/j.visres.2011.07.006. [DOI] [PMC free article] [PubMed] [Google Scholar]
- 8.Rynders M, Thibos L, Bradley A, Lopez-Gil N. Apodization neutralization: A new technique for investigating the impact of the Stiles-Crawford effect on the visual function. Doc Ophthalmol Proc Series 60. 1997;60:57–61. [Google Scholar]
- 9.Applegate RA, Lakshminarayanan V. Parametric representation of Stiles-Crawford functions: normal variation of peak location and directionality. J Opt Soc Am A. 1993;10:1611–1623. doi: 10.1364/josaa.10.001611. [DOI] [PubMed] [Google Scholar]
- 10.Black G, Linfoot EH. Spherical Aberration and the Information Content of Optical Images. Mathematical,Physical&Engineering Sciences. 1957;239:522–540. [Google Scholar]
- 11.Green DG, Campbell FW. Effect of focus on the visual response to a sinusoidally modulated spatial stimulus. J Opt Soc Am. 1965;55:1154–1157. [Google Scholar]
- 12.Jansonius NM. Spherical aberration and other higher-order aberrations in the human eye: from summary wave-front analysis data to optical variables relevant to visual perception. J Opt Soc Am A Opt Image Sci Vis. 2010;27:941–950. doi: 10.1364/JOSAA.27.000941. [DOI] [PubMed] [Google Scholar]
- 13.Van Loo JA, Jr., Enoch JM. The scotopic Stiles-Crawford effect. Vision Res. 1975;15:1005–1009. doi: 10.1016/0042-6989(75)90243-6. [DOI] [PubMed] [Google Scholar]
- 14.Van Meeteren Aa JJV. Resolution and contrast sensitivity at low luminances. Vision Res. 1972;12:825–833. doi: 10.1016/0042-6989(72)90008-9. [DOI] [PubMed] [Google Scholar]
- 15.Thibos LN, Hong X, Bradley A, Applegate RA. Accuracy and precision of objective refraction from wavefront aberrations. J Vis. 2004;4:329–351. doi: 10.1167/4.4.9. [DOI] [PubMed] [Google Scholar]
- 16.Thibos LN, Bradley A, Hong X. A statistical model of the aberration structure of normal, well-corrected eyes. Ophthalmic Physiol Opt. 2002;22:427–433. doi: 10.1046/j.1475-1313.2002.00059.x. [DOI] [PubMed] [Google Scholar]
- 17.Bottos KM, Leite MT, Aventura-Isidro M, Bernabe-Ko J, Wongpitoonpiya N, Ong-Camara NH, Purcell TL, Schanzlin DJ. Corneal asphericity and spherical aberration after refractive surgery. J Cataract Refract Surg. 2011;37:1109–1115. doi: 10.1016/j.jcrs.2010.12.058. [DOI] [PubMed] [Google Scholar]
- 18.Marcos S, Barbero S, Llorente L, Merayo-Lloves J. Optical response to LASIK surgery for myopia from total and corneal aberration measurements. Invest Ophthalmol Vis Sci. 2001;42:3349–3356. [PubMed] [Google Scholar]
- 19.Winn B, Whitaker D, Elliott DB, Phillips NJ. Factors affecting light-adapted pupil size in normal human subjects. Invest Ophthalmol Vis Sci. 1994;35:1132–1137. [PubMed] [Google Scholar]
- 20.Cheng X, Bradley A, Thibos LN. Predicting subjective judgment of best focus with objective image quality metrics. J Vis. 2004;4:310–321. doi: 10.1167/4.4.7. [DOI] [PubMed] [Google Scholar]
- 21.Cheng X, Bradley A, Ravikumar S, Thibos LN. Visual impact of Zernike and Seidel forms of monochromatic aberrations. Optom Vis Sci. 2010;87:300–312. doi: 10.1097/OPX.0b013e3181d95217. [DOI] [PMC free article] [PubMed] [Google Scholar]
- 22.Benard Y, Lopez-Gil N, Legras R. Optimizing the subjective depth-of-focus with combinations of fourth- and sixth-order spherical aberration. Vision Res. 2011;51:2471–2477. doi: 10.1016/j.visres.2011.10.003. [DOI] [PubMed] [Google Scholar]
- 23.Chen L, Singer B, Guirao A, Porter J, Williams DR. Image metrics for predicting subjective image quality. Optom Vis Sci. 2005;82:358–369. doi: 10.1097/01.opx.0000162647.80768.7f. [DOI] [PubMed] [Google Scholar]
- 24.Guirao A, Williams DR. A method to predict refractive errors from wave aberration data. Optom Vis Sci. 2003;80:36–42. doi: 10.1097/00006324-200301000-00006. [DOI] [PubMed] [Google Scholar]
- 25.Thibos LN, Hong X, Bradley A, Cheng X. Statistical variation of aberration structure and image quality in a normal population of healthy eyes. J Opt Soc Am A Opt Image Sci Vis. 2002;19:2329–2348. doi: 10.1364/josaa.19.002329. [DOI] [PubMed] [Google Scholar]
- 26.Iskander DR, Nam J, Thibos LN. The statistics of refractive error maps: managing wavefront aberration analysis without Zernike polynomials. Ophthalmic Physiol Opt. 2009;29:292–299. doi: 10.1111/j.1475-1313.2008.00631.x. [DOI] [PubMed] [Google Scholar]
- 27.Yi F, Iskander DR, Collins MJ. Estimation of the depth of focus from wavefront measurements. J Vis. 2010;10(3):1–9. doi: 10.1167/10.4.3. [DOI] [PubMed] [Google Scholar]
- 28.Atchison DA, Joblin A, Smith G. Influence of Stiles-Crawford effect apodization on spatial visual performance. J Opt Soc Am A Opt Image Sci Vis. 1998;15:2545–2551. doi: 10.1364/josaa.15.002545. [DOI] [PubMed] [Google Scholar]
- 29.Radhakrishnan H, Pardhan S, Calver RI, O'Leary DJ. Effect of positive and negative defocus on contrast sensitivity in myopes and non-myopes. Vision Res. 2004;44:1869–1878. doi: 10.1016/j.visres.2004.03.007. [DOI] [PubMed] [Google Scholar]
- 30.Schwiegerling J. Scaling Zernike expansion coefficients to different pupil sizes. J Opt Soc Am A Opt Image Sci Vis. 2002;19:1937–1945. doi: 10.1364/josaa.19.001937. [DOI] [PubMed] [Google Scholar]
- 31.Ravikumar S, Bradley A, Thibos L. Phase changes induced by optical aberrations degrade letter and face acuity. J Vis. 2010;10:18. doi: 10.1167/10.14.18. [DOI] [PubMed] [Google Scholar]
- 32.Watt RJ, Morgan MJ. The recognition and representation of edge blur: evidence for spatial primitives in human vision. Vision Res. 1983;23:1465–1477. doi: 10.1016/0042-6989(83)90158-x. [DOI] [PubMed] [Google Scholar]
- 33.Zhang B, Allebach JP, Pizlo Z. An investigation of perceived sharpness and sharpness metrics. Proc SPIE 5668, Image Quality and System Performance II, 98. 2005 SPIE Proceedings. [Google Scholar]
- 34.Smith RA., Jr. Luminance-dependent changes in mesopic visual contrast sensitivity. J Physiol. 1973;230:115–135. doi: 10.1113/jphysiol.1973.sp010178. [DOI] [PMC free article] [PubMed] [Google Scholar]
- 35.Schefrin BE, Tregear SJ, Harvey LO, Jr., Werner JS. Senescent changes in scotopic contrast sensitivity. Vision Res. 1999;39:3728–3736. doi: 10.1016/s0042-6989(99)00072-3. [DOI] [PubMed] [Google Scholar]
- 36.Artal P, Schwarz C, Canovas C, Mira-Agudelo A. Night myopia studied with an adaptive optics visual analyzer. PLoS One. 2012;7:e40239. doi: 10.1371/journal.pone.0040239. [DOI] [PMC free article] [PubMed] [Google Scholar]
- 37.Atchison DA, Charman WN, Woods RL. Subjective depth-of-focus of the eye. Optom Vis Sci. 1997;74:511–520. doi: 10.1097/00006324-199707000-00019. [DOI] [PubMed] [Google Scholar]
- 38.Kotulak JC, Schor CM. The effects of optical vergence, contrast, and luminance on the accommodative response to spatially bandpass filtered targets. Vision Res. 1987;27:1797–1806. doi: 10.1016/0042-6989(87)90108-8. [DOI] [PubMed] [Google Scholar]
- 39.Charman WN. Night myopia and driving. Ophthalmic Physiol Opt. 1996;16:474–485. [PubMed] [Google Scholar]
- 40.Tschunko HF. Imaging performance of annular apertures. Appl Opt. 1974;13:1820–1823. doi: 10.1364/AO.13.001820. [DOI] [PubMed] [Google Scholar]
- 41.O'Neill EL. Transfer Function for an Annular Aperture. JOSA. 1956;46:285–288. [Google Scholar]
- 42.Linfoot EH, Wolf E. Diffraction Images in Systems with an Annular Aperture. Proc Phys Soc B. 1953;66:145–150. [Google Scholar]
- 43.Welford WT. Use of Annular Apertures to Increase Focal Depth. JOSA. 1960;50:749–752. [Google Scholar]
- 44.Charman WN, Jennings JA. Properties of annular artificial pupils. Vision Res. 1979;19:947–949. doi: 10.1016/0042-6989(79)90032-4. [DOI] [PubMed] [Google Scholar]
- 45.Atchison DA, Guo H, Charman WN, Fisher SW. Blur limits for defocus, astigmatism and trefoil. Vision Res. 2009;49:2393–2403. doi: 10.1016/j.visres.2009.07.009. [DOI] [PubMed] [Google Scholar]
- 46.Georgeson MA, May KA, Freeman TC, Hesse GS. From filters to features: scale-space analysis of edge and blur coding in human vision. J Vis. 2007;7(7):1–21. doi: 10.1167/7.13.7. [DOI] [PubMed] [Google Scholar]
- 47.Keirl A, Christie C. Oxford: Elsevier Butterworth-Heinemann; 2007. Clinical optics and refraction : a guide for optometrists, contact lens opticians, and dispensing opticians. [Google Scholar]


