

Abstract
Calorie restriction (CR) increases longevity and retards the development of many chronic diseases, but the underlying metabolic signals are poorly understood. Increased fatty acid (FA) oxidation and reduced FA synthesis have been hypothesized to be important metabolic adaptations to CR. However, at metabolic steady state, FA oxidation must match FA intake plus synthesis; moreover, FA intake is low, not high, during CR. Therefore, it is not clear how FA dynamics are altered during CR. Accordingly, we measured food intake patterns, whole body fuel selection, endogenous FA synthesis, and gene expression in mice on CR. Within 2 days of CR being started, a shift to a cyclic, diurnal pattern of whole body FA metabolism occurred, with an initial phase of elevated endogenous FA synthesis [respiratory exchange ratio (RER) >1.10, lasting 4–6 h after food provision], followed by a prolonged phase of FA oxidation (RER = 0.70, lasting 18–20 h). CR mice oxidized four times as much fat per day as ad libitum (AL)-fed controls (367 ± 19 vs. 97 ± 14 mg/day, P < O.001) despite reduced energy intake from fat. This increase in FA oxidation was balanced by a threefold increase in adipose tissue FA synthesis compared with AL. Expression of FA synthase and acetyl-CoA carboxylase mRNA were increased in adipose and liver in a time-dependent manner. We conclude that CR induces a surprising metabolic pattern characterized by periods of elevated FA synthesis alternating with periods of FA oxidation disproportionate to dietary FA intake. This pattern may have implications for oxidative damage and disease risk.
Keywords: fat synthesis, lipogenesis, palmitoleate, heavy water
calorie restriction (CR) delays the development of chronic disease and prolongs lifespan in mice (1, 17, 27, 34). These effects correlate with a rapid induction in the expression of certain genes that persist as long as animals remain on CR (10, 36) even after energy balance is restored. These observations suggest the presence of a chronic signal of reduced energy availability that persists after energy balance has been reestablished. However, the underlying metabolic signals and adaptations responsible are not fully understood.
Mice on CR regimens have been reported to exhibit increased expression of genes for fatty acid (FA) oxidation and decreased expression of genes for FA synthesis compared with ad libitum (AL)-fed controls (6, 7, 30, 38). Due to differential entry points into the electron transport chain, a metabolic shift from carbohydrate to FA oxidation may reduce the production of reactive oxygen species (ROS) (15). A shift to FA oxidation thereby represents a potential mechanism for reduced oxidative damage, which has been proposed as a potential explanation for the health benefits of CR (14, 15, 29, 35). It has also been proposed that reduced rates of FA synthesis may inhibit tumor formation (30, 38). Thus, changes in macronutrient metabolism, specifically FA oxidation or synthesis, may be an important metabolic mediator of the health benefits of CR.
However, a problem with the FA oxidation hypothesis relates to a basic principle of energetics and macronutrient balance in whole organisms. At metabolic steady state, i.e., when body composition is stable, fuel selection must match dietary macronutrient composition (13, 44). In other words, the respiratory quotient (RQ) over each 24-h period is usually identical to the net daily “food quotient” (FQ). Since the macronutrient composition of the diets fed to calorie-restricted and AL-fed mice are typically identical (FQ = 0.94) and total energy intake is lower on CR, neither relative nor absolute FA intake is elevated in CR animals. On the surface, these considerations argue against a role for increased FA oxidation rates as a signal mediating health benefits in CR mice.
The goal of this study was to determine whole body FA oxidation and synthesis rates in calorie-restricted and AL-fed mice with the use of a combination of indirect calorimetry and stable isotope labeling and to compare these metabolic changes to gene expression in white adipose tissue and liver. We report here a rapidly induced diurnal pattern of FA synthesis and oxidation in mice on CR regimens. We hypothesize that this pattern of macronutrient metabolism could provide signals linking CR to health benefits.
METHODS
Mice and diets.
Nine-week-old C57BL/6J male mice were obtained from Charles River Breeding Laboratories, housed individually, and maintained under temperature- and light-controlled conditions (12:12-h light-dark cycle: lights on at 7 AM and off at 7 PM) for 1 wk. During this acclimation period, mice were given free access to water and a semipurified AIN-93M diet (Bio-Serv), and the daily amount of food consumed by each mouse was recorded.
At 10 wk of age, mice were assigned randomly to either the CR or the AL control group. Mice in the AL group were provided free access to food throughout the day, whereas mice in the CR group were provided 70% of the calories consumed by the AL group. Food was provided to the CR group daily at 6 PM. Mice were maintained on CR or AL for ≥5 wk before any experimental studies were carried out. Upon completion of each experiment, mice were anesthetized under 3% isoflurane, and blood was collected via cardiac puncture, followed by cervical dislocation. All procedures and protocols received approval from the University of California Berkeley Animal Use Committee.
Food consumption.
Food consumption was determined by 24-h automatic food monitoring system in environment-controlled Comprehensive Laboratory Animal Monitoring System (CLAMS) metabolic cages (Columbus Scientific). Total food consumption was measured six times per hour and averaged to determine hourly food consumption.
Respiratory exhange ratio, energy expenditure, FA oxidation, and fuel selection.
We determined respiratory exchange ratio (RER), energy expenditure (EE), FA oxidation, and fuel selection in environment-controlled CLAMS metabolic cages equipped with an indirect open-circuit calorimeter (Oxymax Equal Flow System). The system measures carbon dioxide produced and oxygen consumed over a 1-min period six times per hour. These values were averaged to determine the rate of carbon dioxide produced (V̇co2) and oxygen consumed (V̇o2) in milliliters per hour. EE, RER, and FA oxidation were calculated using the following equations (25):
Daily FA oxidation was calculated from the 24-h area under the curve (AUC) of hourly FA oxidation. Daily carbohydrate plus protein oxidation was calculated from total daily EE and determined from the AUC of hourly EE minus daily FA oxidation.
FA synthesis.
FA synthesis was measured by stable isotope incorporation, with analysis by gas chromatography-mass spectrometry. Mice were labeled with an intraperitoneal injection of 100% 2H2O (0.35 ml/10 g body wt) and then provided 8% 2H2O as drinking water for 6–24 h, as described previously (40). Upon completion of labeling, mice were euthanized, and tissue or serum was collected and homogenized in a 2:1 chloroform-methanol solution. Pentadecanoic acid (10 mg/ml) was added to solutions as an internal control. Lipid was extracted in methanol-chloroform overnight and methylated with 5% methanolic acid with heating at 50°C for 1 h. The FA methyl esters were extracted via the Folch technique with hexane after the addition of water.
Total FA concentrations were measured via gas chromatography-flame ionization detection using an Agilent 6890N GC (Agilent Technologies, Palo Alto, CA) and a DB-225MS column. Hydrogen was used as carrier gas at a constant flow rate of 40 ml/min. The temperature of the GC oven was set to 110°C for 2 min, increased to 220°C for 8 min, and held at 240°C for 5 min. HP Chemstation software was used for data analysis.
The fraction of newly synthesized nonessential saturated FA formed during the 2H2O labeling period was assessed using a combinatorial model of polymerization biosynthesis, as described previously (37, 39). Briefly, mass isotopomer distribution analysis was used to determine the number (n) of hydrogen atoms in FA C-H bonds that were derived from cellular water during endogenous synthesis of FA. Enrichments, or excess fractional molar abundances (EMx) above baseline, were measured for the parent (EM0), single-labeled (EM1), and double-labeled (EM2) mass isotopomers in the FA by gas chromatography-mass spectrometry. Specifically, the fractional abundances of molecular anions m/z 270, 271, and 272 (for 16:0, palmitate) and m/z 298, 299, and 300 (for 18:0, stearate) were determined in natural abundance (baseline) samples and in 2H2O labeled samples. The measured body 2H2O enrichment was then used to represent the isotopic enrichment of hydrogen atoms entering C-H bonds in the FA-synthetic pathway, i.e., the true precursor pool (p) (37, 39), and n was calculated from EM2/EM1 ratios, as described previously (22). The maximal or asymptotic 2H excess mass +1 isotopomeric enrichment (A*1) possible in the FA at this p and n, representing the EM1 value if 100% of the FA were newly synthesized from this body water pool, was then calculated (37, 39). The measured EM1 value was divided by the asymptotic value to calculate the fraction (f) of FA that was endogenously synthesized during the labeling period:
This approach was modified to determine the fractional synthesis of palmitoleate (16:1) and oleate (18:1). The double bonds were saturated by reacting 10 mg of FA methyl esters with 5 mg of bromine in 400 μl of carbon tetrachloride for 30 min. The resultant dibromo methyl ester FAs were analyzed by positive chemical ionization, and after loss of bromine, anions m/z 347 and 348 (for 16:1) and m/z 377, 378, and 379 (for 18:1) were compared with determined EM1 and EM2 values.
Whole body fat mass, used to calculate total adipose FA synthesis, was estimated at 15% body weight for CR and 32% body weight for AL on the basis of literature values (3, 4, 9, 16, 18, 26).
Gene expression.
RNA was isolated from snap-frozen inguinal and epididymal adipose tissue and liver tissue using RNeasy kit (Qiagen) and reverse transcribed with M-MulV reverse transcriptase (New England Biolabs). Next, 25 ng of diluted cDNA was run on an ABI 7500 Fast Real-Time PCR System using TaqMan gene expression master mix and probed with FA synthase (FAS; Mm01253300_g1), acetyl-CoA carboxylase-1 (ACC1; Mm01304289_m1), β2-microglobulin (Mm00437762_m1), sterol regulatory element-binding protein-1 (SREBP-1; Mm00550338_m1), peroxisome proliferator-activated receptor-γ (PPARγ; Mm00440945_m1), and glyceraldeyde-3-phosphate dehydrogenase (GAPDH; predeveloped TaqMan assay reagent) according to the manufacturer's instructions (Applied Biosystems). To account for potential time-dependent changes in any single reference gene, the expressions of FAS, ACC1, SREBP-1, and PPARγ mRNA were divided by the expressions of two reference genes (GAPDH and β2-microglobin) in each tissue, and these values were then averaged. Data from all groups were expressed as means ± SE relative to AL control animals at 6 PM.
Serum lipids.
Serum nonesterified FA (NEFA) and triglyceride (TG) concentrations were determined by HR Series NEFA-HR and L-Type TG M methods (Wako Diagnostics), respectively.
Statistical analysis.
All results are presented as means ± SE. The AUC for Fig. 3 was calculated with a baseline of 0 and from x = 0 to x = 24. Differences between groups were analyzed by two-way ANOVA with Bonferroni post hoc test or t-test. Data were analyzed by Prism Graphpad software (version 5.0a).
Fig. 3.
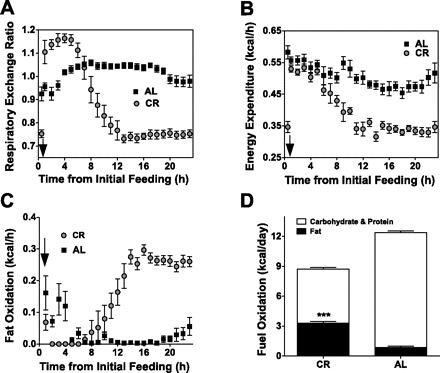
Higher rates of whole body fat oxidation in response to calorie restriction. Mice were adapted to CR or AL feeding for ≥5 wk and then placed in metabolic cages for 24 h to determine RER (A) and energy expenditure (B) at each hour of the day. Hourly fat oxidation (C) and summed daily macronutrient oxidation (D) were calculated as described in methods. Values are means ± SE (n = 4–8 mice/group). ***P < 0.001, difference from AL values by ANOVA and Bonferroni post hoc test. ↓Time when daily food was provided to CR mice.
RESULTS
Body weights and food intake pattern.
The most obvious changes in response to CR in rodents are lower body weights and reduced adiposity. Another major adaptation that we have observed is a dramatic alteration in feeding pattern. Mice fed AL maintained relatively constant energy intake throughout the day (0.69 ± 0.07 kcal/h; Fig. 1A). In contrast, calorie-restricted mice given food each day at 6 PM consumed their entire daily allotment of food in ∼1 h at an average rate of 8.7 kcal/h, followed by a nearly 23-h daily absence of food energy intake (Fig. 1A).
Fig. 1.
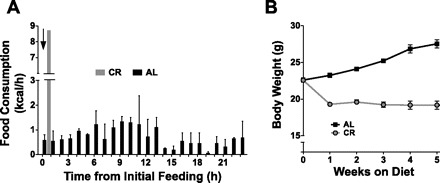
Altered feeding pattern and body weight in response to calorie restriction. Food was provided to calorie-restricted (CR) and ad libitum (AL)-fed mice at 6 PM. A: food consumption was recorded hourly, using food balance in metabolic cages, over the next 24 h. B: mice were weighed weekly. Values are means ± SE for 6 mice/group. ↓Time when daily food was provided to CR mice.
Fuel selection.
To determine whether this pattern of feeding and fasting influences fuel selection throughout the day and to determine the duration of CR needed to induce a potential change, the RER was calculated after various durations of CR. We observed that CR immediately led to a dramatic change in the daily pattern of fuel selection (Fig. 2). Whereas AL mice maintained an RER of ∼0.9–1.0, representing primarily carbohydrate oxidation (Fig. 2A), as expected from the predominance of carbohydrate energy in the diet, CR mice exhibited two distinct phases of fuel selection each day (Fig. 2, B–F). In the first phase, immediately following provision of food, the CR mice exhibited RER values significantly greater than 1.0, which is generally taken to represent both carbohydrate oxidation and endogenous FA synthesis (33). In the second phase, beginning ∼6 h after food is presented each day, RER values fell rapidly to ∼0.7, representing exclusively FA oxidation. This pattern became more pronounced over the course of the first 7 days of CR (Fig. 2, A–D), and the circadian pattern continued for the remainder of the CR feeding regimen (Fig. 2F). Thus, it appears that CR rapidly and significantly alters whole body fuel selection, leading to a metabolically unusual pattern of both increased FA oxidation and increased FA synthesis, on the whole body level.
Fig. 2.
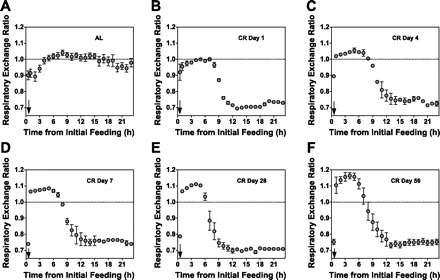
Time course of effect of calorie restriction on fuel selection pattern. AL-fed mice were placed in metabolic cages before starting a CR diet (A) and again on days 1 (B), 4 (C), 7 (D), 28 (E), and 56 (F) of calorie restriction. Gas exchange was monitored for 24 h each time mice were placed in metabolic cages. Respiratory exchange ratios (RER) were recorded 6 times/h and then averaged to give RER for each hour. Values are means ± SE for 4 mice/diet. ↓Time when daily food was provided to CR mice.
Total fat oxidation in the whole body.
The energy derived from FA oxidation was calculated from a combination of RER (Fig. 3A) and EE (Fig. 3B). Both the hourly and daily FA oxidation rates are shown (see calculations; Fig. 3, C and D). CR mice oxidized almost four times as much fat as AL mice per day (3.3 ± 0.17 vs. 0.87 ± 0.13 kcal/day, or 367 ± 19 and 97 ± 14 mg/day, respectively; Fig. 3D). CR mice derived 37% of their daily energy needs from fat oxidation compared with only 7% for AL mice (Fig. 3D). Fat content of the diets fed to both groups was identical (9.7% of metabolizable energy). These data demonstrate that CR dramatically increases the total energy derived directly from FA oxidation compared with AL controls.
CR mice oxidized >300 mg of fat/day, but they consumed only 92 mg of fat/day. Over the last 28 days of the 35-day CR regimen, CR mice were in neutral or positive energy balance (Fig. 1B). To establish whether increased FA synthesis can be detected biochemically and whether this synthesis can account for the higher FA oxidation rates in the whole body, we measured endogenous FA synthesis from 2H incorporation into FAs in adipose and liver tissue after endogenous labeling with 2H2O.
Endogenous FA synthesis.
CR led to 15.8-, 26.8-, 30-, and 3.2-fold increases in the daily accumulation of endogenously synthesized palmitate, palmitoleate, stearate, and oleate (mg/g adipose tissue), respectively, in adipose tissue relative to AL controls (Fig. 4A). In contrast, CR did not alter the accumulation of any endogenously synthesized FA in the liver (Fig. 4B). When extrapolated to total fat mass, CR mice synthesized and retained in adipose tissue and liver a total of 212 ± 13 mg FA/day compared with 91 ± 9 mg/day for AL controls (Fig. 4C). Thus, endogenous FA synthesis that was retained in the adipose tissue and liver (212 mg/day) accounts for a substantial proportion of the whole body FA oxidation that was in excess of food intake (∼270 mg/day). Endogenous FAs that were synthesized and directly oxidized, rather than being mixed into the general adipose TG pool, would not accrue or be measured in adipose depots and could account for the remainder of FA oxidation in excess of intake.
Fig. 4.

Effect of CR on fatty acid (FA) synthesis in adipose tissue and liver. Daily FA synthesis was calculated for the 4 most abundant FAs: palmitate (16:0), palmitoleate (16:1), stearate (18:0), and oleate (18:1). In the subcutaneous adipose depot (A) and the liver (B) in CR and AL mice, values are expressed as mg/g tissue. C: total adipose and liver FA that was synthesized during the period of 2H2O exposure and remained in the tissue was calculated from values in A and B and adjusted for estimated whole body fat mass (as described in methods) and measured liver weights, respectively. Values are means ± SE (n = 8–14 mice/dietary group). ***P < 0.001, **P < 0.01, *P < 0.05, difference from AL values by ANOVA and Bonferroni post hoc test.
To determine whether the endogenous synthesis of FAs occurred in the adipose tissue directly or whether the FAs were transported to the adipose following synthesis in the liver, we measured 2H incorporation into palmitate in adipose (subcutaneous and epididymal depots), liver, and VLDL throughout the first day after exposure to 2H2O (Fig. 5). In the first 3 h after food was provided, a fivefold increase was observed in the accumulation of newly synthesized palmitate in the subcutaneous depot (14.1 ± 1.2 vs. 2.7 ± 0.2 mg/depot), and a twofold increase was observed in the epididymal depot (2.9 ± 0.1 vs. 1.5 ± 0.1 mg/depot) in CR mice relative to AL controls, after which accumulation occurred at a much slower rate (Fig. 5, A and B). This circadian pattern of FA synthesis parallels the pattern seen in the RER data (Fig. 2). In contrast, there was no increase in the accumulation of endogenously synthesized palmitate in the liver at any time point (Fig. 5C) and only a small increase in plasma VLDL of CR mice 6 h after feeding (Fig. 5D). The magnitude and timing of the accumulation of endogenously synthesized palmitate in the adipose tissue relative to the liver suggests that adipose tissue is the major site of FA synthesis in response to CR.
Fig. 5.

Endogenous synthesis of palmitate in various tissues throughout the day. Mice were labeled with 2H2O at 12 PM and tissues collected, and endogenous palmitate synthesis was calculated at various times after provision of daily food: 6 PM (0 h), 9 PM (3 h), 12 AM (6 h), and 12 PM (18 h) in subcutaneous (A) and epididymal (B) adipose depots and in liver (C). D: endogenously synthesized palmitate was also calculated in plasma VLDL at 6 PM, 9 PM, 12 AM, and 12 PM in the same mice. Values represent palmitate synthesis in the total subcutaneous and epididymal depots as well as in the total liver. Palmitate synthesis in VLDL is expressed per milliliter of serum. Values are means ± SE (n = 6 mice/dietary group). ***P < 0.001, **P < 0.01, *P < 0.05, difference from AL values by ANOVA and Bonferroni post hoc test. ↓Time when daily food was provided to CR mice.
Gene expression.
To determine whether changes in gene expression reflected these striking changes in flux through FA-synthetic pathways, we measured FAS, ACC1, SREBP-1, and PPARγ mRNA levels in liver and adipose tissue at several time points throughout the day (Figs. 6 and 7). In the liver, FAS and ACC1 expression were widely variable throughout the day in CR mice, exhibiting 51- and 16-fold differences, respectively, between 6 and 9 PM [0.05 vs. 2.55 and 0.09 vs. 1.44 relative units (RU), respectively; Fig. 6, A and B]. In contrast, the expression of these genes varied little in AL controls over the same time period (1.00 vs. 0.87 and 1.00 vs. 0.72 RU; Fig. 6, A and B). SREBP-1 followed a similar, but less dramatic, pattern between 6 and 9 PM in livers of CR mice (0.42 vs. 1.46 RU, respectively; Fig. 6C), and again, there was very little change in control values (1.00 vs. 0.97 RU). There was a trend for decreased PPARγ expression in CR livers at all time points (Fig. 6D).
Fig. 6.

Effect of calorie restriction on lipogenic gene expression in liver. FA synthase (FAS; A), acetyl-CoA carboxylase 1 (ACC1; B), sterol regulatory element-binding protein-1 (SREBP-1; C), and peroxisome proliferator-activated receptor-γ (PPARγ; D) gene expression was measured in the liver of CR and AL mice at 6 PM, 9 PM, or 12 AM. Expression was normalized first to both GAPDH and β2-microglobulin, and then these normalized values were averaged. Values are shown relative to AL values measured at 6 PM [relative units (RU)]. Values are means ± SE (n = 6 mice/dietary group). **P < 0.01, *P < 0.05, difference from time-matched AL values by ANOVA and Bonferroni post hoc test. ↓Time when daily food was provided to CR mice.
Fig. 7.
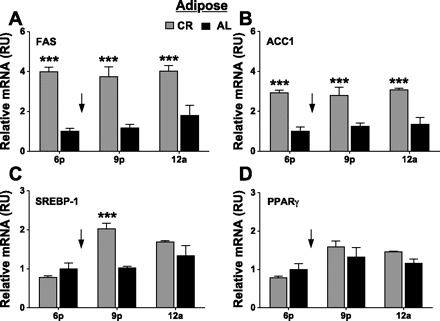
Effect of calorie restriction on lipogenic gene expression in adipose tissue. FAS (A), ACC1 (B), SREBP-1 (C), and PPARγ (D) gene expression was measured in the adipose tissue of CR and AL mice at 6 PM, 9 PM, or 12 AM. Expression was normalized first to both GAPDH and β2-microglobulin, and then these normalized values were averaged. Values are shown relative to AL values measured at 6 PM (RU). Values are means ± SE (n = 6 mice/dietary group). ***P < 0.001, difference from time-matched AL values by ANOVA and Bonferroni post hoc test. ↓Time when daily food was provided to CR mice.
In the adipose tissue, FAS and ACC1 expression were four- and threefold higher, respectively, in CR than AL mice at 6 PM (3.97 vs. 1.00 RU and 2.92 vs. 1.00 RU; Fig. 7, A and B), and this difference was maintained throughout the day. Whereas there was no difference in SREBP-1 expression in adipose tissue of CR mice at 6 PM, there was a twofold increase at 9 PM (2.02 vs. 1.03 RU; Fig. 7C). There was no difference in PPARγ expression in the adipose between CR and AL mice at any time point (Fig. 7D).
Palmitoleate levels in CR mice.
It has recently been suggested that increased rates of FA synthesis in adipose tissue result in a particular accumulation of palmitoleate, which is an insulin-sensitizing FA (5, 11), in adipose tissue as well as in serum (5, 19, 20, 32, 42, 43). To determine whether there was an increase in palmitoleate accumulation in our CR mice, we used gas chromatography coupled with flame ionization detection to measure FA composition in the inguinal and epidymal adipose depots and in the liver. We found a significant increase in palmitate concentration in both adipose depots but no increase in palmitoleate concentration in adipose tissue or the liver (Table 1).
Table 1.
Fatty acid composition
| Tissue (Diet) | Fatty Acids (%total) |
||||
|---|---|---|---|---|---|
| 16:0 | 16:1 | 18:0 | 18:1 | 18:2 | |
| ING | |||||
| CR | 29±2* | 7±1* | 8±1* | 42±2* | 14±1* |
| AL | 22±1 | 11±1 | 2±0.3 | 40±1 | 24±1 |
| EPI | |||||
| CR | 31±2* | 9±1* | 7±1* | 38±1 | 16±3* |
| AL | 22±1 | 10±1 | 2±0.1 | 39±1 | 27±1 |
| Liver | |||||
| CR | 32±4 | 5±1* | 10±1 | 38±3 | 15±3 |
| AL | 31±2 | 6±1 | 9±2 | 38±6 | 15±2 |
Values are means ± SD. ING, inguinal fat depot; EPI, epididymal fat depot; CR, calorie restricted; AL, ad libitum fed; 16:0, palmitate; 16:1, palmitoleate; 18:0, stearate; 18:1, oleate; 18:2, linoleate. **Significantly different from AL values (P < 0.001) by t-test.
Serum lipids in CR mice.
To determine whether changes in serum lipids reflect the pattern of feeding and fasting in CR mice, we measured serum NEFA and TG in CR and AL mice at 6 PM, before food was provided to CR mice, and 9 PM, 3 h after food was provided (Table 2). We found a significant increase in serum NEFA of CR mice compared with AL mice at 6 PM (0.87 ± 0.10 vs. 0.45 ± 0.02 meq/l) but no difference at 9 PM. In contrast, for serum TG, we found a significant increase in CR mice at 9 PM (81.0 ± 3.8 vs. 39.3 ± 1.9 mg/dl) but no difference at 6 PM. These data are consistent with a prolonged fasting period in CR mice until 6 PM, when food was provided, and then a rapid feeding phase immediately following.
Table 2.
Serum lipids
| CR |
AL |
|||
|---|---|---|---|---|
| 6 PM | 9 PM | 6 PM | 9 PM | |
| Serum NEFA, meq/l | 0.87±0.10† | 0.33±0.01 | 0.45±0.02 | 0.47±0.07 |
| Serum TG, mg/dl | 34.5±0.9* | 81.0±3.8† | 49.3±1.5 | 39.3±1.9 |
Values are means ± SE. NEFA, nonesterified fatty acids; TG, triglyceride.
*P < 0.01,
†P < 0.001, difference from time-matched AL values.
DISCUSSION
The experiments presented here demonstrate that CR, administered by daily feeding, leads to a unique pattern of fuel selection in mice characterized by a brief period of markedly increased endogenous FA synthesis in adipose tissue followed by a prolonged period of elevated whole body FA oxidation. This pattern is consistent with previous reports demonstrating diurnal changes in RER in calorie-restricted rats (12, 28). Here we confirm these metabolic effects with indirect calorimetry, stable isotope labeling, FA composition, and to some extent gene expression and demonstrate that the pattern is induced rapidly and persists as long as the mouse remains calorie restricted.
The metabolic adaptations to CR described here have implications for current hypotheses about the mechanisms mediating the effects of CR. In addition, our data provide insight into a time dependence of experimental designs for studying genetic adaptations to CR.
The data confirm the view that the absolute amount of whole body FA oxidation is higher in CR mice than in AL controls (15, 23, 38). This is, in fact, a remarkable result in the context of classic principles of whole body macronutrient balances (13, 44). After an initial 1- to 2-wk period of weight loss, CR mice reestablish a state of energy balance in which fat mass is preserved or even increased. The energy intake from fat in CR mice is ∼92 mg/day (2.3 g food/day × 4% fat in diet by weight), yet we measured by indirect calorimetry 367 mg fat oxidized/day in CR mice. The majority of fat oxidation occurred during the 12 h after feeding when mice were oxidizing exclusively fat (RER = 0.7; Fig. 3). Although there are limitations to estimating fat oxidation from indirect calorimetry (46), given that it accounts only for net changes, in this case, where RER values are 0.7 for so long, alternate interpretations are unlikely. Thus, the question remains, if CR mice oxidize a much greater quantity of FAs per day than dietary intake but remain weight stable, where does the FA substrate come from?
Quantitatively, we demonstrate that the increase in FA oxidation is almost entirely accounted for by an increase in endogenous FA synthesis in CR mice. Some previous reports had suggested that CR reduces endogenous FA synthesis on the basis of FAS and/or ACC1 expression in the liver (6, 7, 30, 38). Our stable isotope-based measurements of flux through the FA-synthetic pathway support the opposite conclusion. It should be noted that our calculations for endogenous FA synthesis are based on literature values for percent body fat in CR and AL from similarly aged and restricted C57BL/6 male mice. The literature values for percent body fat range from 15 to 30% for CR mice and 22 to 42% for AL mice. For a conservative estimate of FA synthesis in CR mice, we used the lower value of 15%. For the estimation of AL FA synthesis, we used the median value of 32%. In addition, any endogenously synthesized FAs that are oxidized rather than being stored in adipose tissue will not be detected by measurements on adipose tissue TGs. Thus, our measurements represent a lower bound estimate of FA synthesis in CR mice, yet account for the great majority of whole body FA oxidation in excess of dietary fat intake.
Adipose tissue, as opposed to the liver, may be the primary site for whole body endogenous FA synthesis in CR mice. Within 3 h of feeding, there was an accumulation of 14 mg of endogenously synthesized palmitate in the subcutaneous depot and another 3 mg in the epididymal tissue. In contrast, only 4 mg of endogenously synthesized palmitate accumulated in the liver over the same time period. In addition, in the first 3 h postfeeding, endogenously synthesized palmitate accumulated in the subcutaneous depot five times faster in CR mice than in AL controls, whereas in the liver and VLDL there was no difference in newly synthesized FA accumulation between these groups (Fig. 5, C and D). It is possible, although quantitatively unlikely, that a dramatic increase in VLDL-TG delivery to adipose tissue in CR mice could account for the accumulation of endogenously synthesized FAs in this tissue. This possibility may warrant further investigation. Glucose is likely the predominant substrate for FA synthesis in the adipose tissue. Consistent with adipose playing a role in FA synthesis, Wetter et al. (45) demonstrated that glucose uptake is increased in adipose tissue of calorie-restricted rats.
Several recent reports (5, 19, 20, 32, 42, 43) have proposed that palmitoleate (16:1) accumulates in adipose tissue or serum during times of increased FA synthesis and that increased palmitoleate content is a marker of FA synthesis in adipose tissue. Although we saw an increase in palmitate (16:0) content in adipose of CR mice, we did not observe an increase in palmitoleate content. Consistent with these data, the rate of palmitate synthesis was six times higher than the rate of palmitoleate in adipose tissue of CR mice (Fig. 4A). To our knowledge, this is the first report to compare palmitate and palmitoleate synthesis rates under conditions of increased FA synthesis. Palmitoleate accumulation does not appear to be a universal marker of endogenous FA synthesis. It is possible that the increase in palmitoleate accumulation observed in previous reports was related specifically to a change in diet, since animals were switched from a high-fat diet to a high-carbohydrate diet, which may alter stearoyl-CoA desaturase-1 activity (2, 8).
Liver FAS and ACC1 gene expression at a single time point did not necessarily reflect the expression pattern in calorie-restricted mice throughout the day. This previously unreported circadian pattern may have implications for future genomic studies in calorie-restricted mice. We observed that, at 6 PM, just before food was provided, FAS and ACC1 expression were 20- and 10-fold lower, respectively, in CR than in AL mice (Fig. 6, A and B). This is the same trend reported previously in several publications (6, 7, 30, 38) and has led to the conclusion that FA synthesis is decreased in CR. However, immediately after food was provided, FAS expression increased 50-fold in CR mice, leading to values nearly threefold higher than AL controls (Fig. 6A). In the same period, ACC1 expression increased 16-fold in CR mice, leading to values twofold higher than the AL group (Fig. 6B). This increase in FAS and ACC1 expression correlated with a relatively small but statistically significant increase in FA synthesis in the livers of CR mice. Unfortunately, most studies investigating the changes in gene expression patterns in response to CR have measured expression at one time point, and in some cases animals were fasted overnight (6, 30), masking the time-dependent gene expression pattern. Furthermore, it is likely that the expression of other metabolic genes is influenced by this unique circadian pattern. We believe that future studies into the physiological, metabolic, and genomic adaptations to CR must take into account this cyclical metabolic pattern.
A larger question is whether this diurnal fuel selection pattern plays a role in mediating the effects of CR on health and longevity. The pattern of food intake observed in response to CR is, in fact, a form of intermittent fasting. Other intermittent fasting protocols, most notably alternate day fasting, have been shown to slow tumor growth, decrease cell proliferation, improve insulin sensitivity, and increase longevity, perhaps without a concomitant decrease in body weight (41). It should be noted that Nelson and Halberg (31) demonstrated that CR provided as six meals per day increased longevity to an extent equal to CR provided as one meal per day. Yet, it is possible that some of the effects of CR may be mediated by intermittent energy intake rather than or in addition to altered body composition.
One potential effect of CR that may be mediated by intermittent fasting is a reduced production of ROS. It has been hypothesized that an increased reliance on FA oxidation could lead to decreased ROS production, because FA oxidation increases the FADH/NADH ratio compared with carbohydrate oxidation (15). Although NADH donates electrons to complex I of the electron transport chain, FADH donates electrons directly to complex II, the electron transfer flavoprotein dehydrogenase, which then passes the electrons to complex III via ubiquinone. Therefore, FADH oxidation bypasses complex I, which is a major contributor to cellular ROS production (21, 24). An interesting question for future research is whether the effects of CR on ROS production depend upon the cyclic stimulation of FA synthesis.
In conclusion, we have characterized a unique feeding and macronutrient metabolic pattern in CR mice associated with a dramatic increase in whole body FA oxidation and a marked increase in adipose tissue FA synthesis. This pattern is rapidly induced, influences the daily pattern of gene expression, and may provide a metabolic switch that translates the dietary changes of CR into a program of health and survival.
GRANTS
This study was supported in part by NIH Grant R01-AG-034297-ARRA.
DISCLOSURES
The authors have no conflicts of interest to report.
ACKNOWLEDGMENTS
We thank Richard Neese, Mark Fitch, Simply Floracruz, Robby Pixton, Alicia White, and D. J. Rhook for their outstanding technical support. We also thank Larry Thompson for amazing commitment and help.
REFERENCES
- 1. Anderson RM, Shanmuganayagam D, Weindruch R. Caloric restriction and aging: studies in mice and monkeys. Toxicol Pathol 37: 47–51, 2009 [DOI] [PMC free article] [PubMed] [Google Scholar]
- 2. Bassilian S, Ahmed S, Lim SK, Boros LG, Mao CS, Lee WN. Loss of regulation of lipogenesis in the Zucker diabetic rat. II. Changes in stearate and oleate synthesis. Am J Physiol Endocrinol Metab 282: E507–E513, 2002 [DOI] [PubMed] [Google Scholar]
- 3. Berrigan D, Lavigne JA, Perkins SN, Nagy TR, Barrett JC, Hursting SD. Phenotypic effects of calorie restriction and insulin-like growth factor-1 treatment on body composition and bone mineral density of C57BL/6 mice: implications for cancer prevention. In Vivo 19: 667–674, 2005 [PubMed] [Google Scholar]
- 4. Brochmann EJ, Duarte ME, Zaidi HA, Murray SS. Effects of dietary restriction on total body, femoral, and vertebral bone in SENCAR, C57BL/6, and DBA/2 mice. Metabolism 52: 1265–1273, 2003 [DOI] [PubMed] [Google Scholar]
- 5. Cao H, Gerhold K, Mayers JR, Wiest MM, Watkins SM, Hotamisligil GS. Identification of a lipokine, a lipid hormone linking adipose tissue to systemic metabolism. Cell 134: 933–944, 2008 [DOI] [PMC free article] [PubMed] [Google Scholar]
- 6. Cao SX, Dhahbi JM, Mote PL, Spindler SR. Genomic profiling of short- and long-term caloric restriction effects in the liver of aging mice. Proc Natl Acad Sci USA 98: 10630–10635, 2001 [DOI] [PMC free article] [PubMed] [Google Scholar]
- 7. Chen D, Bruno J, Easlon E, Lin SJ, Cheng HL, Alt FW, Guarente L. Tissue-specific regulation of SIRT1 by calorie restriction. Genes Dev 22: 1753–1757, 2008 [DOI] [PMC free article] [PubMed] [Google Scholar]
- 8. Chong MF, Hodson L, Bickerton AS, Roberts R, Neville M, Karpe F, Frayn KN, Fielding BA. Parallel activation of de novo lipogenesis and stearoyl-CoA desaturase activity after 3 d of high-carbohydrate feeding. Am J Clin Nutr 87: 817–823, 2008 [DOI] [PubMed] [Google Scholar]
- 9. Colman RJ, Nam G, Huchthausen L, Mulligan JD, Saupe KW. Energy restriction-induced changes in body composition are age specific in mice. J Nutr 137: 2247–2251, 2007 [DOI] [PubMed] [Google Scholar]
- 10. Dhahbi JM, Kim HJ, Mote PL, Beaver RJ, Spindler SR. Temporal linkage between the phenotypic and genomic responses to caloric restriction. Proc Natl Acad Sci USA 101: 5524–5529, 2004 [DOI] [PMC free article] [PubMed] [Google Scholar]
- 11. Dimopoulos N, Watson M, Sakamoto K, Hundal HS. Differential effects of palmitate and palmitoleate on insulin action and glucose utilization in rat L6 skeletal muscle cells. Biochem J 399: 473–481, 2006 [DOI] [PMC free article] [PubMed] [Google Scholar]
- 12. Duffy PH, Feuers RJ, Leakey JA, Nakamura K, Turturro A, Hart RW. Effect of chronic caloric restriction on physiological variables related to energy metabolism in the male Fischer 344 rat. Mech Ageing Dev 48: 117–133, 1989 [DOI] [PubMed] [Google Scholar]
- 13. Flatt JP. Body composition, respiratory quotient, and weight maintenance. Am J Clin Nutr 62: 1107S–1117S, 1995 [DOI] [PubMed] [Google Scholar]
- 14. Gredilla R, Barja G. Minireview: the role of oxidative stress in relation to caloric restriction and longevity. Endocrinology 146: 3713–3717, 2005 [DOI] [PubMed] [Google Scholar]
- 15. Guarente L. Mitochondria—a nexus for aging, calorie restriction, and sirtuins? Cell 132: 171–176, 2008 [DOI] [PMC free article] [PubMed] [Google Scholar]
- 16. Hamrick MW, Ding KH, Ponnala S, Ferrari SL, Isales CM. Caloric restriction decreases cortical bone mass but spares trabecular bone in the mouse skeleton: implications for the regulation of bone mass by body weight. J Bone Miner Res 23: 870–878, 2008 [DOI] [PubMed] [Google Scholar]
- 17. Heilbronn LK, Ravussin E. Calorie restriction and aging: review of the literature and implications for studies in humans. Am J Clin Nutr 78: 361–369, 2003 [DOI] [PubMed] [Google Scholar]
- 18. Hong J, Stubbins RE, Smith RR, Harvey AE, Núñez NP. Differential susceptibility to obesity between male, female and ovariectomized female mice. Nutr J 8: 11, 2009 [DOI] [PMC free article] [PubMed] [Google Scholar]
- 19. Kunesova M, Braunerova R, Hlavaty P, Tvrzicka E, Stankova B, Skrha J, Hilgertova J, Hill M, Kopecky J, Wagenknecht M, Hainer V, Matoulek M, Parizkova J, Zak A, Svacina S. The influence of n-3 polyunsaturated fatty acids and very low calorie diet during a short-term weight reducing regimen on weight loss and serum fatty acid composition in severely obese women. Physiol Res 55: 63–72, 2006 [DOI] [PubMed] [Google Scholar]
- 20. Kunesova M, Hainer V, Tvrzicka E, Phinney SD, Stich V, Parizkova J, Zak A, Stunkard AJ. Assessment of dietary and genetic factors influencing serum and adipose fatty acid composition in obese female identical twins. Lipids 37: 27–32, 2002 [DOI] [PubMed] [Google Scholar]
- 21. Kushnareva Y, Murphy AN, Andreyev A. Complex I-mediated reactive oxygen species generation: modulation by cytochrome c and NAD(P)+ oxidation-reduction state. Biochem J 368: 545–553, 2002 [DOI] [PMC free article] [PubMed] [Google Scholar]
- 22. Lee WN, Bassilian S, Guo Z, Schoeller D, Edmond J, Bergner EA, Byerley LO. Measurement of fractional lipid synthesis using deuterated water (2H2O) and mass isotopomer analysis. Am J Physiol Endocrinol Metab 266: E372–E383, 1994 [DOI] [PubMed] [Google Scholar]
- 23. Lopez-Lluch G, Irusta PM, Navas P, de Cabo R. Mitochondrial biogenesis and healthy aging. Exp Gerontol 43: 813–819, 2008 [DOI] [PMC free article] [PubMed] [Google Scholar]
- 24. Lopez-Torres M, Gredilla R, Sanz A, Barja G. Influence of aging and long-term caloric restriction on oxygen radical generation and oxidative DNA damage in rat liver mitochondria. Free Radic Biol Med 32: 882–889, 2002 [DOI] [PubMed] [Google Scholar]
- 25. Lusk G. Analysis of the oxidation of mixtures of carbohydrate and fat: a Correction. J Biol Chem 59: 2, 1924 [Google Scholar]
- 26. Mai V, Colbert LH, Berrigan D, Perkins SN, Pfeiffer R, Lavigne JA, Lanza E, Haines DC, Schatzkin A, Hursting SD. Calorie restriction and diet composition modulate spontaneous intestinal tumorigenesis in Apc(Min) mice through different mechanisms. Cancer Res 63: 1752–1755, 2003 [PubMed] [Google Scholar]
- 27. Masoro EJ. Caloric restriction and aging: an update. Exp Gerontol 35: 299–305, 2000 [DOI] [PubMed] [Google Scholar]
- 28. Masoro EJ, McCarter RJ, Katz MS, McMahan CA. Dietary restriction alters characteristics of glucose fuel use. J Gerontol 47: B202–B208, 1992 [DOI] [PubMed] [Google Scholar]
- 29. Merry BJ. Molecular mechanisms linking calorie restriction and longevity. Int J Biochem Cell Biol 34: 1340–1354, 2002 [DOI] [PubMed] [Google Scholar]
- 30. Mulligan JD, Stewart AM, Saupe KW. Downregulation of plasma insulin levels and hepatic PPARgamma expression during the first week of caloric restriction in mice. Exp Gerontol 43: 146–153, 2008 [DOI] [PMC free article] [PubMed] [Google Scholar]
- 31. Nelson W, Halberg F. Meal-timing, circadian rhythms and life span of mice. J Nutr 116: 2244–2253, 1986 [DOI] [PubMed] [Google Scholar]
- 32. Parks EJ, Skokan LE, Timlin MT, Dingfelder CS. Dietary sugars stimulate fatty acid synthesis in adults. J Nutr 138: 1039–1046, 2008 [DOI] [PMC free article] [PubMed] [Google Scholar]
- 33. Schutz Y. Concept of fat balance in human obesity revisited with particular reference to de novo lipogenesis. Int J Obes Relat Metab Disord 28, Suppl 4: S3–S11, 2004 [DOI] [PubMed] [Google Scholar]
- 34. Sinclair DA. Toward a unified theory of caloric restriction and longevity regulation. Mech Ageing Dev 126: 987–1002, 2005 [DOI] [PubMed] [Google Scholar]
- 35. Sohal RS, Weindruch R. Oxidative stress, caloric restriction, and aging. Science 273: 59–63, 1996 [DOI] [PMC free article] [PubMed] [Google Scholar]
- 36. Spindler SR, Dhahbi JM. Conserved and tissue-specific genic and physiologic responses to caloric restriction and altered IGFI signaling in mitotic and postmitotic tissues. Annu Rev Nutr 27: 193–217, 2007 [DOI] [PubMed] [Google Scholar]
- 37. Strawford A, Antelo F, Christiansen M, Hellerstein MK. Adipose tissue triglyceride turnover, de novo lipogenesis, and cell proliferation in humans measured with 2H2O. Am J Physiol Endocrinol Metab 286: E577–E588, 2004 [DOI] [PubMed] [Google Scholar]
- 38. Tsuchiya T, Dhahbi JM, Cui X, Mote PL, Bartke A, Spindler SR. Additive regulation of hepatic gene expression by dwarfism and caloric restriction. Physiol Genomics 17: 307–315, 2004 [DOI] [PubMed] [Google Scholar]
- 39. Turner SM, Murphy EJ, Neese RA, Antelo F, Thomas T, Agarwal A, Go C, Hellerstein MK. Measurement of TG synthesis and turnover in vivo by 2H2O incorporation into the glycerol moiety and application of MIDA. Am J Physiol Endocrinol Metab 285: E790–E803, 2003 [DOI] [PubMed] [Google Scholar]
- 40. Varady KA, Allister CA, Roohk DJ, Hellerstein MK. Improvements in body fat distribution and circulating adiponectin by alternate-day fasting versus calorie restriction. J Nutr Biochem. In press. [DOI] [PubMed] [Google Scholar]
- 41. Varady KA, Hellerstein MK. Alternate-day fasting and chronic disease prevention: a review of human and animal trials. Am J Clin Nutr 86: 7–13, 2007 [DOI] [PubMed] [Google Scholar]
- 42. Volek JS, Phinney SD, Forsythe CE, Quann EE, Wood RJ, Puglisi MJ, Kraemer WJ, Bibus DM, Fernandez ML, Feinman RD. Carbohydrate restriction has a more favorable impact on the metabolic syndrome than a low fat diet. Lipids 44: 297–309, 2009 [DOI] [PubMed] [Google Scholar]
- 43. Watkins SM, Reifsnyder PR, Pan HJ, German JB, Leiter EH. Lipid metabolome-wide effects of the PPARgamma agonist rosiglitazone. J Lipid Res 43: 1809–1817, 2002 [DOI] [PubMed] [Google Scholar]
- 44. Westerterp KR. Food quotient, respiratory quotient, and energy balance. Am J Clin Nutr 57: 759S–764S; discussion 764S–765S, 1993 [DOI] [PubMed] [Google Scholar]
- 45. Wetter TJ, Gazdag AC, Dean DJ, Cartee GD. Effect of calorie restriction on in vivo glucose metabolism by individual tissues in rats. Am J Physiol Endocrinol Metab 276: E728–E738, 1999 [DOI] [PubMed] [Google Scholar]
- 46. Wolfe RR. Isotope Tracers in Metabolic Research. Hoboken, NJ: Wiley & Sons, 2005 [Google Scholar]