Abstract
Meiotic recombination promotes genetic diversification as well as pairing and segregation of homologous chromosomes, but the double-strand breaks (DSBs) that initiate recombination are dangerous lesions that can cause mutation or meiotic failure. How cells control DSBs to balance between beneficial and deleterious outcomes is not well understood. This study tests the hypothesis that DSB control involves a network of intersecting negative regulatory circuits. Using multiple complementary methods, we show that DSBs form in greater numbers in Saccharomyces cerevisiae cells lacking ZMM proteins, a suite of recombination-promoting factors traditionally regarded as acting strictly downstream of DSB formation. ZMM-dependent DSB control is genetically distinct from a pathway tying break formation to meiotic progression through the Ndt80 transcription factor. These counterintuitive findings suggest that homologous chromosomes that have successfully engaged one another stop making breaks. Genome-wide DSB maps uncover distinct responses by different subchromosomal domains to the zmm mutation zip3, and show that Zip3 is required for the previously unexplained tendency of DSB density to vary with chromosome size. Thus, feedback tied to ZMM function contributes in unexpected ways to spatial patterning of recombination.
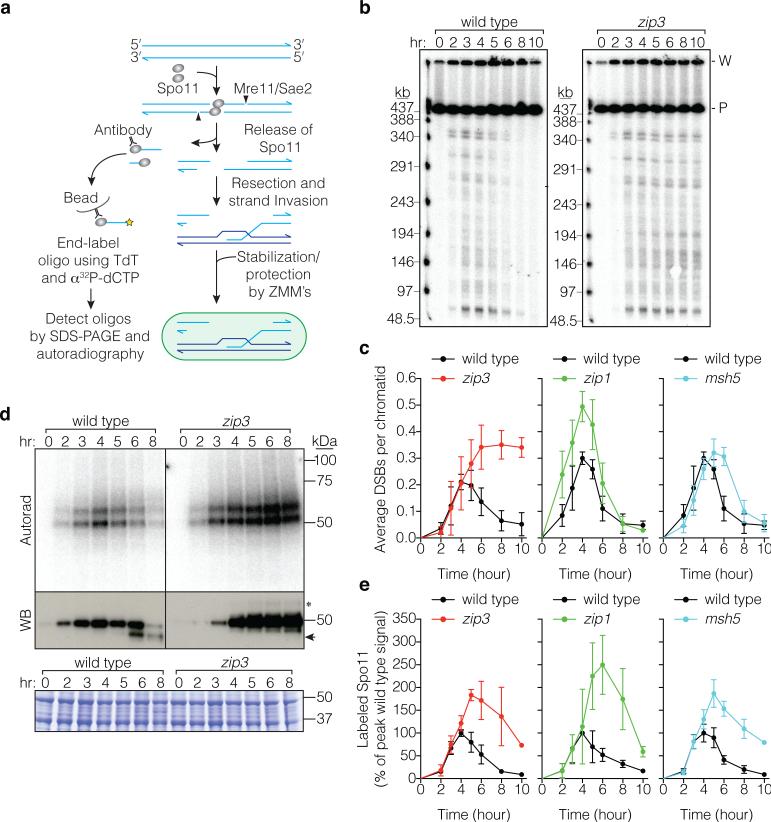
DSBs are hazardous genomic damage that most cells avoid but that each meiotic cell introduces in large numbers, so cells tightly regulate activity of Spo11, the protein that makes DSBs1. Typical depictions of recombination pathway(s) (Fig. 1a) implicitly divide involved proteins into upstream (DSB formation) and downstream factors (DSB repair). This view suggests that eliminating downstream factors will have little or no effect on number or distribution of upstream events (DSBs). An alternative view considers recombination genome-wide, not just at any one site: DSBs do not form all at once, so fates of early DSBs might govern whether and where later DSBs form. In this scenario, downstream factors may behave genetically as upstream factors if their absence disrupts feedback circuits.
Figure 1. More DSBs form in zmm mutants.
a, Spo11 generates a covalent protein-linked DSB; endonucleolytic cleavage releases Spo11 bound to a short oligo (detection method at left). Resection is followed by strand invasion and ZMM-dependent stabilization of intermediates fated to become crossovers. b, c, Representative pulsed-field gel Southern blots probed for Chr IX are in b and Poisson-corrected DSB quantification in c (mean ± SD, 3 cultures). P, parental; W, wells. d, e, Representative Spo11-oligo complex time courses are in d and quantification in e (mean ± SD for 3 cultures, except at 10 hr for msh5 and zip3 analyses (1 culture)). Radiolabeled Spo11-oligo complexes were detected by autoradiography (top panels) and total Spo11 was detected by anti-flag western blot (WB, middle). The main labeled species differ in oligo size10. Nearly all of the WB signal is Spo11 that has not made a DSB10. Asterisk, species co-migrating with upper Spo11-oligo complexes; arrowhead, proteolytic product. Extract samples run separately and stained with Coomassie control for input to the IPs (bottom). In panels c and e, mutants are plotted with wild-type data collected in parallel.
Precedents for feedback are known in several organisms. In mice, yeast, and flies, ATM kinase governs a negative feedback loop inhibiting DSB formation in response to breaks2-5. In mice, flies, and worms, defective interhomolog interactions are known or hypothesized to allow continued DSB formation, suggesting another type of feedback6-8. The logic of these circuits predicts different behavior in DSB repair mutants: the ATM-type circuit should suppress further DSB formation if existing breaks cannot be repaired, but, conversely, defective interhomolog interactions caused by repair defects might instead allow more DSBs to accumulate. We test these predictions here and ask whether feedback contributes to the spatial organization of recombination. We focus on the ZMM proteins in Saccharomyces cerevisiae (Zip1–4, Msh4–5, Mer3, Spo16, and Pph3). These biochemically diverse factors shepherd recombination intermediates toward a crossover fate and help build synaptonemal complexes (SC), so zmm null mutations cause recombination and SC defects, with varying degrees of meiotic arrest9.
Elevated DSB numbers in zmm mutants
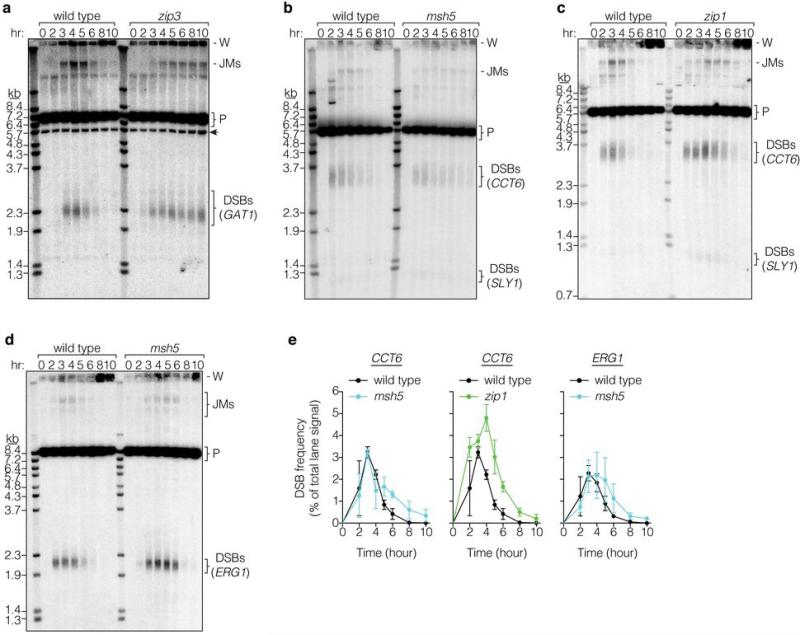
We measured DSBs by Southern blotting whole chromosomes separated on pulsed-field gels (Fig. 1b,c). In wild type, chromosome fragments appeared and disappeared as DSBs were formed and repaired, as expected. In contrast, broken chromosomes accumulated in zip3 mutants for at least 2 hr after DSBs waned in wild type, reaching a plateau 1.7-fold higher than the wild-type peak and persisting for hours (Fig. 1c). (This underestimates DSBs because zip3 mutants complete some repair (below).) In zip1, broken chromosomes reached higher levels than wild type before disappearing, and in msh5, time-averaged DSB levels were higher than wild type but the maximum was only slightly elevated (Fig. 1c, Extended Data Fig. 1). Differences in arrest may account for variation between mutants at later times (Supplementary Discussion). In principle, elevated steady-state DSBs could reflect extended lifespan, increased frequency, or both. Since these measurements cannot distinguish between these possibilities, we applied a battery of methods that offset limitations of any one approach.
Extended Data Figure 1. Chromosomal breaks in msh5 and zip1 mutants.
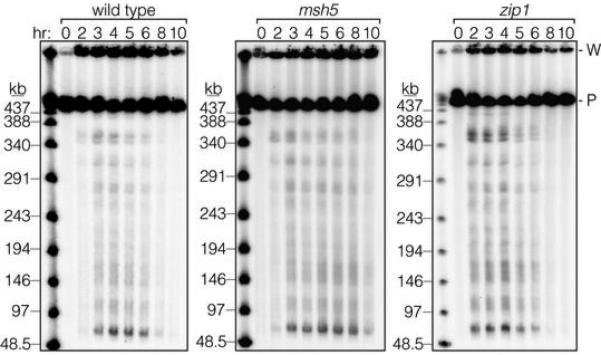
Representative pulsed-field gel Southern blots probed for Chr IX are shown, labeled as in Fig. 1b.
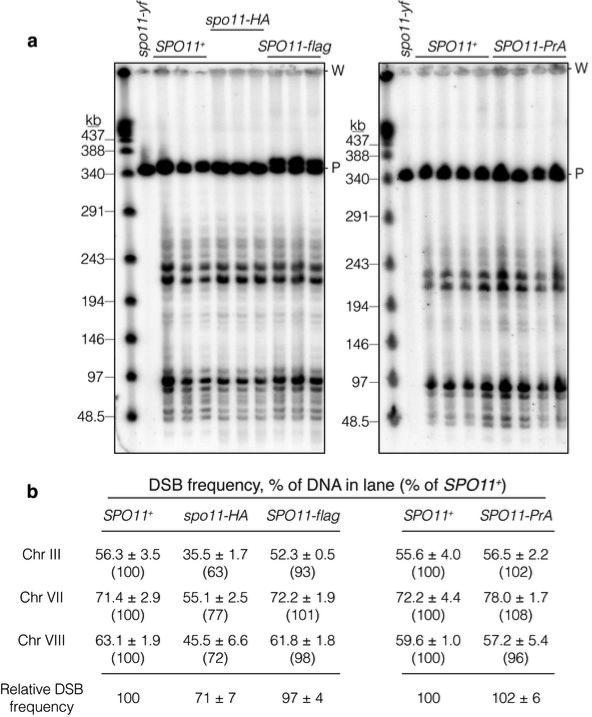
To assess DSBs globally and mitigate uncertainty from repair defects, we examined Spo11-oligonucleotide (oligo) complexes, by-products of DSB formation that can be used to measure DSB number and distribution2,10,11 (Fig. 1a). Extracts were prepared from cultures expressing phenotypically normal flag-tagged Spo11 (Extended Data Fig. 2). Anti-flag immunoprecipitates were labeled with terminal transferase and [α32P]dCTP, resolved by SDS-PAGE, then labeled Spo11-oligo complexes were detected by phosphorimager and total Spo11 was detected by western blotting (Fig. 1d). In wild type, Spo11-oligo complexes appeared contemporaneously with DSBs, peaked at ~4 hr, then declined (Fig. 1d,e). In zip3, Spo11-oligo complexes first appeared with similar timing and levels as wild type, but continued to accumulate after 4 hr (Fig. 1d,e). Spo11-oligo levels reached a maximum at ~5 hr that was 1.8-fold higher than the wild-type peak and remained high after most complexes had disappeared in wild type (altered accumulation of free Spo11 protein is likely due to arrest (Supplementary Discussion)). Similar patterns were seen in msh5 and zip1 (Fig. 1e, Extended Data Fig. 3). If turnover of DSBs and Spo11-oligo complexes is separable, these findings imply that zmm mutants make more breaks.
Extended Data Figure 2. DSB formation appears normal in SPO11-flag and SPO11-PrA strains.
a, Southern blots probed for Chr III. High molecular weight chromosomal DNA was purified 6 hr after transfer to sporulation medium from meiotic rad50S cultures carrying the indicated SPO11 alleles (in spo11-yf the catalytic tyrosine 135 is mutated to phenylalanine), then separated on pulsed-field electrophoresis gels. Samples from a rad50S spo11-HA strain are shown for comparison; HA-tagged Spo11 has reduced DSB frequency. Each lane represents an independent culture (SPO11+ samples from the same cultures were run on both gels). P, parental-length DNA; W, wells. b, Quantification of blots in panel a and separate blots (not shown) probed for Chr VII or VIII. Break frequencies are percent of DNA in lane (mean ± SD of 3–4 cultures). Numbers in parentheses indicate values from each tagged strain relative to SPO11+ for the same chromosome. Relative DSB frequencies at the bottom are averages across the three chromosomes assayed.
Extended Data Figure 3. Spo11-oligo complexes in msh5 and zip1.
Representative time courses are shown.
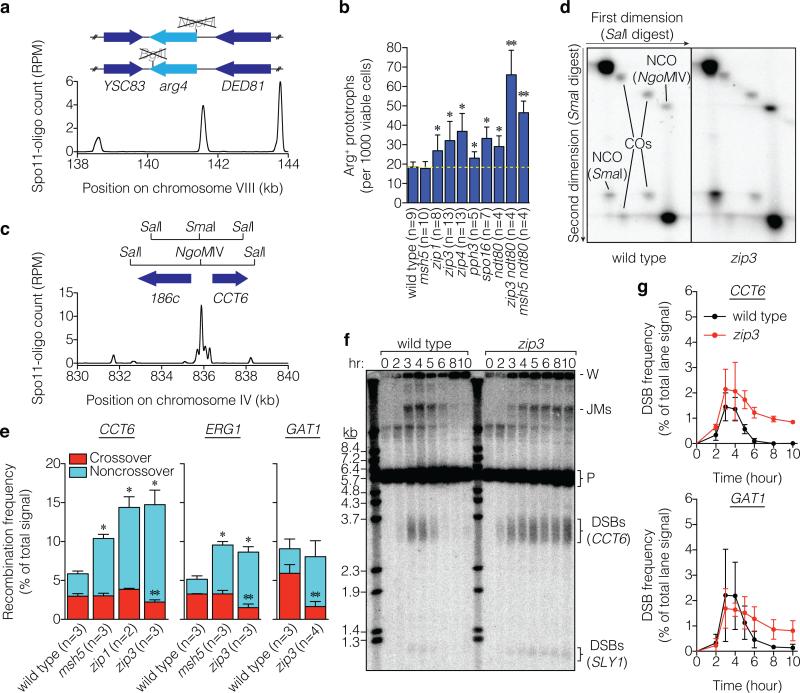
If so, then more repair products should also accumulate. To gauge interhomolog recombination, we used strains heterozygous for different arg4 mutations (Fig. 2a). Prophase cells transferred to rich medium abort meiosis, often completing recombination even if unable while still in meiosis12. All zmm mutants tested except msh5 formed more Arg+ prototrophs than wild type (Fig. 2b). Elevated recombination has been reported in all zmm mutants examined (including msh4 and msh5), but was not interpreted as evidence for elevated DSB frequency13-19 (Supplementary Table 1). Thus, a context-dependent hyper-rec phenotype is a common but previously unrecognized property of zmm mutants.
Figure 2. Hyper-rec phenotype of zmm mutants.
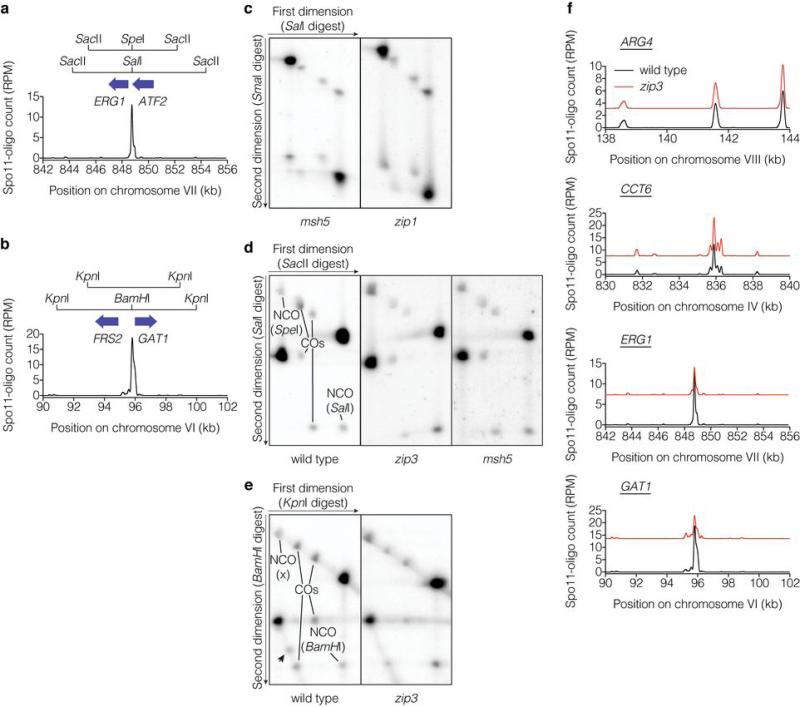
a, Schematic of arg4 heteroalleles, showing ORFs and mutated restriction sites. Below, Spo11-oligo profile shows DSB distribution (RPM, reads per million mapped; smoothed with 201-bp Hann window). b, Heteroallele recombination frequencies (mean ± SD). *, significantly different from wild type (p<0.02, t test); **, significantly different from ndt80 (p<0.006). c, Recombination reporter at the CCT6 hotspot. d, Representative Southern blots of parental and recombinant DNA molecules (crossovers (COs) and noncrossover gene conversions (NCOs)) at CCT6 resolved by two-dimensional gel electrophoresis. e, Recombination frequencies (mean ± SD). Crossover frequencies were halved to convert to per-DSB equivalent because each crossover yields two recombinant molecules. *, total recombination significantly different from wild type (p<0.003); **, crossing over significantly different from wild type (p<0.04). f, g, DSBs at CCT6 and GAT1. A representative Southern blot probed for CCT6 is in f and quantifications for CCT6 and GAT1 are in g (mean ± SD for 3 cultures, except 8 hr for zip3 at GAT1, analyzed twice). JMs, joint molecules; P, parental; W, wells.
We explored this hyper-rec behavior by quantifying recombinants at three natural DSB hotspots (Fig. 2c, Extended Data Fig. 4a,b). At each, allelic copies have different flanking and central restriction sites. Crossovers and parental length fragments are resolved by electrophoresis after digestion with flanking enzymes, then DNA is digested in the gel with the central enzyme prior to electrophoresis in the orthogonal dimension. Noncrossover gene conversion molecules co-migrate with one parent in the first dimension but have a central restriction site matching the other parent (Fig. 2d, Extended Data Fig. 4c–e). Key features are that the hotspots are high-intensity with few/no other DSB sites nearby, and central polymorphisms are positioned to make incorporation into heteroduplex DNA likely. At CCT6 and ERG1, recombinant molecules were 1.7–2.5 fold more abundant in the zmm mutants tested, with elevated noncrossovers and crossovers at or below wild-type levels (Fig. 2e). At GAT1, zip3 displayed fewer crossovers offset by more noncrossovers, for a net frequency comparable to wild type (Fig. 2e). (Refer to Supplementary Discussion of gene conversion tracts and sister chromatid recombination.) These findings reinforce the conclusion that zmm mutations cause a hyper-rec phenotype that is variable between loci.
Extended Data Figure 4. Analysis of recombination at three natural DSB hotspots.
a, b, Recombination reporters at the ERG1 (a) and GAT1 (b) hotspots. c, d, e, Representative Southern blots of parental and recombinant DNA molecules at CCT6 (c), ERG1 (d), and GAT1 (e). The arrowhead in e indicates a non-reproducible radiolabeled species. f, Local distribution of DSBs around recombination reporter locations is not altered in zip3 mutants. Spo11-oligo profiles (averages for wild type and zip3) are smoothed with 201-bp Hann window; zip3 values are offset to separate profiles.
DSBs were present at CCT6 and GAT1 in zip3 at late times, well past when most DSBs had disappeared in wild type (Fig. 2f,g, Extended Data Fig. 5a). Recombination intermediates (“joint molecules”) that are transient in wild type were also detected late in zip3. DSBs and joint molecules at CCT6 were also present in zip1 and msh5 later than in wild type but not as long as in zip3, similar to analysis of breaks on Chr IX (Extended Data Fig. 5b-e). These results agree with data at artificial hotspots in zmm mutants (e.g., ref. 20), but it was not previously possible to evaluate whether DSB numbers were increased and most prior studies dismissed or did not consider this possibility (Supplementary Table 1). We can now combine DSB data with quantification of recombination intermediates and products (Supplementary Table 2): this bookkeeping reveals that msh5, zip1, and zip3 mutants experience 1.8 to 2.6-fold more detectable DSB-related events at CCT6. Recombination product overabundance yields the same conclusion for zip3 and msh5 at ERG1 (1.7 to 1.9-fold), whereas wild type and zip3 had similar totals at GAT1. We conclude that zmm mutants incur more DSBs, but to varying degrees at different loci.
Extended Data Figure 5. Direct analysis of DSB formation at natural hotspots.
Representative Southern blots of DNA separated on a conventional agarose gel and probed for GAT1 (a), CCT6 (b, c), and ERG1 (d). JMs, joint molecules; P, parental-length DNA; W, wells. The arrowhead in a indicates signal from the CCT6 parental band that remained after stripping and reprobing for GAT1. e, Quantifications for b, c, d (mean ± SD for 3 cultures).
Separate pathways controlling DSB number
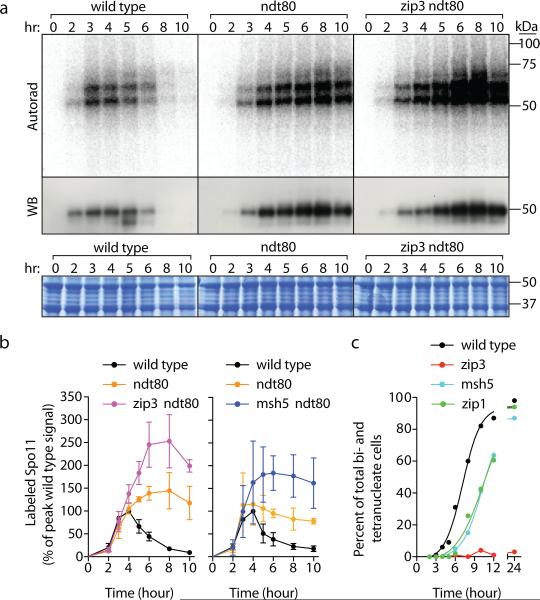
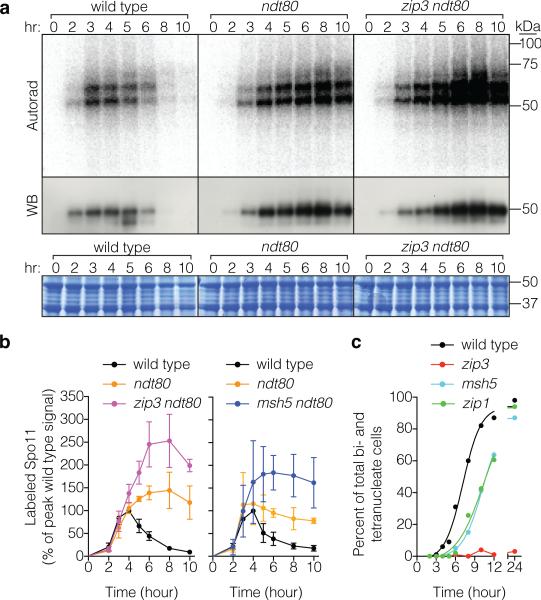
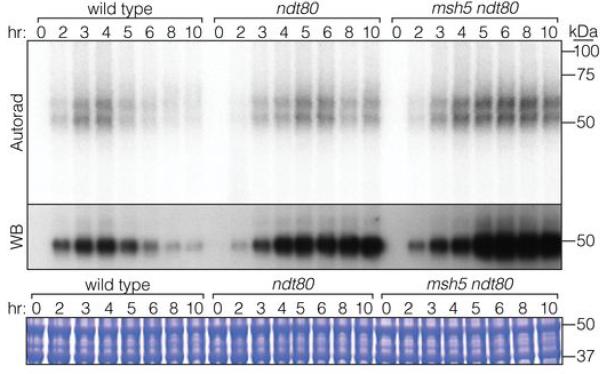
Recombination products and DSBs accumulate in cells lacking Ndt80, a transcription factor controlling pachytene exit12,21, so it was suggested that this stage in prophase ends a period permissive for DSB formation1,21, further supported by recent studies5,22,23. Indeed, Spo11-oligo complexes reached 1.2 to 1.4-fold higher than the wild-type maximum and remained high through late times in ndt80 (Fig. 3a,b, Extended Data Fig. 6). Heteroallele recombination was also elevated (1.6-fold, Fig. 2b). Pachytene delay/arrest via Ndt80 inhibition is a hallmark of zmm mutants9,24, suggesting that increased DSBs might be an indirect consequence of arrest22, perhaps analogous to elevated DSB numbers when CHK-2 kinase activity is prolonged in C. elegans25,26. If so, then zmm mutations should cause no change if Ndt80 is absent. However, more Spo11-oligo complexes (Fig. 3a,b, Extended Data Fig. 6) and heteroallele recombinants (Fig. 2b) accrued in zip3 ndt80 and msh5 ndt80 double mutants than in ndt80 single mutants. Furthermore, msh5, zip1, and zip3 had similarly elevated Spo11-oligo complexes (Fig. 1e) despite different arrest phenotypes (Fig. 3c). Thus, while the zmm DSB phenotype is probably influenced by the combined effects of Ndt80 inhibition and a hyper-activated DNA damage response, meiotic arrest per se does not explain zmm-provoked DSB elevation.
Figure 3. Separable effects of ndt80 and zmm mutations.
a, b, Spo11-oligo complex labeling from representative time courses is in a and quantification from ≥ 3 cultures (mean ± SD) is in b. c, Meiotic progression (percent of cells completing the first division).
Extended Data Figure 6. Spo11-oligo complexes in msh5 ndt80.
Representative time courses are shown.
Instead, we infer that a ZMM-dependent process(es) is more directly responsible for inhibiting DSB formation. A plausible mechanism is that chromosomes that have engaged their homologs undergo structural changes that render them unfit Spo11 substrates8,27. “Homolog engagement” could mean SC formation and/or progression of crossover-designated recombination intermediates, both promoted by ZMMs. Supporting this model, DSB-promoting factors Hop1 and Red1 accumulate on chromosomes in zmm mutants28, proteins required for DSBs are displaced from pachytene chromosomes in wild-type yeast (e.g., ref 29), and Hop1 orthologs are displaced after synapsis in yeast and mouse27,28.
Hyper-rec behavior in zmm mutants is reconciled with tetrad data demonstrating globally reduced crossing over (e.g., ref 30) by noting that there is a reduced per-DSB likelihood of generating a crossover that offsets increased DSBs (Supplementary Discussion). Our findings can also be reconciled with studies that attributed persistent DSBs in zmm mutants solely to increased DSB lifespan because, where tested, zmm and ZMM+ were similar in rad50S or dmc1 backgrounds19,20,31-33 (Extended Data Fig. 7a,b). Dmc1 is an essential strand exchange protein and rad50S mutants cannot remove Spo11 from DSB ends. Since these mutations block recombination before ZMM proteins act, they are uninformative for querying zmm effects. This caveat may also apply to recombination-defective mutants in other organisms.
Extended Data Figure 7. Effects of dmc1 deletion or spo11 hypomorphic mutation on zmm mutant phenotypes.
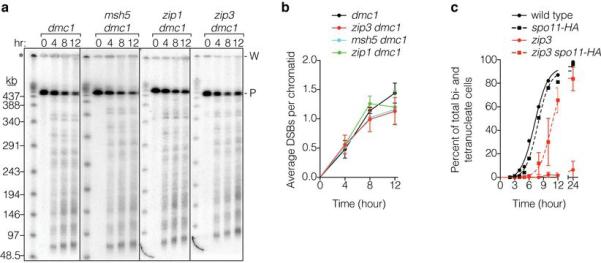
a, b, ZMM status is irrelevant in a dmc1 background. Broken chromosomes accumulate to similar levels in a dmc1 single mutant and dmc1 zmm double mutants. Representative pulsed-field gel Southern blots probed for Chr IX are in a and Poisson-corrected quantification of DSBs is in b (mean ± SD, 3 cultures). P, parental; W, wells. c, Reducing Spo11 activity in a zip3 mutant partially alleviates the prophase I delay/arrest. Meiotic progression was assessed by staining with DAPI and measuring the percentage of cells that had completed MI (±MII). Data are means ± SD for 3 cultures, except wild type and spo11-HA, each analyzed once.
Shaping the DSB landscape
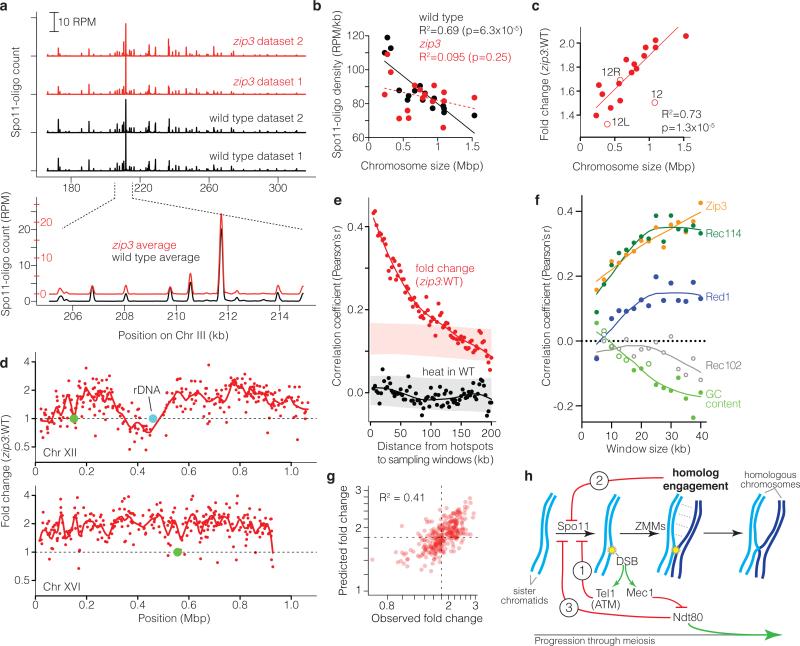
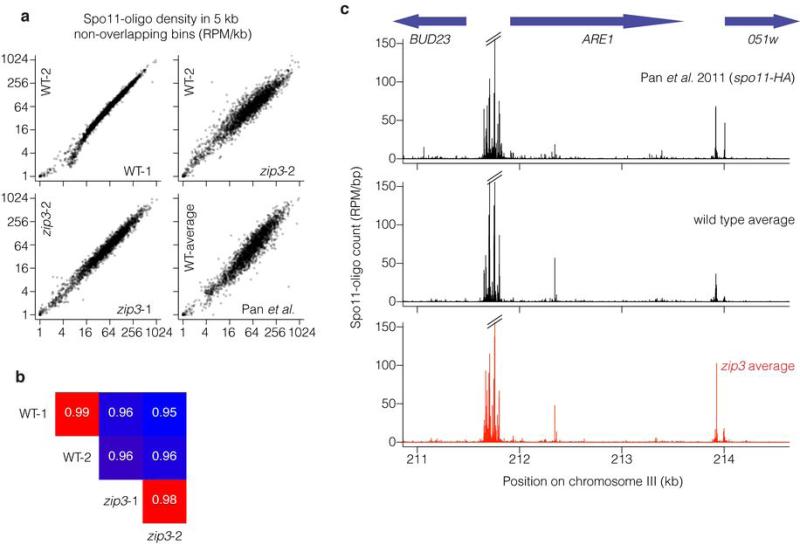
If ZMM-dependent feedback works via chromosome structure changes linked to homolog engagement, then it should be spatially patterned. We tested this by deep-sequencing Spo11 oligos to map DSBs (Fig. 4a, Supplementary Table 3). Control cultures with a fully functional Spo11-protein A fusion agreed with each other and previous results11 (Extended Data Figs. 2, 8 and data not shown). The DSB “landscape” is shaped by combinatorial action of many factors that operate hierarchically11,34. At short scales (sub-kb), the landscape is dominated by hotspots, mostly in nucleosome-depleted promoters. This pattern was unaffected in zip3, in that DSBs formed in the same hotspots (Fig. 4a, Extended Data Figs. 4f and 8c, Supplementary Table 4).
Figure 4. Altered DSB distribution in zip3 mutants.
a, Upper, reproducibility of Spo11-oligo maps. Lower, DSBs form at the same hotspots in zip3 as wild type. Smoothed with 201-bp Hann window. b, Zip3 is required for chromosome size-dependent variation in Spo11-oligo density. Lines, least squares fits (dashed = not significant). c, Larger chromosomes experience greater increase in Spo11 oligos. Fold change is the per-chromosome Spo11-oligo density in zip3 over wild type (WT). Open circles, Chr XII (“12”, omitting rDNA length) and the portions of Chr XII left or right of the rDNA (“12L”, “12R”). Regression line treats 12L and 12R as separate chromosomes. d, Regional variation in response to zip3 mutation. Each point is the change at a hotspot (plotted on log scale). Red lines, local regression (loess); green circles, centromeres. e, Local domains of correlated behavior. Each point compares hotspots to their neighbors in 5-kb-wide windows the indicated distance away. Nearby hotspots show correlated behavior for fold change in zip3 (red), but not heat (Spo11-oligo frequency) in wild type (black). Shaded areas denote 95% CI estimates for hotspots randomized within-chromosome (randomized r>0 for zip3-fold-change because of the chromosome size effect). f, Correlation between log-fold-change in zip3 and binding of indicated proteins, binned in non-overlapping windows of varying size. For clarity, other proteins are in Extended Data Fig. 9b. Pericentric, sub-telomeric, and rDNA-proximal regions were censored. Closed symbols, p<0.05. g, Fit of multiple regression model predicting changes (log scale) in Spo11-oligo density in 35-kb windows from ChIP data, G+C content, and chromosome size (Supplementary Table 5). Dashed lines, observed mean fold change. h, Network of feedback circuits controlling DSB formation. Circuit 1: DSBs activate Tel1 (ATM in mouse), which inhibits further DSB formation. Circuit 2: ZMM-dependent interactions between homologous chromosomes inhibit Spo11. Circuit 3: Ndt80 shuts down DSB formation and drives pachytene exit; Mec1 kinase delays or blocks Ndt80 activation when DSBs are present.
Extended Data Figure 8. Spo11-oligo mapping in wild type and zip3.
a, b, Quantitative reproducibility of Spo11-oligo maps. In a, comparisons are shown for individual wild type (WT) or zip3 datasets from the present study, or the previously published spo11-HA data (from ref 11). Uniquely mapped Spo11 oligos were summed in non-overlapping 5-kb bins and expressed as RPM per kb (plotted on a log scale). In b, pairwise correlation coefficients for the datasets from the current study are shown (Pearson's r; box colors scaled from blue to red proportional to strength of correlation). For the comparison of this study's wild-type average with data from Pan et al., r = 0.949. Note that Pan et al. used a different strain background with different auxotrophies, which may alter DSB distributions61,62, and a hypomorphic spo11 allele (spo11-HA), which may affect DSBs to different extents at different locations56. Note that biological replicates (WT-1 vs. WT-2 or zip3-1 vs. zip3-2) agreed better than comparisons between cultures of different genotype. c, DSBs form at the same hotspots and with similar distribution within and between hotspots in wild type and zip3. Unsmoothed Spo11 oligo maps are shown in the vicinity of the well-characterized ARE1 (YCR048w) hotspot.
On larger scales, however, zip3 showed substantial alterations. Smaller chromosomes form more crossovers per unit length than larger ones35 because of variation in DSB levels11, but what controls DSB differences has been unclear. Remarkably, zip3 mutation eliminated the normal inverse correlation between Spo11-oligo density and chromosome length (Fig. 4b). If the zip3 map is scaled by 1.8 fold (based on peak Spo11-oligo levels, Fig. 1e), all chromosomes had more DSBs but larger ones went up disproportionately (Fig. 4c). Thus, ZMM-dependent feedback is necessary for length-dependent recombination variation in wild type. Perhaps the number (not density) of DSBs governs speed or efficiency of homolog engagement: if so, smaller chromosomes might tend to have more time to accumulate DSBs. A non-exclusive possibility is that DSB suppression spreads far relative to chromosome length, with longer chromosomes providing more spreading room.
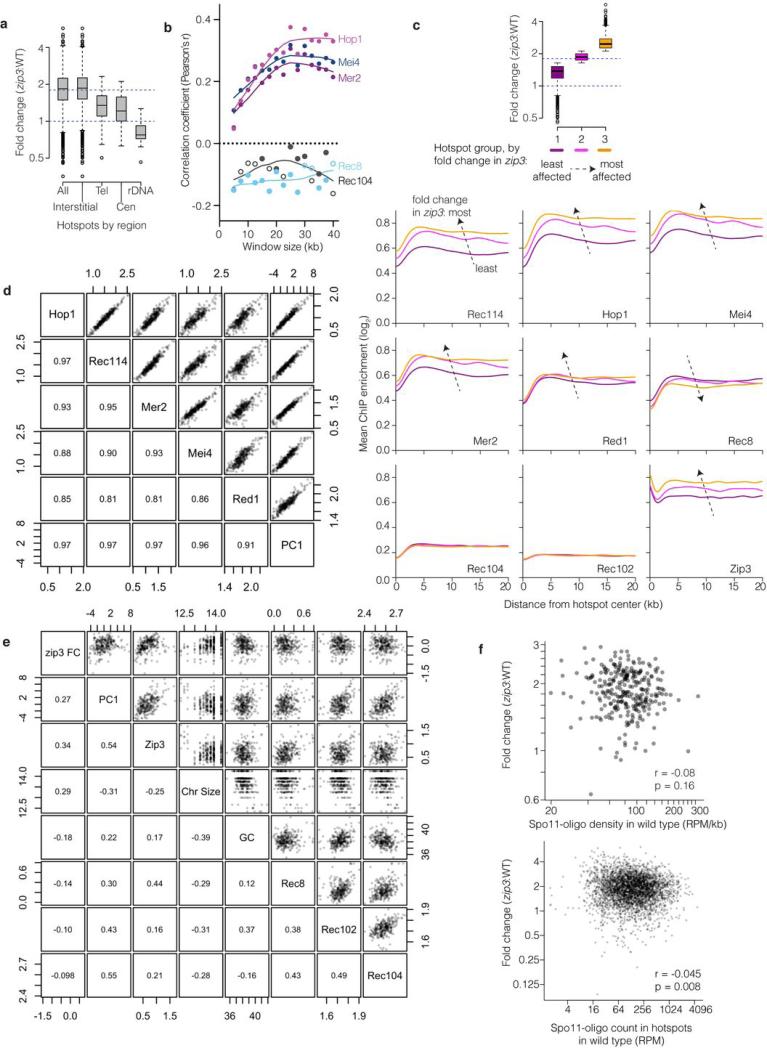
Subchromosomal domains differed in response to zip3 mutation: Spo11-oligo frequencies increased less than average in 20-kb zones at telomeres and centromeres (where few DSBs form in wild type11,36,37), and were unchanged or reduced near the rDNA, causing Chr XII to be an outlier in whole-chromosome analysis (Fig. 4c,d and Extended Data Fig. 9a). The remaining interstitial regions varied widely, with local regression along chromosomes suggesting alternating domains of greater or lesser change (Fig. 4d). Supporting this conclusion, the change in each hotspot correlated with the change in hotspots located nearby, with correlation strength decaying with distance (Fig. 4e).
Extended Data Figure 9. Changes in the DSB landscape in zip3.
a, Change in Spo11-oligo counts in hotspots grouped by chromosomal context. Tel, within 20 kb of telomeres; Cen, within ±10 kb of centromeres; rDNA, from 60 kb leftward to 30 kb rightward of rDNA; Interstitial, all others. Dashed lines mark values assumed as no change and average change (1.8-fold). Boxes indicate median and interquartile range; whiskers indicate the most extreme data points which are ≤1.5 times the interquartile range from the box; individual points are outliers. Sub-telomeric and pericentric zones show less increase in zip3 on average, thus, ZMM-dependent feedback contributes less than other, unknown factors to suppressing DSBs in these regions. The zone near the rDNA showed no increase or was even decreased; thus, zip3 mutants are competent for this region's DSB suppression, which is dependent on the ATPase Pch2 and the replication factor Orc1 (ref 63). Note that the remaining interstitial hotspots showed highly variable response to zip3 mutation (>20 fold). b, Correlation between log-fold change in Spo11-oligo counts in zip3 and the binding of the indicated proteins, binned in non-overlapping windows of varying size. Closed symbols, p<0.05. ChIP data are from ref 38. c, Average ChIP profiles around interstitial hotspots divided into three equal-sized groups according to the average fold change in zip3. Top: the box-and-whisker plot (as described for panel a) shows the distribution of fold changes for the three groups. Below: ChIP profiles for each of the indicated proteins. Note that the profiles lie atop one another for Rec102 and Rec104. Dashed arrows indicate direction of the change in the average profiles with increasing fold change in zip3. ChIP data are from refs 38 and 39. d, High degree of colinearity of log2-transformed ChIP data38 for Rec114, Mei4, and Mer2 (which are essential for DSB formation) and Hop1 and Red1 (axis proteins that promote normal DSB formation). More than 90% of the variance for this combination of ChIP data is captured in the first principal component (PC1). The high degree of correlation between these proteins was described previously38. e, Correlations between the fold change in zip3 (zip3 FC, log2 and assuming 1.8-fold increase genome-wide) and various chromosomal features: principal component 1 (PC1) for Rec114, Mei4, Mer2, Hop1, and Red1 ChIP data (same as in panel d); chromosome size (loge(bp)); G+C content (%); and ChIP data for the indicated proteins (log2). In d and e, upper right panels show pair-wise scatter plots and lower left panels show corresponding correlation coefficients (Pearson's r) for data for interstitial regions binned in 35-kb non-overlapping windows. Essentially identical results were obtained with different window sizes (20–40 kb) or with varying placement of windows (data not shown). f, Essentially no correlation between DSB activity in wild type and change in zip3, whether considering interstitial regions divided into non-overlapping 35-kb bins (upper panel) or interstitial hotspots (lower panel). A 1.8-fold increase genome-wide in zip3 is assumed. Note: Fold change is labeled according to a linear scale but plotted in a log scale in panels a, c, f.
To better understand these domains, we compared Spo11-oligo maps to chromosomal features including the distribution in wild type of Zip3 protein, chromosome structure proteins needed for normal DSBs (Hop1, Red1, Rec8) and proteins essential for Spo11 activity (Mei4, Mer2, Rec102, Rec104, Rec114), previously defined by chromatin immunoprecipitation (ChIP)38,39. The magnitude of change in Spo11-oligo density in zip3 correlated with enrichment of Hop1, Rec114, Mei4, Mer2, and Red1, with highest correlation for binning windows ≥20 kb (Fig. 4f, Extended Data Fig. 9b,c,e). These proteins’ distributions are themselves correlated38 (Extended Data Fig. 9d). We infer that large domains (tens of kb wide) enriched for these proteins tend to be more responsive to ZMM-dependent feedback. G+C content, Spo11-oligo density in wild type, and distributions of Rec8, Rec102, and Rec104 were uncorrelated or weakly anti-correlated when considered individually (Fig. 4f, Extended Data Fig. 9b,c,e,f). However, we observed a strong scale-dependent correlation with the distribution Zip3 displays when most DSBs have formed and homologs are engaging39 (Fig. 4f, Extended Data Fig. 9c,e). Zip3 localizes to subsets of recombination sites17, so the positive correlation between Zip3 accumulation in wild type and altered DSB frequency in zip3 suggests that Zip3 inhibits DSB formation, directly or indirectly, at sites of homolog engagement. Multiple regression indicates that these chromosomal features, plus chromosome size, explains ~40% of the variation in zip3-induced DSB change (Fig. 4g, Supplementary Table 5). Our findings elucidate the locus-to-locus variability of zmm hyper-rec behavior and reveal that ZMM-dependent feedback shapes the DSB landscape in wild type.
Conclusions
We propose that the logic of DSB control involves a drive toward DSB formation that is restrained quantitatively, spatially, and temporally by distinct but intersecting negative influences (Fig. 4h). We note several implications. First, Spo11 catalytic potential exceeds what is realized in any one meiosis. Thus, DSB numbers may underestimate severity of biochemical defects in mutants22. Second, counterintuitive effects arise when feedback loops are severed or hyperactivated, e.g., in dmc1 or rad50S backgrounds. The zmm mutations likely impinge on multiple circuits simultaneously, removing restraints on Spo11 activity by disrupting homolog engagement and inhibiting Ndt80 activation, but also hyperactivating negative regulatory circuits via the DNA damage responsive kinase Tel1 (and possibly Mec1). This “pushmepullyou” interplay undoubtedly affects the final number and distribution of DSBs. Our results support the conclusion that crossovers in zmm mutants are not identical in number and provenance to crossovers that form without ZMM intervention in wild type. Third, our findings explain puzzling aspects of set1 mutant yeast and Prdm9–/– mutant mice. If DSB number control is separate from Spo11 targeting (which requires Set1 or PRDM9 (ref 40)), then the default for Spo11 to make breaks until restrained by feedback explains why DSBs form in relatively normal numbers but different locations in these mutants. This also undermines more extreme versions of the “hotspot paradox” in which biased gene conversion is predicted to eliminate all hotspots over time and thereby prevent DSB formation (e.g., ref 41): the logic of DSB control makes it impossible for inactivation of individual hotspots to render chromosomes immune to Spo11. Fourth, our findings support the hypothesis that altered DSB distributions tied to feedback control are the source of altered recombination distributions caused by certain mutations or heterozygosity for large-scale chromosome structure variants in other species6,7. Finally, we speculate that organisms such as mouse readily form SC between nonhomologous chromosome segments late in prophase (e.g., ref 8) as a means to shut down unproductive DSB formation in karyotypically unbalanced cells.
Our findings provide a holistic view of DSB control in the broader context of meiotic chromosome dynamics and meiotic progression, and explain how DSB formation is homeostatic and therefore robust against cell-to-cell variation, environmental perturbation, and chromosome variants encountered in outcrosses.
Methods
Yeast strains and plasmids
Strains were of the SK1 background (Supplementary Table 6). The zip1 and a ndt80 deletions (ndt80Δ::LEU2) were provided by Nancy Kleckner, the msh5 and zip3 deletions were provided by Neil Hunter, the spo16 deletion was provided by Akira Shinohara, and a second ndt80 deletion (ndt80Δ::kanMX4) was provided by Sean Burgess. The dmc1, pph3, and zip4 deletions were made by replacing the coding sequence with the hygromycin B phosphotransferase gene (hphMX4). Gene disruption was verified by PCR. All mutants analyzed were moved into the desired tester strain backgrounds by crossing and tetrad dissection. The SPO11-flag strain was provided by Kunihiro Ohta and the protein A tagging construct was provided by Michael Rout. The constructs for two-dimensional (2D) gel electrophoresis analysis of crossover and noncrossover recombinants at CCT6, ERG1, and GAT1 were engineered by a series of two-step gene replacements. For CCT6 on Chr IV, SalI sites were introduced in intergenic regions at Saccharomyces Genome Database (SGD) coordinates 832534 and 838251 in one strain; SalI sites were introduced separately at coordinates 833537 (in YDR186c) and 837893 (in CCT6) in another strain along with a SmaI site between YDR186c and CCT6 at coordinates 835802 and 835803. For ERG1 on Chr VII, SacII sites were introduced in intragenic regions at coordinates 844276 (in RBG2) and 854464 (in OKP1) along with a SalI site at coordinate 848724 (between ERG1 and ATF2). In a separate strain, SacII sites were introduced at coordinate 845470 (intergenic) and coordinate 852145 (in PBP1). For GAT1 on Chr VI, KpnI sites were introduced at coordinates 90967 and 100083 (both intergenic) along with a BamHI site between FRS2 and GAT1 at coordinates 95715 and 95717. Separately, KpnI sites were introduced at coordinates 92986 (BUD27) and coordinate 98899 (intergenic). Further details are in ref 42 and available on request.
Culture methods
With the exception of Spo11-oligo mapping, synchronous meiotic cultures were prepared as described43,44. Briefly, cells were grown in YPA (1% yeast extract, 2% Bacto Peptone, 1% potassium acetate) for 13.5–14 hr at 30°C, harvested, resuspended in 2% potassium acetate, and sporulated at 30°C.
Meiotic division profiles
Aliquots were collected from synchronous meiotic cultures and fixed in 47.5% (v/v) ethanol and 0.05 μg/ml 4′,6-diamidino-2-phenylindole (DAPI). Mono-, bi-, and tetranucleate cells were scored by epifluorescence microscopy.
Direct DSB measurements and heteroallele recombination analysis
High molecular weight DNA was prepared and separated by pulsed-field gel electrophoresis as described45. DNA was probed with part of the YIL160c open reading frame (SGD coordinates 40223 to 40728). DNA was probed with part of the CHA1 open reading frame (SGD coordinates 15838 to 16857), SKI8 (coordinates 90062 to 91228), YHL042w (coordinates 15671 to 16112), or POT1 (coordinates 40223 to 40728). DSB analyses at CCT6, ERG1, and GAT1 were performed as described11. Blots were quantified by phosphoimager. For the DMC1+ pulsed-field DSB analyses, the signal above the parental band (including the well) was split between the parental and DSB signals. For quantification in Fig. 1c and Extended Data Fig. 7b, our main interest was absolute DSB levels, so we calculated the average number of DSBs per chromatid assuming a Poisson distribution of breaks among and along chromatids in the population: P(n) = (μne-μ)/n! where μ is the mean number of DSBs per chromatid and P(n) is the probability that n DSBs occur on a single chromatid. The observed parental-length signal (Uobs, for “unbroken”) approximates the true unbroken fraction (i.e., P(0) ≈ Uobs), so the mean total number of DSBs per chromatid in the population (DSBtotal) can be estimated as -ln(Uobs). This calculation helps correct for multiple DSBs on the same chromatid. A full description of the method, and confirmation that it does not overestimate DSB numbers, will be provided elsewhere (H. Murakami and S. Keeney, manuscript submitted).
Because relative DSB levels were our main interest for data in Extended Data Fig. 2, we did not apply a Poisson correction and expressed DSBs instead as detectable broken DNA as percent of total DNA in the lane. For the locus-specific DSB analyses the signal between the parental band and the wells was measured and apportioned evenly between the parental and DSB values. The frequency of meiotic recombination at ARG4 was determined by heteroallele recombination analysis as described46.
2D gel electrophoresis analysis of crossovers and noncrossovers
Cultures were grown and sporulated as described above at 30°C. Samples (15 ml) were harvested at 10 hr and washed twice with 5 ml of 50 mM EDTA, pH 8.0. For analyses at CCT6 and ERG1, DNA was prepared in agarose plugs as described45. For analysis at GAT1, DNA was prepared for conventional agarose electrophoresis47. DNA embedded in agarose plugs was digested with the appropriate restriction endonuclease (CCT6 - SalI, ERG1 - SacII), then electrophoresed at room temperature for 24–26 hr at 1.7 V/cm on 0.5% agarose in 0.5× TBE (Tris/Borate/EDTA). DNA prepared for conventional agarose electrophoresis (GAT1) was digested with KpnI, then electrophoresed at room temperature for 24 hr at 1.7 V/cm on 0.5% agarose in 1× TBE. A ~10.5 cm gel slice containing the region of interest was then excised. For analysis at CCT6 and ERG1 the gel slice was washed twice in the appropriate NEBuffer supplemented with 20 μg/ml bovine serum albumin (BSA). For analysis at GAT1 the gel slice was washed twice in 10 mM Tris-HCl pH 8.1 followed by one wash in NEBuffer 4 supplemented with 100 μg/ml BSA. Liquid was then replaced with fresh NEBuffer supplemented with 20 μg/ml BSA or 100 μg/ml BSA, then 4900-5000 units of the appropriate restriction endonuclease (CCT6 - SmaI, GAT1 - BamHI, ERG1 - SalI) was added and incubated first at 4°C overnight then at the optimal incubation temperature for ~24 hr. The gel slice was then cast in a 0.6% agarose gel in 0.5× TBE (CCT6 and ERG1) or 1× TBE (GAT1), then electrophoresed perpendicular to the first dimension at ~1.3 V/cm for ~20 hr at room temperature. DNA was probed with part of the CCT6 open reading frame (SGD coordinates 837413 to 837865), part of the GAT1 open reading frame (SGD coordinates 95968 to 97490 or SGD coordinates 96500 to 97491), or part of the PBP1 open reading frame (SGD coordinates 851379 to 851869).
End-labeling of Spo11-oligo complexes and western blot analysis
Lysates and extracts were prepared as previously described48. Immunoprecipitation of Spo11-oligo complexes was performed using 5 μg of mouse monoclonal anti-flag M2 antibody (Sigma). Precipitated Spo11-oligo complexes were end-labeled in NEBuffer 4 (New England Biolabs) containing 3–10 μCi of [α-32P]dCTP and terminal deoxynucleotidyl transferase (TdT)48. Twenty-five μl of reaction mixture was added to the beads, mixed, and incubated at 37°C for 1–2 hr. Spo11-oligo complexes were eluted by adding 25 μl of NUPAGE® loading buffer (diluted to 2× and supplemented with 83.3 mM dithiothreitol) (Invitrogen) and boiling for 5 min. End-labeled Spo11-oligo complexes were separated on a Novex® 4–12% gradient denaturing polyacrylamide gel (Invitrogen) then transferred onto PVDF membrane using the iBlot protocol (Invitrogen) and visualized by phosphorimager. Blots were probed with mouse monoclonal anti-flag M2 conjugated to horseradish peroxidase (Sigma). Chemiluminescent detection was performed according to the manufacturer's instructions (ECL+ or ECL Prime, Amersham). Protein quantity was estimated by separating 1 μl of extract on a Novex® 4–12% gradient denaturing polyacrylamide gel and staining with Coomassie Brilliant Blue.
Spo11-oligo purification for mapping
Spo11 oligos were prepared for sequencing similar to methods described previously11, with modifications. Haploid strains with Spo11 C-terminally tagged with 5 copies of the protein A tag were patched from a frozen stock onto a YP-glycerol plate and grown at 30°C overnight to select for respiration competence. Cells were mated on YPD plates then streaked for single colonies and grown for 48 hr at 30°C. A single colony was inoculated into 5 ml liquid YPD medium and grown overnight at 30°C. The saturated YPD culture was used to inoculate 25 ml liquid SPS medium (0.5% yeast extract, 1% peptone, 0.67% yeast nitrogen base without amino acids (Difco), 1% potassium acetate, 0.05 M potassium biphthalate, pH 5.5) to OD600 0.8 and grown for 7 hr at 30°C. This culture was used to inoculate 1 l SPS medium in a 2.8 l baffled Fernbach flasks to OD600 0.05. Flasks were incubated at 30°C for 12–16 hr, to OD600 4.5–6. Cells were harvested by centrifugation, washed once in deionized water, resuspended in 0.6 l sporulation medium (2% potassium acetate and 0.001% antifoam 204) and incubated in 2.8 l baffled flasks (0.6 liter per flask) at 30°C for 4 hr (wild type) or 5 hr (zip3) to approximate times of peak Spo11-oligo levels (Fig. 1e).
Cells were centrifuged and washed with 50 mM EDTA, transferred to a 30 ml syringe, extruded into liquid nitrogen, and stored at -80°C. Yeast cell powder was prepared by placing the frozen paste into canisters of a Retsch MM301 mill (pre-chilled in liquid nitrogen) and grinding 5 times for 3 min at 30 Hz. Yeast powder was transferred to a pre-chilled 50 ml tube and stored at -80°C. Extract was prepared by transferring the yeast powder to a pre-chilled 40 ml glass Dounce homogenizer and homogenizing in 2 volumes of cold 10% trichloroacetic acid. Lysate was centrifuged at 14000 rpm in an SS-34 rotor (Sorvall) for 20 min. The supernatant was removed and cell pellet was resuspended in SDS extraction buffer (2% SDS, 0.5 M Tris-HCl, pH 8.1, 10 mM EDTA, 0.005% bromophenol blue). β-mercaptoethanol was added to 0.288 M, the extract boiled in a water bath for 5 min, then centrifuged at 14000 rpm in an SS-34 rotor for 20 min.
The supernatant was poured into fresh tubes, diluted with an equal volume of 2× immunoprecipitation (IP) buffer (2% Triton X-100, 30 mM Tris-HCl, pH 8.0, 300 mM NaCl, 2 mM EDTA) and incubated with CL6B-sepharose beads (GE) for mock IP (4 hr at 4°C mixing end-over-end, 1.5 ml extract per 200 μl beads). Supernatant was removed into fresh tubes and mock beads were stored on ice. The supernatant was incubated with 200 μl IgG Sepharose Fast Flow beads (GE) per 1.5 ml of extract for 4 hr at 4°C mixing end-over-end, then beads were recovered. Mock and IP beads were washed 3× with 10 ml cold 1× IP buffer. Protein was eluted from mock or IP beads with 350 μl 2× NuPAGE LDS buffer (Invitrogen) by boiling for 5 min, followed by a second elution with 350 μl 0.5× NuPAGE LDS buffer. The eluates were combined and diluted with 700 μl of 2× IP buffer, then incubated with 200 μl fresh CL6B-sepharose beads (mock) or IgG Sepharose Fast Flow beads (IP), 4°C overnight with end-over-end rotation. The beads were recovered and subsequently washed with 1 ml Proteinase K buffer (100 mM Tris-HCl, pH 7.4, 1 mM EDTA, 0.5% SDS, 1 mM CaCl2) lacking SDS, then resuspended in 600 μl Proteinase K buffer and 100 μg purified Proteinase K, and incubated overnight at 50°C with end-over-end rotation. The supernatant was collected using a SPIN-X tube (Corning) and ethanol precipitated with 0.3 volume of 9 M ammonium acetate, 10 μg of DNA-free glycogen and 2.5 volumes of 100% ethanol. Spo11 oligos were quantified by end labeling with [α-32P]GTP and TdT (Fermentas) and comparing to a known quantity of similarly labeled 30-nt synthetic oligo11.
Library preparation for sequencing
Approx. 300 fmol of Spo11 oligos were subjected to GTP tailing at their 3′ ends. Material eluted from mock beads was processed in parallel to determine specificity of the IP (data not shown). Tailing was carried out in a total volume of 40 μl containing 1× NEBuffer 4, 20 units TdT, and 13.8 μM GTP at 37°C for 5 hr, followed by heat inactivation of TdT at 75°C for 10 min. The tailed oligos were ligated to a double-stranded DNA adaptor optimized for the Illumina HiSeq platform as follows: the tailing reaction was supplemented by addition of 10× T4 RNA ligase 2 buffer (500 mM Tris-HCl, pH 7.6, 50 mM MgCl2, 50 mM β-mercaptoethanol) to 1×, 25 mM ATP to 0.5 mM, 5 pmol double-stranded customized P7 adaptor, 300 fmol T4 RNA ligase 2 (gift from Stewart Shuman, MSKCC), and dH2O to a final volume of 50 μl. P7 adaptor sequences are 5′-GTGACTGGAGTTCAGACGTGTGCTCTTCCGATCTCCCC and 5′-pAGATCGGAAGAGCACACGTCTGAACTCCAGTCACppT, where CppT is an inverted 3′-3′ linkage to block ligation. These oligos were annealed and purified by non-denaturing polyacrylamide gel electrophoresis prior to use in the ligation reaction. Ligation was carried out overnight at room temperature. Complementary strands of Spo11 oligos were synthesized as follows: the ligation reaction was supplemented with 2 mM dNTP to a final concentration of 30 μM and 10 units Klenow polymerase (New England Bioloabs), and incubated at 25°C for 15 min. After Klenow inactivation (75°C, 10 min), extension reactions were supplemented with 0.3 volume of 9 M ammonium acetate, 10 μg of DNA-free glycogen and 2.5 volumes of 100% ethanol. DNA was precipitated at -20°C overnight and centrifuged at 16,000 × g. The pellet was rinsed with 70% ethanol, air dried, and dissolved in a mixture of 9 μl water and 15 μl formamide loading buffer. Extension products and 10 bp ladder (radiolabeled with T4 polynucleotide kinase and [α-32P]ATP) were separated on a 10% denaturing polyacrylamide gel. The region between ~55–200 nt (equivalent to ~10–50 nt Spo11 oligos with (rG)3~5 tails plus ligated adaptor) was excised, crushed, and eluted in 400 μl 10 mM Tris-HCl, pH 8.0 at 37°C overnight with mixing. Elution mixture was spun through a SPIN-X tube, then 0.3 volume of 9 M ammonium acetate, 10 μg DNA-free glycogen, and 2.5 volume of 100% ethanol were added. DNA was precipitated on dry ice at -20°C overnight and centrifuged at 16,000 × g. Pellet was rinsed with 70% ethanol and air dried. The 3′ ends of gel-purified, denatured DNA strands were tailed with GTP by dissolving the dried pellet in 40 μl tailing reaction containing 1× NEBuffer 4, 30 units TdT, and 50 μM GTP, then incubating at 37°C for 5 hr. The tailed oligos were ligated to a second set of customized double-stranded DNA adaptors (P5) and complementary strands were synthesized as above. The P5 adaptor is a mixture of four duplexes. The oligos for one duplex are 5′-ACACTCTTTCCCTACACGACGCTCTTCCGATCTAGTCTCCCC and 5′-pAGACTAGATCGGAAGAGCGTCGTGTAGGGAAAGAGTGTppT.
The four different P5 duplexes have different sequence at the underlined positions (top strand: AGTC, GTCA, TCAG, CAGT, respectively), which are the first four bases that will be read by the sequencer. Complementary pairs of oligos were annealed separately and purified by nondenaturing electrophoresis, then the four duplexes were mixed in approximately equimolar ratio. This provides diversity of base composition at the beginning of the sequencing reaction. If this diversifier region were not present, the sequencer would encounter a homogeneous oligo-C sequence for every read, compromising ability to detect individual amplification clusters immobilized on the flow cell surface.
To estimate the yield, test PCR was carried out in a total of 30 μl containing 1–2% of the final Klenow extension reaction, 1× PCR buffer (Invitrogen), 2 mM MgCl2, 0.2 mM dNTP, 1.5 units Taq polymerase (Invitrogen) and 1 μM P5 primer: 5′-AATGATACGGCGACCACCGAGATCTACACTCTTTCCCTACACGACG, comprising Illumina sequencing primer and part of P5 adaptor, 1 μM Indexing primer: 5′-CAAGCAGAAGACGGCATACGAGATCGTGATGTGACTGGAGTTCAGACGTGTG (underlined sequence is Illumina HiSeq Index 1, replaced as appropriate with the sequence of other indices according to manufacturer instructions), comprising Illumina-specific primer and part of the P7 adaptor). The mixture was divided into three tubes and PCR was initiated by a denaturation step at 94°C for 10 s, followed by 20 cycles of amplification (94°C for 10 s, 60°C for 10 s, and 72°C for 10 s). PCRs were combined and the products were electrophoresed on a 10% non-denaturing polyacrylamide gel with low molecular weight DNA ladder (New England Biolabs) to determine the size and quantity of PCR product after staining with ethidium bromide. Template for Illumina sequencing was prepared by a large-scale PCR with same conditions as above (but only 16 cycles instead of 20), scaled up to a total volume of 640 μl containing the desired amount of the Klenow-extended products. Sequencing was performed using Illumina HiSeq in the MSKCC Genomics Core Laboratory.
Bioinformatic analysis
Statistical analyses were performed using R version 2.15.3 (http://www.r-project.org/)49 or GraphPad Prism 6.0. Mapping of Illumina reads to the target genome was performed using a pipeline essentially as described11. Briefly, adaptor sequences were removed from both the 5′ and 3′ ends, then reads were mapped to the S. cerevisiae genome (SGD version June 2008, i.e., sacCer2) using gmapper-ls (2_1_1b) from the SHRiMP mapping package50. The specific mapping parameters used were:
-U -g -1000 -q -1000 -m 10 -i -20 -h 100 -r 50% -o 1001 which forces ungapped alignments (-U by itself did not suppress all gapped alignments so we set an effectively infinite gap opening penalty). To increase sensitivity for short reads we set the seeds to the following
-n 1 -s 1111111111,
11110111101111,
1111011100100001111,
1111000011001101111
After mapping, the reads were separated into unique and multiple mapping sets, but only uniquely mapping reads were analyzed in this study (multiple mapping reads constituted a small minority of the total). A full copy of the source code is available online at http://cbio.mskcc.org/public/Thacker_ZMM_feedback.
Because the rDNA array is represented in the SGD assembly by only 1.9 copies of the repeat unit, oligos that span the boundary between repeats map to a single position even though they come from a repetitive sequence. Therefore, reads of this type were moved to the multiple mapping set. The wild-type datasets contained a small number of spurious reads (<0.4% of total) from contamination of the Spo11-oligo sequencing libraries with PCR primers from the TEL1 locus; these reads were deleted from the maps. Because of the variable number of rG residues added by terminal transferase to the 3′ end of Spo11 oligos and to the 3′ end of the reverse complementary strands, there is ambiguity in defining the precise start and end positions for reads that map to positions starting with one or more C residues or ending in one or more G residues11. In such cases, the 5′ and 3′ ends of each read were defined so as to provide the longest contiguous sequence match with the genome.
Raw and processed sequence reads have been deposited in the Gene Expression Omnibus (GEO) database (http://www.ncbi.nlm.nih.gov/geo/ (accession GSE48299). This accession also contains the curated maps (unique mapping reads only) in wiggle format to allow direct visualization in appropriate genome browsers, e.g., the UCSC browser (http://genome.ucsc.edu/ using genome version sacCer2).
For the studies here, our focus is on the number and position of DSBs rather than characteristics of the Spo11 oligos themselves, so maps were distilled to record just the positions of 5′ ends of oligos. Each map was normalized to the total number of reads that mapped uniquely to a chromosome (RPM; excluding reads mapping to mitochondrial DNA or the 2μ plasmid), then wild-type and zip3 maps were averaged. Normalized Spo11-oligo counts within the 3600 previously identified hotspots11 are compiled for each dataset in Supplementary Table 4. In analyses evaluating the fold change (i.e., Fig. 4c,d,g, Extended Data Fig. 9a,d-f), we assumed a global increase in Spo11-oligo number of 1.8-fold based on the difference in peak steady-state levels (Fig. 1e). To prevent dividing by zero and to minimize variability of ratios caused by small changes in denominators, we added a small constant to numerator and denominator before taking the ratio (20 RPM for hotspot-based ratios (approximately 15% of median hotspot Spo11-oligo count), or 0.1 RPM/kb for bin-based ratios (0.13% of median Spo11-oligo density per bin)). Where indicated, Spo11-oligo maps were smoothed with a 201-bp Hann window.
For the correlation analysis in Fig. 4f and Extended Data Fig. 9b, chromosomes were divided into non-overlapping bins of the indicated sizes. Bins that overlapped censored regions (within 20 kb of telomeres, within ±10 kb of centromeres, or in the region from 60 kb leftward to 30 kb rightward of the rDNA) were discarded. The published ChIP enrichment data (log2 of ChIP/input; from GEO accession GSE29860 (ref 38) or Supplemental Table 3 from ref 39) were averaged within each bin, then compared to the mean log-fold-change in Spo11-oligo density in zip3 and correlation coefficients were calculated. The log-transformed data were approximately normally distributed so we used Pearson's r, but similar overall patterns were obtained if we used Kendall's tau (data not shown).
Multiple linear regression was performed using the “lm” function in R. Data were averaged in non-overlapping bins of 35 kb, censored for subtelomeric, pericentric, and rDNA-proximal regions as described above. Principal component analysis was performed on the correlation matrix of the Rec114, Mei4, Mer2, Hop1, and Red1 ChIP data using the “princomp” function in R. The first principal component accounted for 92.7% of the variance in this dataset; the remaining principal components were discarded as they accounted for only 4.1%, 2.2%, 0.8%, and 0.3% of the variance, respectively.
To assess spatial correlations for the change in Spo11-oligo density (Fig. 4e), we calculated the correlation coefficient (Pearson's r) between the log-fold-change at DSB hotspots and the log-fold-change for hotspots located within a set of 5-kb windows centered a distance D to the right of each hotspot center. We varied D from 5 to 200 kb in steps of 2.5 kb and calculated the correlation coefficient separately for each distance. For comparison, we performed the same analysis to evaluate the correlation between absolute heat (log of the Spo11-oligo count) in hotspots and the heat in 5-kb windows at varying distances. To generate randomized controls for this analysis, we randomly reassigned the heats or log-fold-change between hotspots within a chromosome. This randomization strategy preserves the non-random placement of hotspots relative to one another and preserves the correlated behavior (if any) across whole chromosomes. Randomization was repeated 100 times to provide the estimates of the 95% confidence intervals shown in the Fig. 4e.
Supplementary Material
Acknowledgments
We are grateful to S. Burgess, N. Hunter, N. Kleckner, K. Ohta, M. Rout, and A. Shinohara for strains or epitope tagging constructs; F. Klein for sharing data; S. Shuman for gifts of T4 RNA ligase; A. Viale and the MSKCC Genomics Core Laboratory for sequencing; and N. Socci and the MSKCC Bioinformatics Core for assistance mapping Spo11 oligos. This work was supported by NIH grant R01 GM058673. S.K. is an Investigator of the Howard Hughes Medical Institute.
Footnotes
Author Contributions: D.T., N.M., and X.Z. performed experiments and analyzed the data. N.M. optimized purification of the Spo11-protein A fusion, prepared the sequencing libraries to map DSBs and performed preliminary data analysis on sequencing reads. S.K. analyzed sequencing data. D.T. and S.K. wrote the paper.
Author Information: Sequencing data were deposited at GEO (accession GSE48299).
The authors declare no competing financial interests.
Online Content Any additional Methods, Extended Data display items and Source Data are available in the online version of the paper; references unique to these sections appear only in the online paper.
Supplementary Information is available in the online version of the paper at www.nature.com/nature.
References
- 1.Keeney S. Mechanism and control of meiotic recombination initiation. Curr Top Dev Biol. 2001;52:1–53. doi: 10.1016/s0070-2153(01)52008-6. [DOI] [PubMed] [Google Scholar]
- 2.Lange J, et al. ATM controls meiotic double-strand-break formation. Nature. 2011;479:237–240. doi: 10.1038/nature10508. [DOI] [PMC free article] [PubMed] [Google Scholar]
- 3.Joyce EF, et al. Drosophila ATM and ATR have distinct activities in the regulation of meiotic DNA damage and repair. J Cell Biol. 2011;195:359–367. doi: 10.1083/jcb.201104121. [DOI] [PMC free article] [PubMed] [Google Scholar]
- 4.Zhang L, Kim KP, Kleckner NE, Storlazzi A. Meiotic double-strand breaks occur once per pair of (sister) chromatids and, via Mec1/ATR and Tel1/ATM, once per quartet of chromatids. Proc Natl Acad Sci U S A. 2011;108:20036–20041. doi: 10.1073/pnas.1117937108. [DOI] [PMC free article] [PubMed] [Google Scholar]
- 5.Carballo JA, et al. Budding yeast ATM/ATR control meiotic double-strand break (DSB) levels by down-regulating Rec114, an essential component of the DSB-machinery. PLoS genetics. 2013;9:e1003545. doi: 10.1371/journal.pgen.1003545. [DOI] [PMC free article] [PubMed] [Google Scholar]
- 6.Bhagat R, Manheim EA, Sherizen DE, McKim KS. Studies on crossover-specific mutants and the distribution of crossing over in Drosophila females. Cytogenet Genome Res. 2004;107:160–171. doi: 10.1159/000080594. [DOI] [PubMed] [Google Scholar]
- 7.Henzel JV, et al. An asymmetric chromosome pair undergoes synaptic adjustment and crossover redistribution during Caenorhabditis elegans meiosis: implications for sex chromosome evolution. Genetics. 2011;187:685–699. doi: 10.1534/genetics.110.124958. [DOI] [PMC free article] [PubMed] [Google Scholar]
- 8.Kauppi L, et al. Numerical constraints and feedback control of double-strand breaks in mouse meiosis. Genes Dev. 2013;27:873–886. doi: 10.1101/gad.213652.113. [DOI] [PMC free article] [PubMed] [Google Scholar]
- 9.Lynn A, Soucek R, Borner GV. ZMM proteins during meiosis: crossover artists at work. Chromosome Res. 2007;15:591–605. doi: 10.1007/s10577-007-1150-1. [DOI] [PubMed] [Google Scholar]
- 10.Neale MJ, Pan J, Keeney S. Endonucleolytic processing of covalent protein-linked DNA double-strand breaks. Nature. 2005;436:1053–1057. doi: 10.1038/nature03872. [DOI] [PMC free article] [PubMed] [Google Scholar]
- 11.Pan J, et al. A hierarchical combination of factors shapes the genome-wide topography of yeast meiotic recombination initiation. Cell. 2011;144:719–731. doi: 10.1016/j.cell.2011.02.009. [DOI] [PMC free article] [PubMed] [Google Scholar]
- 12.Xu L, Ajimura M, Padmore R, Klein C, Kleckner N. NDT80, a meiosis-specific gene required for exit from pachytene in Saccharomyces cerevisiae. Mol Cell Biol. 1995;15:6572–6581. doi: 10.1128/mcb.15.12.6572. [DOI] [PMC free article] [PubMed] [Google Scholar]
- 13.Sym M, Engebrecht JA, Roeder GS. ZIP1 is a synaptonemal complex protein required for meiotic chromosome synapsis. Cell. 1993;72:365–378. doi: 10.1016/0092-8674(93)90114-6. [DOI] [PubMed] [Google Scholar]
- 14.Ross-Macdonald P, Roeder GS. Mutation of a meiosis-specific MutS homolog decreases crossing over but not mismatch correction. Cell. 1994;79:1069–1080. doi: 10.1016/0092-8674(94)90037-x. [DOI] [PubMed] [Google Scholar]
- 15.Hollingsworth NM, Ponte L, Halsey C. MSH5, a novel MutS homolog, facilitates meiotic reciprocal recombination between homologs in Saccharomyces cerevisiae but not mismatch repair. Genes Dev. 1995;9:1728–1739. doi: 10.1101/gad.9.14.1728. [DOI] [PubMed] [Google Scholar]
- 16.Chua PR, Roeder GS. Zip2, a meiosis-specific protein required for the initiation of chromosome synapsis. Cell. 1998;93:349–359. doi: 10.1016/s0092-8674(00)81164-2. [DOI] [PubMed] [Google Scholar]
- 17.Agarwal S, Roeder GS. Zip3 provides a link between recombination enzymes and synaptonemal complex proteins. Cell. 2000;102:245–255. doi: 10.1016/s0092-8674(00)00029-5. [DOI] [PubMed] [Google Scholar]
- 18.Tsubouchi T, Zhao H, Roeder GS. The meiosis-specific zip4 protein regulates crossover distribution by promoting synaptonemal complex formation together with zip2. Developmental cell. 2006;10:809–819. doi: 10.1016/j.devcel.2006.04.003. [DOI] [PubMed] [Google Scholar]
- 19.Shinohara M, Oh SD, Hunter N, Shinohara A. Crossover assurance and crossover interference are distinctly regulated by the ZMM proteins during yeast meiosis. Nat Genet. 2008;40:299–309. doi: 10.1038/ng.83. [DOI] [PubMed] [Google Scholar]
- 20.Borner GV, Kleckner N, Hunter N. Crossover/noncrossover differentiation, synaptonemal complex formation, and regulatory surveillance at the leptotene/zygotene transition of meiosis. Cell. 2004;117:29–45. doi: 10.1016/s0092-8674(04)00292-2. [DOI] [PubMed] [Google Scholar]
- 21.Allers T, Lichten M. Differential timing and control of noncrossover and crossover recombination during meiosis. Cell. 2001;106:47–57. doi: 10.1016/s0092-8674(01)00416-0. [DOI] [PubMed] [Google Scholar]
- 22.Gray S, Allison RM, Garcia V, Goldman AS, Neale MJ. Positive regulation of meiotic DNA double-strand break formation by activation of the DNA damage checkpoint kinase Mec1(ATR). Open biology. 2013;3:130019. doi: 10.1098/rsob.130019. [DOI] [PMC free article] [PubMed] [Google Scholar]
- 23.Rockmill B, et al. High throughput sequencing reveals alterations in the recombination signatures with diminishing Spo11 activity. PLoS genetics. 2013;9:e1003932. doi: 10.1371/journal.pgen.1003932. [DOI] [PMC free article] [PubMed] [Google Scholar]
- 24.Tung KS, Hong EJ, Roeder GS. The pachytene checkpoint prevents accumulation and phosphorylation of the meiosis-specific transcription factor Ndt80. Proc Natl Acad Sci U S A. 2000;97:12187–12192. doi: 10.1073/pnas.220464597. [DOI] [PMC free article] [PubMed] [Google Scholar]
- 25.Rosu S, et al. The C. elegans DSB-2 protein reveals a regulatory network that controls competence for meiotic DSB formation and promotes crossover assurance. PLoS genetics. 2013;9:e1003674. doi: 10.1371/journal.pgen.1003674. [DOI] [PMC free article] [PubMed] [Google Scholar]
- 26.Stamper EL, et al. Identification of DSB-1, a protein required for initiation of meiotic recombination in Caenorhabditis elegans, illuminates a crossover assurance checkpoint. PLoS genetics. 2013;9:e1003679. doi: 10.1371/journal.pgen.1003679. [DOI] [PMC free article] [PubMed] [Google Scholar]
- 27.Wojtasz L, et al. Mouse HORMAD1 and HORMAD2, two conserved meiotic chromosomal proteins, are depleted from synapsed chromosome axes with the help of TRIP13 AAA-ATPase. PLoS genetics. 2009;5:e1000702. doi: 10.1371/journal.pgen.1000702. [DOI] [PMC free article] [PubMed] [Google Scholar]
- 28.Smith AV, Roeder GS. The yeast Red1 protein localizes to the cores of meiotic chromosomes. J Cell Biol. 1997;136:957–967. doi: 10.1083/jcb.136.5.957. [DOI] [PMC free article] [PubMed] [Google Scholar]
- 29.Kee K, Protacio RU, Arora C, Keeney S. Spatial organization and dynamics of the association of Rec102 and Rec104 with meiotic chromosomes. EMBO J. 2004;23:1815–1824. doi: 10.1038/sj.emboj.7600184. [DOI] [PMC free article] [PubMed] [Google Scholar]
- 30.Chen SY, et al. Global analysis of the meiotic crossover landscape. Developmental cell. 2008;15:401–415. doi: 10.1016/j.devcel.2008.07.006. [DOI] [PMC free article] [PubMed] [Google Scholar]
- 31.Nakagawa T, Ogawa H. The Saccharomyces cerevisiae MER3 gene, encoding a novel helicase-like protein, is required for crossover control in meiosis. EMBO J. 1999;18:5714–5723. doi: 10.1093/emboj/18.20.5714. [DOI] [PMC free article] [PubMed] [Google Scholar]
- 32.Jessop L, Rockmill B, Roeder GS, Lichten M. Meiotic chromosome synapsis-promoting proteins antagonize the anti-crossover activity of sgs1. PLoS genetics. 2006;2:e155. doi: 10.1371/journal.pgen.0020155. [DOI] [PMC free article] [PubMed] [Google Scholar]
- 33.Falk JE, Chan AC, Hoffmann E, Hochwagen A. A Mec1- and PP4-dependent checkpoint couples centromere pairing to meiotic recombination. Developmental cell. 2010;19:599–611. doi: 10.1016/j.devcel.2010.09.006. [DOI] [PubMed] [Google Scholar]
- 34.Lichten M. In: Recombination and Meiosis: Models, Means, and Evolution. Egel R, Lankenau DH, editors. Vol. 3. Springer-Verlag; 2008. pp. 165–193. [Google Scholar]
- 35.Kaback DB, Guacci V, Barber D, Mahon JW. Chromosome size-dependent control of meiotic recombination. Science. 1992;256:228–232. doi: 10.1126/science.1566070. [DOI] [PubMed] [Google Scholar]
- 36.Blitzblau HG, Bell GW, Rodriguez J, Bell SP, Hochwagen A. Mapping of meiotic single-stranded DNA reveals double-stranded-break hotspots near centromeres and telomeres. Curr Biol. 2007;17:2003–2012. doi: 10.1016/j.cub.2007.10.066. [DOI] [PubMed] [Google Scholar]
- 37.Buhler C, Borde V, Lichten M. Mapping meiotic single-strand DNA reveals a new landscape of DNA double-strand breaks in Saccharomyces cerevisiae. PLoS Biol. 2007;5:e324. doi: 10.1371/journal.pbio.0050324. [DOI] [PMC free article] [PubMed] [Google Scholar]
- 38.Panizza S, et al. Spo11-accessory proteins link double-strand break sites to the chromosome axis in early meiotic recombination. Cell. 2011;146:372–383. doi: 10.1016/j.cell.2011.07.003. [DOI] [PubMed] [Google Scholar]
- 39.Serrentino ME, Chaplais E, Sommermeyer V, Borde V. Differential association of the conserved SUMO ligase Zip3 with meiotic double-strand break sites reveals regional variations in the outcome of meiotic recombination. PLoS genetics. 2013;9:e1003416. doi: 10.1371/journal.pgen.1003416. [DOI] [PMC free article] [PubMed] [Google Scholar]
- 40.Borde V, de Massy B. Programmed induction of DNA double strand breaks during meiosis: setting up communication between DNA and the chromosome structure. Curr Opin Genet Dev. 2013;23:147–155. doi: 10.1016/j.gde.2012.12.002. [DOI] [PubMed] [Google Scholar]
- 41.Pineda-Krch M, Redfield RJ. Persistence and loss of meiotic recombination hotspots. Genetics. 2005;169:2319–2333. doi: 10.1534/genetics.104.034363. [DOI] [PMC free article] [PubMed] [Google Scholar]
- 42.Thacker D. PhD thesis. Weill Graduate School of Medical Sciences, Cornell University; 2012. Meiotic recombination in Saccharomyces cerevisiae: From new assays to new insights. [Google Scholar]
- 43.Alani E, Padmore R, Kleckner N. Analysis of wild-type and rad50 mutants of yeast suggests an intimate relationship between meiotic chromosome synapsis and recombination. Cell. 1990;61:419–436. doi: 10.1016/0092-8674(90)90524-i. [DOI] [PubMed] [Google Scholar]
- 44.Padmore R, Cao L, Kleckner N. Temporal comparison of recombination and synaptonemal complex formation during meiosis in S. cerevisiae. Cell. 1991;66:1239–1256. doi: 10.1016/0092-8674(91)90046-2. [DOI] [PubMed] [Google Scholar]
- 45.Borde V, Goldman AS, Lichten M. Direct coupling between meiotic DNA replication and recombination initiation. Science. 2000;290:806–809. doi: 10.1126/science.290.5492.806. [DOI] [PubMed] [Google Scholar]
- 46.Diaz RL, Alcid AD, Berger JM, Keeney S. Identification of residues in yeast Spo11p critical for meiotic DNA double-strand break formation. Mol Cell Biol. 2002;22:1106–1115. doi: 10.1128/MCB.22.4.1106-1115.2002. [DOI] [PMC free article] [PubMed] [Google Scholar]
- 47.Murakami H, Borde V, Nicolas A, Keeney S. Gel electrophoresis assays for analyzing DNA double-strand breaks in Saccharomyces cerevisiae at various spatial resolutions. Methods Mol Biol. 2009;557:117–142. doi: 10.1007/978-1-59745-527-5_9. [DOI] [PMC free article] [PubMed] [Google Scholar]
- 48.Neale MJ, Keeney S. End-labeling and analysis of Spo11-oligonucleotide complexes in Saccharomyces cerevisiae. Methods Mol Biol. 2009;557:183–195. doi: 10.1007/978-1-59745-527-5_12. [DOI] [PMC free article] [PubMed] [Google Scholar]
- 49.R Development Core Team . R: A language and environment for statistical computing. R Foundation for Statistical Computing; Vienna, Austria: 2012. [Google Scholar]
- 50.Rumble SM, et al. SHRiMP: accurate mapping of short color-space reads. PLoS Comput Biol. 2009;5:e1000386. doi: 10.1371/journal.pcbi.1000386. [DOI] [PMC free article] [PubMed] [Google Scholar]
Associated Data
This section collects any data citations, data availability statements, or supplementary materials included in this article.


