Abstract
Adaptive cellular responses resulting from multiple microenvironmental stresses, such as hypoxia and nutrient deprivation, are potential novel drug targets for cancer treatment. Accordingly, we focused on developing anticancer agents targeting the tumor microenvironment (TME). In this study, to search for selective antitumor agents blocking adaptive responses in the TME, thirteen new compounds, designed and synthesized on the basis of the arylmethylbiguanide scaffold of phenformin, were used in structure activity relationship studies of inhibition of hypoxia inducible factor (HIF)-1 and unfolded protein response (UPR) activation and of selective cytotoxicity under glucose-deprived stress conditions, using HT29 cells. We conducted luciferase reporter assays using stable cell lines expressing either an HIF-1-responsive reporter gene or a glucose-regulated protein 78 promoter-reporter gene, which were induced by hypoxia and glucose deprivation stress, respectively, to screen for TME-targeting antitumor drugs. The guanidine analog (compound 2), obtained by bioisosteric replacement of the biguanide group, had activities comparable with those of phenformin (compound 1). Introduction of various substituents on the phenyl ring significantly affected the activities. In particular, the o-methylphenyl analog compound 7 and the o-chlorophenyl analog compound 12 showed considerably more potent inhibitory effects on HIF-1 and UPR activation than did phenformin, and excellent selective cytotoxicity under glucose deprivation. These compounds, therefore, represent an improvement over phenformin. They also suppressed HIF-1- and UPR-related protein expression and secretion of vascular endothelial growth factor-A. Moreover, these compounds exhibited significant antiangiogenic effects in the chick chorioallantoic membrane assay. Our structural development studies of biguanide derivatives provided promising candidates for a novel anticancer agent targeting the TME for selective cancer therapy, to be subjected to further in vivo study.
Keywords: HIF-1, UPR, antiangiogenesis, hypoxia, glucose deprivation
Introduction
The solid tumor microenvironment (TME), characterized by hypoxia, nutritional deprivation, and acidosis, has a significant role in therapeutic resistance to chemoradiotherapy, malignant progression, and metastasis. More recently, the hypoxic microenvironment has been proposed to provide the cancer stem cell a niche conducive to the maintenance of stem cell characteristics.1,2 The TME has attracted attention over the years and has emerged as a critical target for cancer therapy, independent of cancer type.3,4 Although considerable attention has been paid to targeting hypoxia inducible factor (HIF)-1 in drug discovery, most HIF-1 inhibitors have been shown to exhibit no specificity for the HIF-1 molecule. Instead, they inhibit HIF-1 through various molecular mechanisms.5 We would rather assume that such multitargeting inhibitors are useful in combination therapy, achieving a successful outcome by modulating the TME through their multitargeting mechanisms, and inhibiting HIF-1-related signaling. We regarded the adaptive cellular responses against multiple microenvironmental stresses, such as hypoxia and nutrition deprivation, as a critical survival strategy for malignant tumor cells and a potential drug target for cancer treatment. Accordingly, we engaged in the development of an antitumor drug targeting the microenvironmental stress responses as a TME modulator.4,6
To develop TME-targeting drugs, we focused on cellular stress responses to oxygen and glucose deprivation in the TME. HIF-1 has a major role in the cellular adaptation to hypoxia.7,8 On the other hand, glucose deprivation can cause the accumulation of unfolded proteins in the endoplasmic reticulum (ER), which activates the unfolded protein response (UPR) to protect cells against ER stress.9 In addition to the HIF-1 signaling pathway, the oxygen- and nutrient-sensitive signaling pathways, including signaling through the mammalian target of rapamycin (mTOR) kinase and signaling through activation of the UPR, are implicated in an integrated stress response to ER stress in the TME.10–12 More recently, the tolerance of cancer cells to nutrient starvation has attracted much attention as a potential target for cancer therapy.13,14
In this context, we were intrigued by the report that the UPR transcription program is disrupted by biguanides such as metformin, buformin, and phenformin (1) (Figure 1A), depending on cellular glucose availability, resulting in selective cytotoxicity under glucose deprivation conditions.15 Metformin, the most widely prescribed of the antidiabetic biguanides, has recently received increased attention for its potential antitumorigenic effects and is now being tested in clinical trials as an adjuvant to classic chemotherapeutic regimens.16 Although several potential mechanisms, including activation of the liver kinase B1 (LKB1)/adenosine monophosphate–activated protein kinase (AMPK) pathway, inhibition of UPR, and eradication of cancer stem cells, have been suggested for the biguanide suppression of tumor growth, the specific target and mechanism remain unclear.16–18 UPR is a key cellular stress response related to HIF signaling and mTOR signaling in the TME; therefore, we investigated the structural optimization of biguanide derivatives to target the stress response signals. Here we report studies of the structural optimization of biguanide derivatives and evaluate their inhibition of HIF-1- and UPR-mediated transcriptional activation under hypoxia and low-nutrient stress respectively. We also investigated their selective cytotoxicity during glucose deprivation, and angiogenesis inhibition, for the purpose of developing more selective anticancer drugs targeting the TME.
Figure 1.
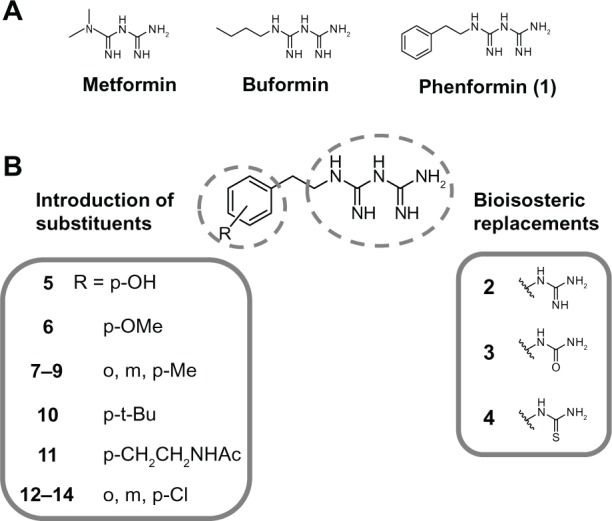
Molecular design and development of biguanide derivatives for anticancer agents targeting TME. (A) Structures of antidiabetic biguanides. (B) Molecular design of biguanide derivatives.
Note: The bolded numbers identify a specific compound.
Abbreviation: TME, tumor microenvironment.
Materials and methods
Proton (1H) and carbon-13 (13C) nuclear magnetic resonance (NMR) spectra were recorded using a JEOL JNM-EX400, JNM-AL400 or JNM-ECA-500 spectrometer (JEOL Ltd, Tokyo, Japan) at 400 or 500 MHz (1H NMR) and 100 or 125 MHz (13C NMR) in deuterated chloroform (CDCl3) (Cambridge Isotope Laboratories, Tewksbury, MA, USA), methanol (CD3OD) (Wako Pure Chemical Industries, Ltd, Osaka, Japan), and dimethyl sulfoxide (DMSO)-d6 (Cambridge Isotope Laboratories). Chemical shifts of 1H-NMR are referenced to tetramethylsilane (TMS). Chemical shifts of 13C-NMR were referenced to CDCl3 (77.0 ppm), CD3OD (49.0), and DMSO-d6 (39.7), unless otherwise specified. Direct analysis in real time (DART®) mass spectra were measured on a JEOL JMS-T100TD DART mass spectrometer (JEOL Ltd). Elementary analysis was performed on a Micro Corder JM10 (J-SCIENCE LAB Co, Ltd, Kyoto, Japan). Thin-layer chromatography was carried out on silica gel (Art 7749 Kieselgel 60 PF254; Merck KGaA, Darmstadt, Germany) with visualization of components by ultraviolet UV light (254 nm). Column chromatography was carried out on silica gel (AP-300S; Taiko Shoji, Ltd, Nagoya, Japan). Infrared (IR) spectra were recorded in KBr pellet on a JASCO FT/IR-230 (JASCO Corp, Tokyo, Japan) or a PerkinElmer Spectrum 100 FT-IR Spectrometer (PerkinElmer, Inc., Waltham, MA, USA). The pKa values were calculated by ACD/pKa DB Product version 12.5 (Fujitsu Limited, Tokyo, Japan). The clogD values were calculated with DS Accord for Excel version 7.1.5 (Accelrys Software, Inc., San Diego, CA, USA). Unless otherwise noted, all chemicals were obtained from commercial sources and used without further purification.
Chemistry
General microwave-assisted reaction procedure for the synthesis of biguanide derivatives (for compounds 1 and 5–14)
Biguanide derivatives were prepared by modifying a procedure reported in the literature.19 The amine derivative (0.82–2.4 mmol) was added to a solution of dicyandiamide (1.0 eq) in 2.4–3.7 mL of dry CH3CN, and TMSCl (1.1 eq) was slowly added dropwise to the mixture. The mixture was stirred and irradiated with adjustable power in the range of 0–400 W, at 2.45 GHz for 10 or 15 minutes at 130°C or 150°C using a microwave reactor (Biotage® Initiator 2.0; Biotage AB, Uppsala, Sweden). After the mixture was cooled down to approximately 50°C, isopropyl alcohol (iPrOH) (3.0 eq) was added slowly, and the mixture was further stirred and irradiated at 125°C for 1 minute. The precipitation of the biguanide hydrochloride salt was washed twice with CH3CN. The preparation of compound 1 was included in Supplementary material.
2-(4-hydroxyphenyl)ethylbiguanide hydrochloride (compound 5)
Following the general procedure, the reaction of 4-hydroxy-phenylethylamine (compound 16) (329.2 mg, 2.4 mmol) was performed under the irradiation condition (150°C, 10 minutes, 3.2 mL dry CH3CN) to afford compound 520 (495.6 mg, 80%). The analytical sample was obtained by recrystallization from H2O and CH3CN as a colorless powder. mp 185°C–189°C (lit 182°C–184°C); 1H NMR (500 MHz, DMSO-d6): δ=2.77 (t, J=7.7 Hz, 2H), 2.92 (br, 2H), 6.73 (d, J=8.6 Hz, 2H), 7.04 (d, J=8.6 Hz, 2H), 8.08, 9.38 (br s, total 4H); DARTMS: m/z calcd for [M-Cl]+: 222, found 222.
2-(4-methoxyphenyl)ethylbiguanide hydrochloride (compound 6)
Following the general procedure, the reaction of 4-methoxy-phenylethylamine (compound 17) (362.9 mg, 2.4 mmol) was performed under the irradiation condition (150°C, 15 minutes, 3.6 mL dry CH3CN) to afford compound 621 (209.5 mg, 30%). The analytical sample was obtained by recrystallization from iPrOH as a colorless powder. mp 173°C–175°C (lit 171°C–172°C); 1H NMR (400 MHz, CD3OD): δ=2.78 (br, 2H), 3.43 (t, J=7.2 Hz, 2H), 3.76 (s, 3H), 6.85 (d, J=8.8 Hz, 2H), 7.15 (d, J=8.8 Hz, 2H); DARTMS: m/z calcd for [M-Cl]+: 236, found 236.
2-(2-methylphenyl)ethylbiguanide dihydrochloride (compound 7)
Following the general procedure, the reaction of 2-methyl-phenylethylamine (compound 18) (135.2 mg, 1.0 mmol) was performed under the irradiation condition (130°C, 10 minutes, 3.0 mL dry CH3CN) to afford compound 7 hydrochloride (217.0 mg, 85%). The analytical sample was obtained by recrystallization from EtOH as a colorless powder, compound 7 dihydrochloride. mp 173°C–174°C; IR (KBr) νmax cm−1: 3243, 3053, 1687, 1631, 1542, 1459; 1H NMR (500 MHz, DMSO-d6): δ=2.31 (s, 3H), 2.87 (br s, 2H), 3.45 (br s, 2H), 7.13–7.26 (m, 4H), 7.76, 8.56, 9.14, 9.68 (br s, total 6H); 13C NMR (125 MHz, DMSO-d6): δ=19.0, 30.7, 42.6, 126.0, 126.6, 129.1, 130.1, 136.0, 136.3, 151.9, 155.1. DARTMS: m/z calcd for [M-2Cl-H]+: 220, found 220. Anal Calcd for C11H19Cl2N5: C, 45.21; H, 6.55; N, 23.97. Found: C, 45.04; H, 6.45; N, 23.93.
2-(3-methylphenyl)ethylbiguanide dihydrochloride (compound 8)
Following the general procedure, the reaction of 3-methyl-phenylethylamine (compound 19) (135.2 mg, 1.0 mmol) was performed under the irradiation condition (130°C, 10 minutes, 3.0 mL dry CH3CN) to afford compound 8 hydrochloride (241.0 mg, 94%). The analytical sample was obtained by recrystallization from EtOH as a colorless powder, compound 8 dihydrochloride. mp 162°C–163°C; IR (KBr) νmax cm−1: 3252, 3069, 1685, 1629, 1534, 1459; 1H NMR (400 MHz, CD3OD): δ=2.33 (s, 3H), 2.95 (t, J=7.6 Hz, 2H), 3.60 (t, J=7.6 Hz, 2H), 7.05–7.23 (m, 4H); 13C NMR (100 MHz, CD3OD): δ=21.5, 34.7, 45.4, 126.8, 128.6, 129.7, 130.5, 138.5, 139.5, 153.8, 156.4; DARTMS: m/z calcd for [M-2Cl-H]+: 220, found 220. Anal Calcd for C11H19Cl2N5: C, 45.21; H, 6.55; N, 23.97. Found: C, 45.04; H, 6.50; N, 23.98.
2-(4-methylphenyl)ethylbiguanide dihydrochloride (compound 9)
Following the general procedure, the reaction of 4-methyl-phenylethylamine (compound 20) (135.2 mg, 1.0 mmol) was performed under the irradiation condition (130°C, 10 minutes, 3.0 mL dry CH3CN) to afford compound 9 hydrochloride21 (213.0 mg, 83%). The analytical sample was obtained by recrystallization from EtOH as a colorless powder, compound 9 dihydrochloride. mp 162°C–163°C; 1H NMR (400 MHz, CD3OD): δ=2.30 (s, 3H), 2.94 (t, J=7.6 Hz, 2H), 3.58 (t, J=7.6 Hz, 2H), 7.14 (d, J=8.4 Hz, 2H), 7.29 (d, J=8.4 Hz, 2H); 13C NMR (100 MHz, CD3OD): δ=21.1, 34.4, 45.4, 129.7, 130.4, 135.5, 137.6, 153.7, 156.4; DARTMS: m/z calcd for [M-2Cl-H]+: 220, found 220. Anal Calcd for C11H19Cl2N5: C, 45.21; H, 6.55; N, 23.97. Found: C, 45.03; H, 6.50; N, 23.84.
2-(4-tert-butylphenyl)ethylbiguanide dihydrochloride (compound 10)
Following the general procedure, the reaction of 4-(tert-butyl)-phenylethylamine (compound 21) (177.3 mg, 1.0 mmol) was performed under the irradiation condition (130°C, 10 minutes, 3.0 mL dry CH3CN) to afford compound 10 hydrochloride (262.9 mg, 88%). The analytical sample was obtained by recrystallization from EtOH as a colorless powder, compound 10 dihydrochloride. mp 178°C–179°C; IR (KBr) νmax cm−1: 3243, 3057, 1685, 1630, 1536; 1H NMR (500 MHz, DMSO-d6): δ=1.27 (s, 9H), 2.84 (br s, 2H), 3.47 (br s, 2H), 7.24 (d, J=8.0 Hz, 2H), 7.33 (d, J=8.0 Hz, 2H), 7.80, 8.55, 9.16, 9.64 (br s, total 6H); 13C NMR (125 MHz, DMSO-d6): δ=31.1, 32.8, 34.0, 43.7, 125.0, 128.3, 134.9, 148.7, 151.8, 154.9; DARTMS: m/z calcd for [M-2Cl-H]+: 262, found 262; Anal Calcd for C14H25Cl2N5: C, 50.30; H, 7.54; N, 20.95. Found: C, 50.08; H, 7.46; N, 20.87.
2-{4-(2-acetylaminoethyl)phenyl}ethylbiguanide dihydrochloride (compound 11)
Following the general procedure, the reaction of 4-(acetylaminoethyl)phenylethylamine (compound 22) (200 mg, 0.82 mmol) was performed under the irradiation condition (150°C, 10 minutes, 2.4 mL dry CH3CN) to afford compound 11 hydrochloride (260.6 mg, 97%). The analytical sample was obtained by recrystallization from EtOH as a colorless powder, compound 11 dihydrochloride. mp 151°C–152°C; IR (KBr) νmax cm−1: 3283, 3087, 1685, 1629, 1560, 1439; 1H NMR (500 MHz, DMSO-d6): δ=1.77 (s, 3H), 2.65 (br, 2H), 2.82 (br, 2H), 3.20 (br, 2H), 3.45 (br, 2H), 7.14 (br, 2H), 7.21 (br, 2H), 8.03, 8.53, 9.13, 9.61 (br s, total 6H); 13C NMR (125 MHz, DMSO-d6): δ=22.6, 33.0, 34.8, 40.2, 43.7, 128.7, 128.8, 135.7, 137.7, 152.0, 155.0, 169.1; DARTMS: m/z calcd for [M-2Cl-H]+: 291, found 291. Anal Calcd for C14H24Cl2N6O: C, 46.29; H, 6.66; N, 23.13. Found: C, 45.93; H, 6.66; N, 22.90.
2-(2-chlorophenyl)ethylbiguanide dihydrochloride (compound 12)
Following the general procedure, the reaction of 2-chloro-phenylethylamine (compound 23) (155.6 mg, 1.0 mmol) was performed under the irradiation condition (130°C, 10 minutes, 3.0 mL dry CH3CN) to afford compound 12 hydrochloride (243.8 mg, 88%). The analytical sample was obtained by recrystallization from EtOH as a colorless powder, compound 12 dihydrochloride. mp 165°C–167°C; IR (KBr) νmax cm−1: 3222, 3053, 1688, 1631, 1540, 1475, 1447; 1H NMR (500 MHz, DMSO-d6): δ=3.02 (br s, 2H), 3.50 (br s, 2H), 7.28–7.51 (m, 4H), 7.65, 8.54, 9.18, 9.68 (br s, total 6H); 13C NMR (125 MHz, CD3OD): δ=32.5, 43.7, 128.6, 129.9, 130.8, 132.7, 135.1, 136.3, 154.0, 156.5; DARTMS: m/z calcd for [M-2Cl-H]+: 240, found 240. Anal Calcd for C10H16Cl3N5: C, 38.42; H, 5.16; N, 22.40. Found: C, 38.27; H, 5.05; N, 22.48.
2-(3-chlorophenyl)ethylbiguanide dihydrochloride (compound 13)
Following the general procedure, the reaction of 3-chloro-phenylethylamine (compound 24) (155.6 mg, 1.0 mmol) was performed under the irradiation condition (130°C, 10 minutes, 3.0 mL dry CH3CN) to afford compound 13 hydrochloride (244.0 mg, 88%). The analytical sample was obtained by recrystallization from EtOH as a colorless powder, compound 13 dihydrochloride. mp 154°C; IR (KBr) νmax cm−1: 3258, 3070, 1686, 1627, 1534, 1476, 1431; 1H NMR (400 MHz, CD3OD): δ=2.99 (t, J=7.6 Hz, 2H), 3.61 (t, J=7.6 Hz, 2H), 7.25–7.37 (m, 4H); 13C NMR (100 MHz, CD3OD): δ=34.4, 45.0, 128.1, 128.3, 129.9, 131.3, 135.5, 141.1, 153.9, 156.4; DARTMS: m/z calcd for [M-2Cl-H]+: 240, found 240. Anal Calcd for C10H16Cl3N5: C, 38.42; H, 5.16; N, 22.40. Found: C, 38.37; H, 5.07; N, 22.27.
2-(4-chlorophenyl)ethylbiguanide dihydrochloride (compound 14)
Following the general procedure, the reaction of 4-chloro-phenylethylamine (compound 25) (155.6 mg, 1.0 mmol) was performed under the irradiation condition (130°C, 10 minutes, 3.0 mL dry CH3CN) to afford compound 1422 hydrochloride (231.0 mg, 84%). The analytical sample was obtained by recrystallization from EtOH as a colorless powder, compound 14 dihydrochloride. mp 153°C; 1H NMR (400 MHz, CD3OD): δ=2.98 (t, J=7.6 Hz, 2H), 3.60 (t, J=7.6 Hz, 2H), 7.21 (d, J=8.8 Hz, 2H), 7.34 (d, J=8.8 Hz, 2H); 13C NMR (100 MHz, CD3OD): δ=34.1, 45.1, 129.8, 131.5, 133.8, 137.5, 153.9, 156.4; DARTMS: m/z calcd for [M-2Cl-H]+: 240, found 240. Anal Calcd for C10H16Cl3N5: C, 38.42; H, 5.16; N, 22.40. Found: C, 38.24; H, 5.05; N, 22.42.
Preparation of test compounds
All of the test compounds were prepared as stock solutions of 100 mM in DMSO and stored in aliquots at −20°C. The final concentrations of DMSO were 1% (v/v) for the cell viability assay and 0.25% (v/v) for the other in vitro assays.
Cell lines and cell treatments
Cells were maintained in Eagle’s Minimum Essential Medium (EMEM) (Wako Pure Chemical Industries, Ltd) containing 1 mg/mL glucose, with additional 1% (v/v) MEM nonessential amino acid (GIBCO®; Life Technologies Corp, Carlsbad, CA, USA) (for the human embryo kidney [HEK]-293 cell line), or Roswell Park Memorial Institute (RPMI) 1640 medium (Wako Pure Chemical Industries, Ltd) containing 2.0 mg/mL glucose (for the human colon cancer HT-29 cell line). Both media were supplemented with 10% heat-inactivated fetal bovine serum (GIBCO®; Life Technologies Corp or NICHIREI Corp, Tokyo, Japan), 50 units/mL penicillin, 50 μg/mL streptomycin, and 50 μg/mL kanamycin (Meiji Seika Pharma Corp, Ltd, Tokyo, Japan). All cell lines were cultured at 37°C in a humidified atmosphere containing 5% CO2, as the normal growth condition. For a glucose deprivation condition, cells were treated with 0.3 mM 2-deoxyglucose (2-DG) (Sigma-Aldrich, St Louis, MO, USA) or cultured in glucose-free medium for the indicated period. The glucose-free RPMI 1640 (GIBCO®; Life Technologies Corp) was supplemented with 10% heat-inactivated fetal bovine serum, 50 units/mL penicillin, 50 μg/mL streptomycin, and 50 μg/mL kanamycin. To achieve a hypoxic condition, cells were incubated under an atmosphere of mixed gas (1% O2, 94% N2, and 5% CO2) for the indicated time in an air-tight chamber (Modular Incubator Chamber; Billups-Rothenberg Inc., San Diego, CA, USA). All compounds were added, at various final concentrations, immediately after replacing the medium with 2-DG-containing medium or glucose-free medium, whereas hypoxic treatment was performed after the addition of compounds.
Transfection and cloning of stable transformants for reporter assay
To evaluate the inhibition of test compounds on HIF-1 activity, we used stable transformants of HEK293 cells expressing reporter plasmid p2.1 (kind gift from Dr Gregg L Semenza, Johns Hopkins University), established in a previous report.6 In addition, we also established stable reporter clones of HEK293 cells expressing pGRP78pro160-luc plasmid23 containing human glucose-regulated protein (GRP)78 promoter region (kind gift from Dr Akihiro Tomida, Japanese Foundation for Cancer Research) for the evaluation of UPR activity. The HEK293 cells were transfected with pGRP78pro160-luc along with a pcDNA 3.1 vector (Life Technologies Corp, Carlsbad, CA, USA) containing a neomycin-resistant gene, using FuGENE® HD Transfection Reagent (Roche Applied Science, Penzberg, Germany), followed by selection with Geneticin® (G418) disulfate salt (Sigma-Aldrich) to generate single cell clones. Then the clones were screened for luciferase activity induced by the treatment with 20 mM 2-DG.
Cell-based luciferase reporter assay
We performed the luciferase reporter assay according to the procedure for HIF-1 transcriptional activation in our previous paper.6 In brief, HEK293 clone cells were plated into 24-well plates (8.0×10⁴ cells per well) for 24 hours. For the hypoxia treatment, after the medium exchange with a fresh medium containing the test compounds and incubation for 1 hour, the cells were incubated for 24 hours under normoxic or hypoxic conditions. In the case of the glucose deprivation stress treatment, after the medium exchange with a fresh normal medium containing the test compounds and 0.3 mM 2-DG, the cells were incubated for 24 hours. The assay was conducted according to the luciferase assay kit instructions (Roche Applied Science, Penzberg, Germany). The activity was measured using a luminometer (Sirius Single Tube Luminometer; Berthold Detection Systems GmbH [Titertek-Berthold], Bad Wildbad, Germany).
Cell viability assay for selective cytotoxicity to glucose-deprived tumor cells
HT29 cells were cultured overnight in 96-well plates (3.0×10³ cells per well) and then treated with various concentrations of compounds in the normal or glucose-free medium for 48 hours. Then the medium was replaced with fresh normal medium, and the cells were cultured for a further 16 hours. Subsequently, 3-(4,5-dimethylthiazol-2-yl)-2,5-diphenyltetrazolium bromide (MTT) (Sigma-Aldrich) solution (0.5 mg/mL) was added to the culture medium. After a 4-hour incubation at 37°C, the medium was removed and DMSO was added (100 μL/well); then, absorbance of each well was determined at 570 nm by Multiskan JX plate reader (Thermo Scientific, Waltham MA, USA). Relative cell survival (mean ± standard deviation [SD] of triplicate determinations) was calculated by setting each of the control absorbance from nondrug-treated cells at 100%.
Immunoblot analysis
HT29 cells were cultured overnight in φ100 mm culture dishes (6.0×10⁶ cells) and then treated with various concentrations of compounds, under hypoxia for 4 hours or glucose deprivation condition for 24 hours. Then, cells were lysed, and the protein concentrations were measured as described previously.6 After electrophoresis of the protein samples with a 7% sodium dodecyl sulfate (SDS)-polyacrylamide gel (Wako Pure Chemical Industries, Ltd), the proteins were electrotransferred to Hybond-ECL nitrocellulose membranes (GE Healthcare, Little Chalfont, UK) or polyvinylidene fluoride (PVDF) membrane (Bio-Rad Laboratories, Inc., Hercules, CA, USA). Immunoblot analysis was probed with the following primary antibodies: mouse KDEL monoclonal antibody (10C3) for detection of GRP78 and GRP94 (Stressgen SPA-827; Enzo Life Sciences, Inc., Farmingdale, NY, USA), mouse monoclonal antibody against human HIF-1α (H1alpha67) (NB100-105; Novus Biologicals, Littleton, CO, USA), goat polyclonal anti-human β-actin antibody (I-19) (sc-1616; Santa Cruz Biotechnology, Inc., Dallas, TX, USA). Membranes were pretreated for 1 hour with Tris-buffered saline with Tween® (TBS–T) (50 mM Tris–HCl [pH7.5], 150 mM NaCl, and 0.1% Tween 20 [Wako Pure Chemical Industries, Ltd]) containing 5% nonfat dry milk or 1% bovine serum albumin (BSA; Wako Pure Chemical Industries, Ltd) at room temperature. Then the membranes were incubated, at 4°C for 10 hours with the anti-HIF-1α antibody (diluted 1:1,000), at room temperature for 1 hour with anti-KDEL antibody (diluted 1:1,000), or at room temperature for 1 hour with the anti-β-actin antibody (diluted 1:3,000). The membranes were washed with TBS–T containing 5% nonfat dry milk or 1% BSA at room temperature and incubated at room temperature for 1 hour with appropriate horseradish peroxidase-labeled secondary: Anti-Mouse IgG (whole molecule) peroxidase conjugate (A4416; Sigma-Aldrich) and Anti-Goat IgG (whole molecule) peroxidase conjugate (A5420; Sigma-Aldrich). After washing with TBS–T, the specific signals were detected with an enhanced chemiluminescence detection system (Pierce®; Thermo Scientific or Immobilon™, Merck Millipore, Billerica, MA, USA) and visualized with a Fujifilm Luminescent Image Analyzer LAS-3000 (Fujifilm, Tokyo, Japan).
ELISA for VEGF-A protein
HT29 cells were cultured overnight in 24-well plates (8.0×10⁴ cells per well) and then treated with various concentrations of compounds, under hypoxia or glucose deprivation conditions, for 24 hours. Following the 24-hour incubation, the supernatant samples were collected and stored at −80°C. The levels of vascular endothelial growth factor (VEGF)-A in the samples were measured by enzyme-linked immunosorbent assay (ELISA) using a commercial kit Human VEGF-A Platinum ELISA (eBioscience, San Diego, CA, USA) with the following modifications: The optical density at 450 nm was measured with correction wavelength at 630 nm, by the Multiskan JX plate reader. Sample VEGF-A protein concentration was calculated using a formula derived from the VEGF-A standard curve, within the linear detection range. Total protein concentrations were determined using a Pierce® BCA Protein Assay Kit (Thermo Scientific).
Chick chorioallantoic membrane assay in fertilized chicken eggs
The antiangiogenic effect of compounds in vivo was evaluated by chick chorioallantoic membrane (CAM) assay.24 Briefly, fertilized chicken eggs were incubated at 37.5°C in a humidified incubator with forced air circulation. Ovalbumin (3 mL) was removed from 3-day-old embryonated eggs. Then a small hole was drilled on each egg shell and capped, and the eggs were incubated at 39.0°C–39.5°C. After a 1-day incubation, each compound saline solution, with 2.0% DMSO and 1.0% methylcellulose, was applied on the center of silicon rings (outer diameter, 5 mm; inner diameter, 3 mm; height, 1 mm) that were placed on each of the CAMs, and the eggs were incubated at 39.0°C–39.5°C for 2 days. The results of the assays were scored and photographed on the seventh embryonic day. Saline solution, with 2.0% DMSO and 1.0% methylcellulose, was used as a vehicle. Eight to ten eggs were used in total for each data point. The inhibition point was judged by an estimation of the area of the avascular zone. The inhibition ratios were calculated from the following formula:
| (1) |
Statistical analysis
For the results of the reporter assays and ELISA, statistical differences between the control and compound-treated samples were evaluated by Student’s t-test, as indicated in the figures (*P<0.05, **P<0.01 versus control). The dose-response results of the reporter assays and cell viability assays were presented as the mean ± SD of three independent experiments, with each treatment performed in duplicate for the reporter assays and in triplicate for the cell viability assay.
Results and discussion
Structural development of biguanide derivatives
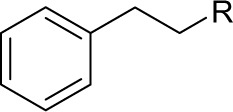
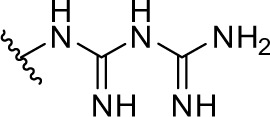
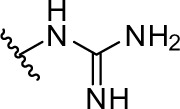
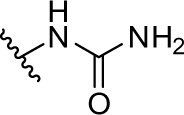
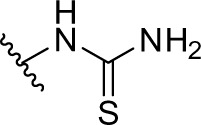
We chose the basic structure of phenformin (compound 1), which consists of an aryl group, an ethylene linker, and an imidodicarbonimidic diamide (biguanide) moiety, as a scaffold for the structural optimization of biguanides because phenformin (1) was reported to show the most potent selective cytotoxicity against glucose-deprived cells, among the antidiabetic biguanides metformin, buformin, and phenformin (1) (Figure 1A).15 The aromatic and biguanide moieties were varied to optimize inhibitory activities toward the stress responses of TME (Figure 1B). A series of biguanide, guanidine, urea, and thiourea derivatives were also prepared to explore the role of the biguanide moiety in their inhibitory effects towards HIF-1- and UPR-mediated transcriptional activation. Compounds 2, 3, and 4 were obtained easily from phenethylamine (compound 15) (Figure S1A–C). To assess the effects of substituents on the aromatic moiety, various analogues, substituted with halogens or alkyl groups at different positions, were also synthesized. All the biguanide analogs were obtained efficiently from the corresponding primary amines and dicyandiamide within 10–15 minutes, using microwave irradiation according to the modified Mayer’s method19 (Figure 2). Amine 22 was synthesized from the corresponding nitrile derivative (Figure S1D).
Figure 2.

Microwave-assisted synthesis of biguanide derivatives 1 and 5–14.
Note: The bolded numbers identify a specific compound.
Abbreviations: iPrOH, isopropyl alcohol; TMSCI, trimethylsilyl chloride.
Inhibitory effect on HIF-1- and UPR-mediated transcriptional activation and selective cytotoxicity under glucose deprivation
For first-stage screening, we established cell-based luciferase reporter assay systems responding to hypoxia and glucose deprivation stress. To examine the effects of the synthesized compounds on the hypoxia stress response, a luciferase assay was performed using HEK293 cells expressing a HIF-1-responsive luciferase reporter gene (p2.1) activated by hypoxic stress (1% O2).6,25 To evaluate the effects of the compounds on UPR induced by glucose deprivation, stable reporter cell lines were generated by transfecting the pGRP78pro160-luc vector,23 which contains the GRP78 promoter-reporter gene, into HEK293 cells. The cell lines obtained from this transfection expressed luciferase in response to treatment with 2-DG. The UPR reporter assay was performed using cells treated with 0.3 mM 2-DG. Concurrently, we performed an MTT assay using HT29 colon cancer cells to evaluate the selective cytotoxicity of the compounds under glucose deprivation.
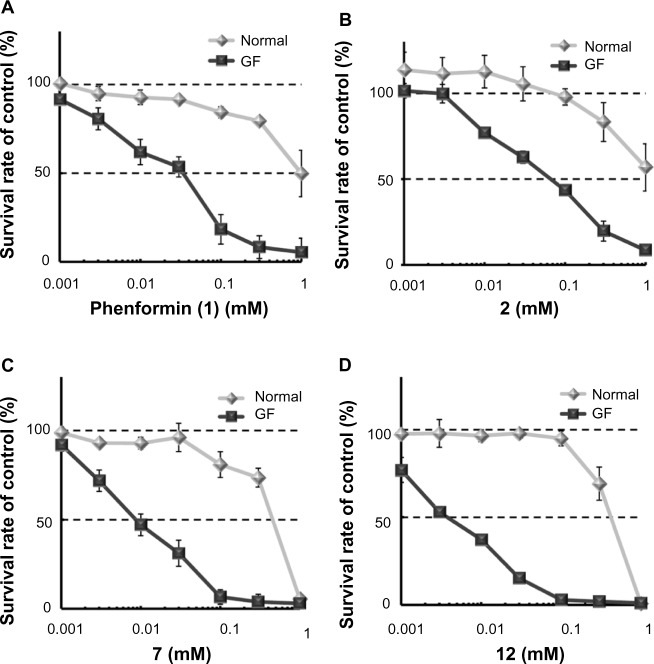
As shown in Table 1 and Figure 3A, phenformin (compound 1) suppressed 2DG-induced GRP78 promoter activity and showed selective cytotoxicity during glucose deprivation, which is consistent with a previous report.15 Furthermore, we found that phenformin (1) also substantially reduced hypoxia-induced HIF-1 promoter activity. Because we predicted that guanidine, urea, and thiourea groups may serve as bioisosteric replacements for the biguanide group, given their abilities as multiple hydrogen bond donors, compounds 1–4 were subjected to the luciferase assays. Among them, only compound 2, which possesses a guanidine group, showed activities comparable with those of phenformin (1) in both the HIF-1 and UPR reporter assays. Furthermore, compound 2 had selective cytotoxicity under glucose deprivation conditions, similar to phenformin (1) (Figure 3B). Considering their estimated pKas and clogD values, phenformin (1) and compound 2 are considered to exist as monocations under physiological conditions, whereas compounds 3 and 4 may exist as neutral forms. It is known that biguanides, including metformin and phenformin (1), require cation transporters, such as the organic cation transporters (OCTs), to facilitate their cellular uptake.26,27 More recently, it has been reported that OCT1 is not necessary for the cellular uptake of phenformin (1) or for its antiproliferative effect on ovarian cancer cells and melanoma, in contrast to metformin.28,29 However, OCT1 contributes to the uptake of phenformin into mitochondria.30 Taken together, the monocationic moiety may play a role in a molecular interaction with an unidentified target molecule in cells.
Table 1.
IC50 on HIF-1 and UPR activation and for selective cytotoxicity under glucose deprivation and physical parameters of phenethyl derivatives
| |||||||
|---|---|---|---|---|---|---|---|
| Compound | R | IC50 of transactivation (μM)
|
IC50 of cytotoxicity (μM)c
|
clogD (pH 7.4)e | |||
| HIF-1a | GRP78b | GIc (+) | GIc (−) | ||||
| Phenformin (1) |
|
27.4±6.1 | 107.8±9.4 | 976.2±95.0 | 46.2±9.2 | 12.2 | −6.64 |
| 2 |
|
23.3±8.0 | 46.1±7.3 | >1,000 | 87.6±4.2 | 13.1 | −2.23 |
| 3 |
|
>100 | >100 | >100 | >100 | −0.2 | 0.81 |
| 4 |
|
>100 | >100 | >100 | >100 | 1.2 | −1.81 |
Notes:
IC50 values for inhibition of HIF-1 activity were obtained using HEK293 p2.1 #3 cells under hypoxia (1% O2) for 24 hours with the test compounds
IC50 values for inhibition of GRP78 promoter activity were obtained using HEK293 GRP78 #85 cells treated with 0.3 mM 2-DG and the test compounds for 24 hours
IC50 values from MTT assay using HT29 cells treated with the test compounds incubated in normal or glucose-free medium for 48 hours. Values are the mean ± SD of triplicate experiments
the pKa values of neutral–monocation equilibria were calculated by ACD/pKa DB Product version 12.5 (Fujitsu Limited, Tokyo, Japan)
the clogD values were calculated by DS Accord for Excel version 7.1.5 (Accelrys Software, Inc., Santa Clara, CA, USA).
Abbreviations: 2-DG, 2-deoxyglucose; GRP, glucose-regulated protein; HEK, human embryo kidney; HIF, hypoxia-inducible factor; IC50, half maximal inhibitory concentration; clogD, calculated distribution coefficient; MTT, 3-(4,5-dimethylthiazol-2-yl)-2,5-diphenyltetrazolium bromide; SD, standard deviation; UPR, unfolded protein response.
Figure 3.
Selective cytotoxicity of phenformin (1) and compounds 2, 7, and 12 during glucose deprivation.
Notes: Cell viability was determined by MTT assay, using HT29 cells treated with phenformin (1) (A) and compounds 2 (B), 7 (C), and 12 (D), under normal or glucose-deprived condition for 48 hours. Each point represents mean ± SD of triplicate experiments.
Abbreviations: GF, glucose-free; MTT, 3-(4,5-dimethylthiazol-2-yl)-2,5-diphenyltetrazolium bromide; SD, standard deviation.
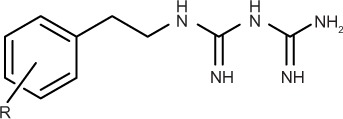
Next, we explored the effects of phenyl group substituents on the inhibition of HIF-1 and UPR activation. Introduction of substituents, with various steric and electronic characteristics, on the phenyl ring substantially affected the inhibitory activities of the compounds (Table 2). Compounds 5 and 11, possessing p-OH and p-acetylaminoethyl groups, respectively, showed no activity in any of the assays. Introduction of methoxy or bulky alkyl groups at the para position of the phenyl moiety (compounds 6 and 10) reduced the inhibitory effect on GRP78 promoter activity and enhanced cytotoxicity under both normal and glucose deprivation conditions. These results suggest that polar or bulky para-substituents impair the desired biological effects. On the other hand, introduction of a methyl or chloro group at any position of phenyl ring (compounds 7–9 and 12–14) considerably enhanced all the activities. In particular, their HIF-1 inhibitory activity increased around fivefold, and their selective cytotoxicity against glucose-deprived HT-29 cells was enhanced up to tenfold, compared with those of phenformin (1). The o-substituted derivatives, compounds 7 and 12, had selective cytotoxicity superior to those of the corresponding m- or p-substituted compounds. Chloro-substituted derivatives generally showed slightly stronger cytotoxicity under normal glucose conditions and lower selectivity than did methyl-substituted derivatives. However o-Cl-substituted compound 12 exhibited the best selective cytotoxicity among all the derivatives tested here (Figure 3C and D). From these data, introduction of methyl or chloro groups in the ortho position of the phenyl ring efficiently improves the inhibitory effects on HIF-1- and UPR-mediated transcriptional activation and selective cytotoxicity during glucose deprivation. Considering that methyl and chloro groups have opposite electronic effects but similar steric parameters [υ (Me): 0.52, υ (Cl); 0.55],31 steric rather than electronic effects appear to determine their biological activities.
Table 2.
IC50 on HIF-1 and UPR activation and for selective cytotoxicity under glucose deprivation and physical parameters of biguanide derivatives
| ||||||
|---|---|---|---|---|---|---|
| Compound | R | IC50 of transactivation (μM)
|
Cytotoxicity
|
|||
| HIF-1a | GRP78b | IC50 (μM)c
|
Selectivityd
|
|||
| GIc (+) | GIc (−) | GIc (+)/GIc (−) | ||||
| Phenformin (1) | H | 27.4±6.1 | 107.8±9.4 | 976.2±95.0 | 46.2±9.2 | 21 |
| 5 | p-OH | >100 | >100 | >100 | >100 | – |
| 6 | p-OMe | 35.3±8.0 | >100 | 25.3±0.9 | 19.6±0.4 | 1.3 |
| 7 | o-Me | 6.0±0.1 | 87.9±4.9 | 403.1 ±31.2 | 7.2±3.5 | 56 |
| 8 | m-Me | 4.9±0.6 | 57.0±3.9 | 314.1 ±12.0 | 9.3±1.5 | 34 |
| 9 | p-Me | 5.2±0.4 | 60.4±2.4 | 346.0±3.5 | 8.2±1.1 | 42 |
| 10 | p-tBu | 14.4 ±0.7 | >100 | 87.8± 1.7 | 23.4±4.1 | 3.8 |
| 11 | p-CH2CH2NHAc | >100 | >100 | >1,000 | >1,000 | – |
| 12 | o-Cl | 5.8±0.3 | 37.4±3.1 | 350.4±11.9 | 5.2±0.7 | 67 |
| 13 | m-Cl | 3.6±0.2 | 61.5±4.2 | 157.5±8.5 | 8.9±1.2 | 18 |
| 14 | p-Cl | 5.2±0.9 | 88.2±2.7 | 170.6±22.3 | 18.9±4.3 | 9.0 |
Notes:
IC50 values for the inhibition of HIF-1 activity were obtained using HEK293 p2.1 #3 cells under hypoxia (1% O2) for 24 hours with the test compounds
IC50 values for inhibition of GRP78 promoter activity were obtained using HEK293 GRP78 #85 cells treated with 0.3 mM 2-DG and the test compounds for 24 hours
IC50 values from MTT assay using HT29 cells treated with the test compounds incubated in normal or glucose-free medium for 48 hours. Values are the mean ± SD of triplicate experiments.
Selectivity was obtained from (IC50 in normal medium)/(IC50 in glucose-free medium).
Abbreviations: 2-DG, 2-deoxyglucose; GRP, glucose-regulated protein; HEK, human embryo kidney; HIF, hypoxia-inducible factor; IC50, half maximal inhibitory concentration; MTT, 3-(4,5-dimethylthiazol-2-yl)-2,5-diphenyltetrazolium bromide; SD, standard deviation; UPR, unfolded protein response.
Effects on HIF-1 and UPR signaling pathways and angiogenesis in vivo
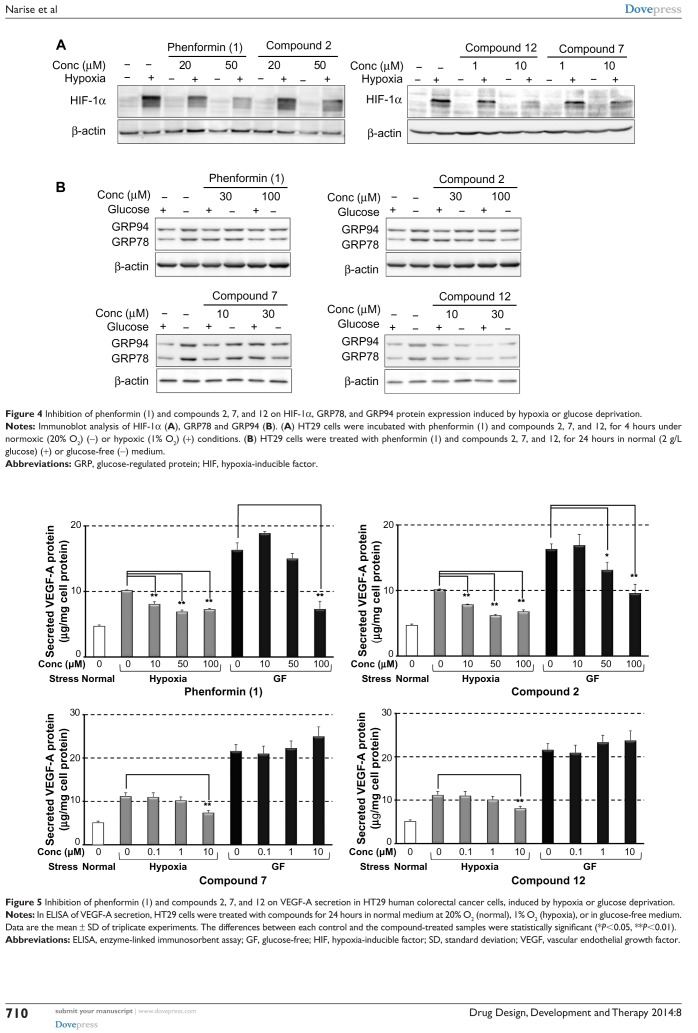
From the results of the structure activity relationship (SAR) study described above, compounds 2, 7, and 12 were selected for further evaluation. We initially examined their effects on HIF-1- and UPR-mediated protein expression. As shown in Figure 4A, compounds 7 and 12, at concentrations of 1 and 10 µM, suppressed HIF-1α protein expression induced by hypoxia more effectively than did phenformin (1) or compound 2 at 20 and 50 µM. The UPR-inhibitory activities were also confirmed by immunoblot analysis of endogenous GRP78 and GRP94 (Figure 4B). Compounds 7 and 12, at concentrations of 10 and 30 μM, reduced GRP78 and GRP94 expression induced by glucose deprivation, to a level similar to that produced by phenformin (1) and compound 2 at 30 and 100 μM. These results correlated with their activity tendencies in the HIF-1 and UPR reporter assays (Tables 1 and 2).
Figure 4.
Inhibition of phenformin (1) and compounds 2, 7, and 12 on HIF-1α, GRP78, and GRP94 protein expression induced by hypoxia or glucose deprivation.
Notes: Immunoblot analysis of HIF-1α (A), GRP78 and GRP94 (B). (A) HT29 cells were incubated with phenformin (1) and compounds 2, 7, and 12, for 4 hours under normoxic (20% O2) (−) or hypoxic (1% O2) (+) conditions. (B) HT29 cells were treated with phenformin (1) and compounds 2, 7, and 12, for 24 hours in normal (2 g/L glucose) (+) or glucose-free (−) medium.
Abbreviations: GRP, glucose-regulated protein; HIF, hypoxia-inducible factor.
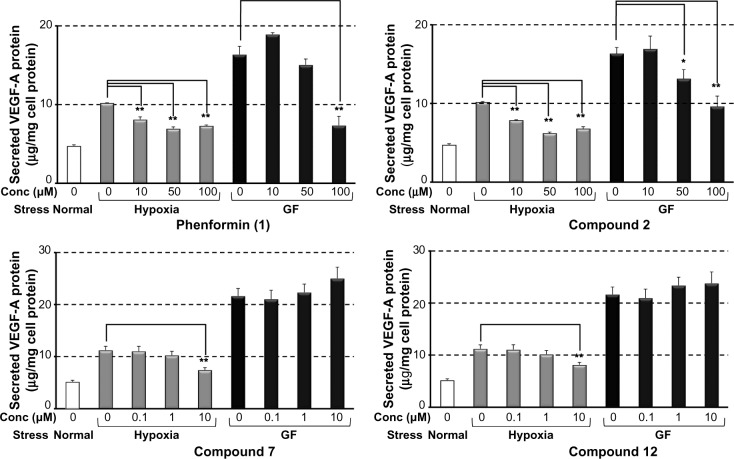
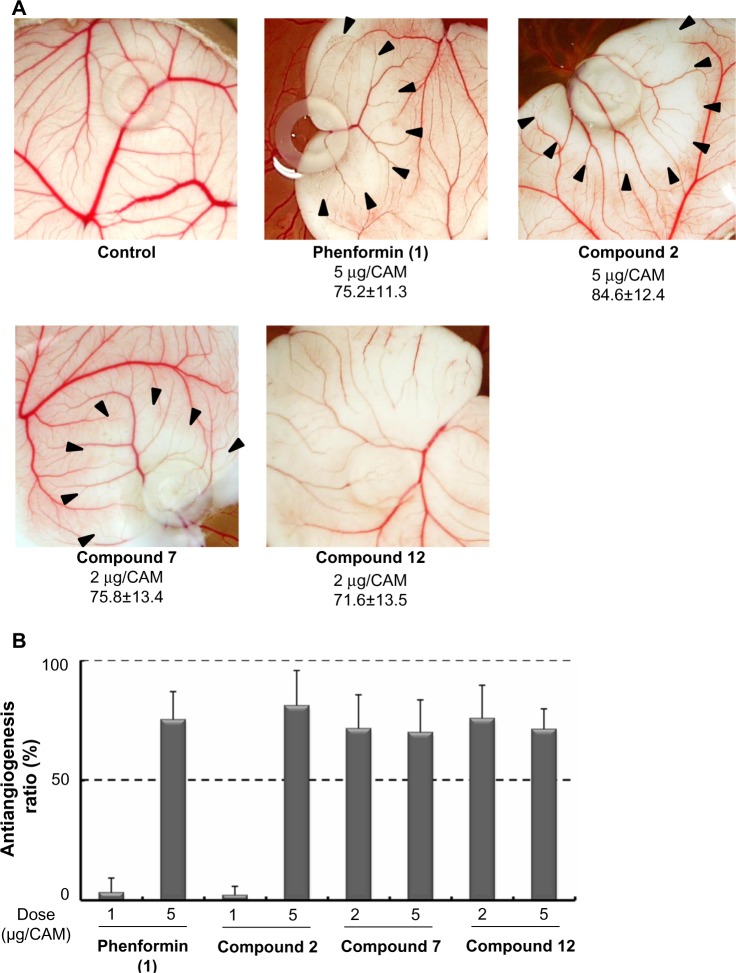
It was recently reported that metformin inhibited endothelial cell migration, VEGF expression, and angiogenesis in vitro and in vivo and that the effect was partially AMPK-dependent.32 Antiangiogenic therapy is currently recognized as a promising strategy for antitumor therapy targeting TME.3 Therefore, we next evaluated the effect of the selected compounds on the secretion of VEGF induced by hypoxia or glucose deprivation. We measured VEGF-A secretion, using ELISA, from HT29 cells cultured under hypoxia (1% O2) or in a glucose-free medium after treatment with phenformin (1), and compounds 2, 7, and 12 for 24 hours at noncytotoxic concentrations respectively. As shown in Figure 5, phenformin (1) and compound 2 significantly inhibited the secretion of VEGF-A induced by hypoxia at concentrations of 10–100 μM, whereas higher concentrations (for compound 1, 100 μM, and for compound 2, 50–100 μM) were necessary to reduce the secretion of VEGF-A induced by glucose deprivation. Compounds 7 and 12 inhibited VEGF-A secretion induced by hypoxia at a concentration of 10 μM, but they did not suppress VEGF-A secretion induced by glucose deprivation at concentrations of 0.1–10 μM. Because these results suggested the possibility that these compounds possess antiangiogenic activity, we next performed a CAM assay24 to evaluate the antiangiogenic activity in vivo. We found that phenformin (1) and compound 2 substantially inhibited angiogenesis in CAM (Figure 6) at a dose of 5 μg/CAM and that compounds 7 and 12 showed more potent antiangiogenic activity at a dose of 2 μg/CAM.
Figure 5.
Inhibition of phenformin (1) and compounds 2, 7, and 12 on VEGF-A secretion in HT29 human colorectal cancer cells, induced by hypoxia or glucose deprivation.
Notes: In ELISA of VEGF-A secretion, HT29 cells were treated with compounds for 24 hours in normal medium at 20% O2 (normal), 1% O2 (hypoxia), or in glucose-free medium. Data are the mean ± SD of triplicate experiments. The differences between each control and the compound-treated samples were statistically significant (*P<0.05, **P<0.01).
Abbreviations: ELISA, enzyme-linked immunosorbent assay; GF, glucose-free; HIF, hypoxia-inducible factor; SD, standard deviation; VEGF, vascular endothelial growth factor.
Figure 6.
Antiangiogenic effects of phenformin (1) and compounds 2, 7, and 12, in CAM assay.
Notes: The CAMs of 4-day-old chick embryos were treated with compounds for 2 days. (A) Pictures of test compounds show avascular zone around the silicon ring where the test compounds were administered. Applied dose (μg/CAM) and antiangiogenesis ratio (%; mean ± SD) is shown below the pictures. (B) Antiangiogenesis ratios of the compounds, calculated from the following formula: Antiangiogenesis ratio (%) = (1 − [control point/drug point]) ×100. Eight to ten eggs were used in total for each condition.
Abbreviations: CAM, chick chorioallantoic membrane; SD, standard deviation.
Conclusion
We designed and synthesized 13 analogs on the basis of the arylethylbiguanide scaffold derived from phenformin (1), for SAR studies using cell-based luciferase reporter assays for HIF-1 and UPR activation. We also tested the compounds for selective cytotoxicity under glucose-deprived stress conditions using HT29 cells. A group that is monocationic under physiological conditions, such as biguanide or guanidine, was necessary for the intended biological activities. Guanidine analog 2 had activities comparable with those of phenformin. Diverse substitution on the phenyl group strongly influenced the activities, among which the o-methyl and o-chlorophenyl derivative compounds 7 and 12 showed the most potent inhibitory effects on HIF-1 and UPR activation, and excellent selective cytotoxicity under glucose deprivation. Whereas introduction of a polar or bulky group, such as a hydroxyl, methoxy, acetylaminoethyl, or t-butyl group, in the para position tended to weaken the activities and selective cytotoxicity. In further biological evaluations, compounds 7 and 12 suppressed HIF-1α protein expression induced by hypoxia, and GRP78 and GRP94 protein expression induced by glucose deprivation, at substantially lower concentrations than for phenformin (1) and compound 2. These results correlated well with the results of reporter assays for HIF-1 and UPR activation. Moreover, compounds 7 and 12 inhibited VEGF-A secretion induced by hypoxia and showed the remarkable antiangiogenesis activity in the CAM assay. Consequently, we succeeded in developing new biguanide analogs that suppressed adaptive responses induced through the HIF-1 and UPR pathways by the stresses of hypoxia and glucose deficiency. These compounds have substantial selective cytotoxicity under conditions of glucose starvation, and substantial antiangiogenic effects. We will further explore their in vivo antiangiogenic and antitumor effects. These structural development studies of biguanide derivatives could lead to a novel anticancer agent targeting TME.
Supplementary material
Materials and methods
Proton (1H) and carbon-13 (13C) nuclear magnetic resonance (NMR) spectra were recorded using a JEOL JNM-EX400, JNM-AL400, or JNM-ECA-500 spectrometer (JEOL Ltd, Tokyo, Japan) at 400 or 500 MHz (1H NMR) and 100 or 125 MHz (13C NMR) in deuterated chloroform (CDCl3) (Cambridge Isotope Laboratories, Tewksbury, MA, USA), methanol (CD3OD) (Wako Pure Chemical Industries, Ltd), and dimethyl sulfoxide DMSO-d6 (Cambridge Isotope Laboratories). Chemical shifts of 1H-NMR are referenced to tetramethylsilane (TMS). Chemical shifts of 13C-NMR were referenced to CDCl3 (77.0 ppm), CD3OD (49.0), and DMSO-d6 (39.7), unless otherwise specified. Electron impact (EI) mass spectra and fast atom bombardment (FAB) mass (m-nitrobenzyl alcohol was used as the matrix) spectra were measured on a JEOL JMS-SX102A mass spectrometer (JEOL Ltd). Direct analysis in real time (DART®) mass spectra were measured on a JEOL JMS-T100TD DART mass spectrometer (JEOL Ltd). Elementary analysis was performed on a Micro Corder JM10 (J-SCIENCE LAB Co, Ltd, Kyoto, Japan). Thin-layer chromatography was carried out on silica gel (Art 7749 Kieselgel 60 PF254, Merck KGaA, Darmstadt, Germany) with visualization of components by ultraviolet (UV) light (254 nm). Column chromatography was carried out on silica gel (AP-300S; Taiko-Shoji, Nagoya, Japan). Unless otherwise noted, all chemicals were obtained from commercial sources and used without further purification.
Syntheses of phenformin (1) and intermediate compounds
2-phenethylbiguanide hydrochloride (compound 1: phenformin)
Following the procedure described in the literature,1 phenethylamine (compound 15) (254.5 mg, 2.1 mmol) was added to a solution of dicyandiamide (176.6 mg, 2.1 mmol) in 3.7 mL of dry CH3CN, and TMSCl (228.1 mg, 2.3 mmol) was slowly added dropwise to the mixture. The mixture was stirred and irradiated with adjustable power in the range of 0–400 W, at 2.45 GHz, for 15 minutes at 150°C, using microwave reactor (Biotage® Initiator 2.0, Biotage AB, Uppsala, Sweden). After the mixture was cooled down to approximately 50°C, isopropyl alcohol (iPrOH) (0.49 mL, 6.3 mmol) was added slowly, and the mixture was further stirred and irradiated at 125°C for 1 minute. The precipitation of the biguanide hydrochloride salt was washed with CH3CN twice to afford compound 12 (307.3 mg, 73%). The analytical sample was obtained by recrystallization from iPrOH as a white powder. mp 175°C–177°C (lit 175°C–178°C); 1H NMR (400 MHz, DMSO-d6): δ=2.77 (t, J=7.0 Hz, 2H), 3.33 (q, J=7.0 Hz, 2H), 7.23–7.43 (m, 12H); FABMS: m/z calcd for [M-Cl]+: 206, found 206.
S-methylisothiourea hydroiodide (compound 27)
A solution of thiourea (compound 26) (5.0 g, 65.7 mmol) and MeI (4.74 mL, 72.3 mmol) in EtOH (10 mL) was refluxed for 2 hours. After this, the resulting mixture was cooled to 0°C, and then, Et2O was added to the mixture. The precipitate was filtered and washed with Et2O and dried to give compound 273 (13.3 g, 93%) as a pale brown solid. 1H NMR (400 MHz, DMSO-d6): δ=2.49 (s, 3H), 8.79 (s, 4H); 13C NMR (100 MHz, DMSO-d6): δ=13.4, 171.1.
N,N′-bis(tert-butoxycarbonyl)-S-methylisothiourea (compound 28)
To a solution of compound 27 (5.0 g, 22.9 mmol) in a mixture of H2O (50 mL) and 1,4-dioxane (50 mL) were added 1 M NaOH aqueous solution (23 mL, 23.0 mmol) and (Boc)2O (12.5 g, 57.4 mmol). The reaction mixture was vigorously stirred for 9 hours at room temperature. The precipitate was filtered off and washed with a small amount of H2O. The filtrate was concentrated under reduced pressure to approximately half the volume, and the solid was separated by filtration. The solid was combined and suspended in H2O (150 mL) at approximately 50°C and filtered. Then it was dried under reduced pressure at room temperature to give compound 283 (5.3 g, 79%) as a white powder. 1H NMR (400 MHz, CDCl3): δ=1.52 (s, 9H), 1.53 (s, 9H), 2.40 (s, 3H), 11.60 (s, 1H); EIMS: m/z calcd for [M]+: 290, found 290.
N,N′-Bis(tert-butoxycarbonyl)-N″-2-phenethylguanidine (compound 29)
To a solution of compound 28 (1.16 g, 4.0 mmol) in CH2Cl2 (8 mL) was added phenethylamine (compound 15) (969 mg, 8.0 mmol), and the reaction mixture was stirred at room temperature for 14 hours. Then the solvent was evaporated under reduced pressure, and the residue was dissolved in EtOAc (50 mL). The solution was washed with 10% citric acid aqueous solution (5×20 mL), saturated NaHCO3 aqueous solution (3×10 mL), and H2O (3×10 mL). The organic phase was dried over anhydrous MgSO4 and concentrated in vacuo to give compound 29 (1.25 g, 86%) as a white powder. The analytical sample was obtained by recrystallization from n-hexane and EtOAc as a colorless powder. mp 128°C–129°C; 1H NMR (400 MHz, CDCl3): δ=1.48 (s, 9H), 1.50 (s, 9H), 2.87 (t, J=7.2 Hz, 2H), 3.67 (q, J=7.2 Hz, 2H), 7.21–7.28 (m, 5H), 8.36 (s, 1H), 11.46 (s, 1H); 13C NMR (100 MHz, DMSO-d6): δ=28.0, 28.3, 35.3, 42.2, 79.2, 83.0, 126.5, 128.5, 128.8, 138.5, 153.2, 156.1, 163.6; DARTMS: m/z calcd for [M + H]+: 364, found 364. Anal Calcd for C19H29N3O4: C, 62.79; H, 8.04; N, 11.56. Found: C, 62.84; H, 8.10; N, 11.58.
2-phenethylguanidine hydrochloride (compound 2)
According to the procedure described in the literature,2 a solution of compound 29 (500 mg, 1.38 mmol) in 4 M HCl-1,4-dioxane (4 mL) was stirred at room temperature for 15 hours. The solvent was removed under reduced pressure. The residue was reevaporated from Et2O three times. After EtOAc was added, the precipitate was filtered and washed with EtOAc and dried to give compound 24 (271 mg, 99%). The analytical sample was obtained by recrystallization from EtOAc and EtOH as a colorless powder. mp 133°C–134°C (lit 135°C–138°C); 1H NMR (400 MHz, CD3OD): δ=2.88 (t, J=7.2 Hz, 2H), 3.46 (t, J=7.2 Hz, 2H), 7.20–7.36 (m, 5H); 13C NMR (100 MHz, CD3OD): δ=36.7, 44.5, 128.6, 130.5, 130.6, 140.1, 159.4. DARTMS: m/z calcd for [M-Cl]+:164, found 164.
1-(2-phenethyl)urea (compound 3)
According to the literature procedure,5 a mixture of ethyl carbamate (1.06 g, 11.9 mmol), Al2O3 (1.06 g, 10.4 mmol), and phenethylamine (compound 15) (2.88 g, 23.8 mmol) in toluene (7 mL) was refluxed for 48 hours. The reaction mixture was filtered on Celite® (Wako Pure Chemical Industries, Ltd) and evaporated in vacuo. The residue was purified by chromatography (MeOH/CHCl3 =1:40) to give compound 36 (603.3 mg, 31%). The analytical sample was obtained by recrystallization from H2O as a colorless powder. mp 110°C–111°C (lit 110°C–111°C); 1H NMR (400 MHz, CDCl3): δ=2.80 (t, J=6.8 Hz, 2H), 3.40 (q, J=6.8 Hz, 2H), 4.49 (s, 2H), 4.91 (s, 1H), 7.21–7.29 (m, 5H); 13C NMR (100 MHz, CDCl3): δ=36.2, 41.7, 126.4, 128.6, 128.8, 139.0, 158.9; EIMS: m/z calcd for [M+]: 164, found 164.
1-(2-phenethyl)thiourea (compound 4)
According to the literature procedure,7 a mixture of phenethylamine hydrochloride (compound 30) (2.0 g, 12.7 mmol) and ammonium isothiocyanate (1.01 g, 13.4 mmol) in bromobenzene (3.5 mL) was refluxed under a nitrogen atmosphere for 1.5 hours and then cooled to 0°C. The precipitate was washed with H2O, filtered, then washed with n-hexane and dried to give compound 48 (965.6 mg, 42%). The analytical sample was obtained by recrystallization from EtOH as a colorless powder. mp 136°C–137°C (lit 137°C). 1H NMR (500 MHz, DMSO-d6): δ=2.79 (br s, 2H), 3.57 (br s, 2H), 7.19–7.32 (m, 5H), 6.99, 7.56, 7.70 (br s, total 3H); 13C NMR (100 MHz, DMSO-d6): δ=34.9, 45.2, 126.0, 128.2, 128.7, 139.3, 183.2; EIMS: m/z calcd for [M]+: 180, found 180.
1,4-bis(2-tert-butoxycarbonylaminoethyl)benzene (compound 32)
According to the literature procedure,9 to a stirred solution of 1,4-phenylenediacetonitrile (compound 31) (4.69 g, 30 mmol) in dry methanol (200 mL) at 0°C, (Boc)2O (26.2 g, 120 mmol) and NiCl2 · 6H2O (713 mg, 10 mol%) were added. NaBH4 (15.9 g, 280 mmol) was then added in small portions over 2 hours. The resulting reaction mixture was allowed to warm to room temperature and stirred for 19 hours. Then diethylentriamine (6.5 mL, 60 mmol) was added, and the mixture was allowed to stir for another 30 minutes. After evaporation of solvent, the purple residue was dissolved in ethyl acetate and washed with a NaHCO3 saturated solution (2×150 mL) and brine (50 mL). The organic layer was dried over anhydrous MgSO4, filtered, and evaporated to give the crude product, which was purified by silica gel column chromatography (CHCl3/MeOH =10:1) to afford compound 32 (7.02 g, 64%). The analytical sample was obtained by recrystallization from CH2Cl2 and n-hexane as pale yellow needles. mp 154°C–155°C; 1H NMR (400 MHz, CDCl3): δ=1.44 (s, 18H), 2.77 (t, J=7.0 Hz, 4H), 3.36 (br, 4H), 4.55 (s, 2H), 7.13 (br, 4H); 13C NMR (125 MHz, CDCl3): δ=28.4, 35.8, 41.7, 79.2, 129.0, 137.0, 155.8; DARTMS: m/z calcd for [M + H]+: 365, found 365; Anal Calcd for C20H32N2O4: C, 65.91; H, 8.85; N, 7.69. Found: C, 65.67; H, 8.57; N, 7.95.
1,4-bis(2-aminoethyl)benzene dihydrochloride (compound 33)
A mixture of compound 32 (3.98 g, 10.9 mmol) and 5% HCl/MeOH (70 mL) was stirred for 13 hours. The solvent was removed in vacuo to give compound 3310 (2.61 g, quant) as a white solid. 1H NMR (400 MHz, CD3OD): δ=2.97 (t, J=7.7 Hz, 4H), 3.15 (t, J=7.7 Hz, 4H), 7.28 (br, 4H).
1-(2-tert-butoxycarbonylaminoethyl)-4-(2-aminoethyl)benzene (compound 34)
According to the procedure described in the literature,11 to the solution of compound 33 (1.0 g, 4.2 mmol) in MeOH (1.5 mL) at 0°C, 0.9 mL of 34% NaOH aqueous solution (5.9 mmol) was added carefully, then stirred for 1 hour at room temperature. The solution of (Boc)2O (1.29 g, 5.9 mmol) in MeOH (2 mL) was added at 0°C for 30 minutes, and the mixture was stirred for 66 hours at room temperature. The mixture was concentrated in vacuo, and 10% citric acid aqueous solution (5 mL) was added to the residue. Bis-Boc amine compound 32 was removed by extraction with diethyl ether (8×30 mL) (884.5 mg, 58% recovery). The aqueous layer was neutralized with NaOH (1 g) and extracted with CHCl3 (3×15 mL). The combined organic layer was washed with 10 mL of brine, dried over anhydrous MgSO4, and concentrated in vacuo to yield compound 3412 (383.8 mg, 34%) as a yellow oil. 1H NMR (400 MHz, CDCl3): δ=1.44 (s, 9H), 2.71–2.77 (m, 4H), 2.96 (t, J=6.8 Hz, 2H), 3.36 (br, 2H), 4.56 (s, 1H), 7.13 (br, 4H).
1-(2-acetylaminoethyl)-4-(2-tert-butoxycarbonylaminoethyl)benzene (compound 35)
According to the literature procedure,13 triethylamine (0.73 mL) was added to a stirred solution of compound 34 (383.8 mg, 1.45 mmol) and N,N-dimethyl-4-aminopyridine (DMAP) (18 mg, 0.15 mmol) in anhydrous CH2Cl2 (1.2 mL) at 0°C. Then the mixture was added dropwise to acetic anhydride (0.2 mL, 2.2 mmol) and stirred for 4 hours at room temperature. The mixture was washed with H2O (20 mL), saturated citric acid solution (20 mL), saturated NaHCO3 solution (2×20 mL), and brine (10 mL) and dried over anhydrous MgSO4. After filtration, the solvent was evaporated under reduced pressure to give the residue, which was purified by silica gel column chromatography (ethyl acetate/n-hexane =3:1) to afford compound 35 (268.3 mg, 60%) as a white solid. mp 117°C–118°C; 1H NMR (400 MHz, CDCl3): δ=1.44 (s, 9H), 1.95 (s, 3H), 2.79 (m, 4H), 3.36 (br, 2H), 3.50 (q, J=6.8 Hz, 2H), 4.55 (s, 1H), 5.47 (s, 1H), 7.14 (br, 4H); 13C NMR (125 MHz, CDCl3): δ=23.3, 28.4, 35.2, 35.8, 40.6, 41.8, 79.2, 128.9, 129.0, 136.9, 137.2, 155.8, 170.0; DARTMS: m/z calcd for [M + H]+: 307, found 307; Anal Calcd for C17H26N2O3: C, 66.64; H, 8.55; N, 9.14. Found: C, 66.45; H, 8.55; N, 9.03.
1-(2-acetylaminoethyl)-4-(2-aminoethyl)benzene (compound 22)
A solution of compound 35 (263.3 mg, 0.86 mmol) in 5% HCl/MeOH (2.5 mL) was stirred for 22 hours at room temperature. The solvent was removed in vacuo to give compound 2214 hydrochloride as a white solid; then it was dissolved in saturated NaHCO3 aqueous solution (5 mL) and extracted with CHCl3 (with 30 mL, 20 mL, and 20 mL). The extracts were washed with sat. brine (10 mL), dried over anhydrous MgSO4, and concentrated in vacuo to give compound 22 (165.9 mg, 94%) as a yellow oil; 1H NMR (500 MHz, CDCl3): δ=1.94 (s, 3H), 2.72 (t, J=7.0 Hz, 2H), 2.79 (t, J=7.0 Hz, 2H), 2.95 (t, J=7.0 Hz, 2H), 3.49 (q, J=7.0 Hz, 2H), 5.74 (s, 1H), 7.11–7.16 (m, 4H).
Synthesis of compounds 2–4 and 22.
Notes: Bolded numbers signify an individual compound. Reagent and conditions: (A) (a) MeI, EtOH, reflux; (b) (Boc)2O, H2O/1,4-dioxane, NaOH aq, rt; (c) phenethylamine (15), CH2Cl2, rt; (d) 4 M HCl-1,4-dioxane, rt; (B) (e) Al2O3, toluene, reflux; (C) (f) bromobenzene, reflux under N2; and (D) (g) 1) (Boc)2O, NiCl2 · 6H2O, NaBH4, dry MeOH, 0°C to rt; 2) diethylenetriamine, rt; (h) 5% HCl/MeOH, rt; (i) Boc2O, NaOH aq, MeOH, 0°C to rt; (j) Ac2O, NEt3, DMAP, dry CH2Cl2, 0°C to rt; (k) 1) 5% HCl/MeOH, rt; 2) sat. NaHCO3 aq.
Abbreviations: Boc, tert-butoxycarbonyl; aq, aqueous solution; rt, room temperature; sat., saturated.
References
- 1.Mayer S, Daigle DM, Brown ED, Khatri J, Organ MG. An expedient and facile one-step synthesis of a biguanide library by microwave irradiation coupled with simple product filtration. Inhibitors of dihydrofolate reductase. J Comb Chem. 2004;6(5):776–782. doi: 10.1021/cc049953+. [DOI] [PubMed] [Google Scholar]
- 2.Shapiro SL, Parrino VA, Freedman L. Hypoglycemic agents. III. N1-alkyl-and aralkylbiguanides. J Am Chem Soc. 1959;81(14):3728–3736. [Google Scholar]
- 3.Gers T, Kunce D, Markowski P, et al. Reagents for efficient conversion of amines to protected guanidines. Synthesis. 2004;(1):37–42. [Google Scholar]
- 4.Cragoe EJ, Jr, inventor, Merck and Co, Inc., assignee (3-Amino-2-pyrazinecarbonyl)guanidines. Apr 11, 1967. United States patent US3313813 A.
- 5.Vauthey I, Valot F, Gozzi C, Fache F, Lemaire M. An environmentally benign access to carbamates and ureas. Tetrahedron Lett. 2000;41(33):6347–6350. [Google Scholar]
- 6.Shapiro SL, Parrino VA, Freedman L. Hypoglycemic agents. I. Chemical properties of β-phenethylbiguanide. A new hypoglycemic agent. J Am Chem Soc. 1959;81(9):2220–2225. [Google Scholar]
- 7.Muccioli GG, Martin D, Scriba GK, et al. Substituted 5,5′-diphenyl-2-thioxoimidazolidin-4-one as CB1 cannabinoid receptor ligands: synthesis and pharmacological evaluation. J Med Chem. 2005;48(7):2509–2517. doi: 10.1021/jm049263k. [DOI] [PubMed] [Google Scholar]
- 8.von Braun J, Deutsch H. Syntheses in the aliphatic-aromatic series. VI. Preparation of aliphatic-aromatic mustard oils by the thiouram disulfide method. Ber Dtsch Chem Ges. 1912;45:2188–2198. [Google Scholar]
- 9.Butini S, Campiani G, Borriello M, et al. Exploiting protein fluctuations at the active-site gorge of human cholinesterases: further optimization of the design strategy to develop extremely potent inhibitors. J Med Chem. 2008;51(11):3154–3170. doi: 10.1021/jm701253t. [DOI] [PubMed] [Google Scholar]
- 10.Mercer SM, Robert T, Dixon DV, et al. Design, synthesis, and solution behaviour of small polyamines as switchable water additives. Green Chem. 2012;14(3):832–839. [Google Scholar]
- 11.Lee DW, Ha HJ, Lee WK. Selective mono-BOC protection of diamines. Synth Commun. 2007;37(5):737–742. [Google Scholar]
- 12.Callahan JF, Moore ML, Yim NCF, inventors, SmithKline Beckman Corp., assignee Aromatic basic-tailed vasopressin antagonists as drugs. Nov 25, 1986. United States patent US4624943 A.
- 13.Nadres ET, Daugulis O. Heterocycle synthesis via direct C-H/N-H coupling. J Am Chem Soc. 2012;134(1):7–10. doi: 10.1021/ja210959p. [DOI] [PMC free article] [PubMed] [Google Scholar]
- 14.Kato H, Sakaguchi O, Aoyama M, inventors, et al. Hokuriku Pharmaceutical Co, Ltd, assignee 1-(Substituted aryl)alkyl-1H-imidazopyridin-4-amines as interferon inducers. Sep 4, 1997. Japanese patent JP 11080156 A (CAS Registry Number: 763068-61-7)
Acknowledgments
This work was supported in part by the Japan Society for the Promotion of Science (Grant-in-Aid for Scientific Research [B], number 24390029, to HN) and a Research Grant for Clinical Study Promotion (2013) from Gifu University. We thank Ms Emi Inaba, Ms Masako Hayashi, and Ms Miharu Hotta for their technical assistance.
Footnotes
Disclosure
The authors report no conflicts of interest in this work.
References
- 1.Philip B, Ito K, Moreno-Sánchez R, Ralph SJ. HIF expression and the role of hypoxic microenvironments within primary tumours as protective sites driving cancer stem cell renewal and metastatic progression. Carcinogenesis. 2013;34(8):1699–1707. doi: 10.1093/carcin/bgt209. [DOI] [PubMed] [Google Scholar]
- 2.Borovski T, De Sousa E, Melo F, Vermeulen L, Medema JP. Cancer stem cell niche: the place to be. Cancer Res. 2011;71(3):634–639. doi: 10.1158/0008-5472.CAN-10-3220. [DOI] [PubMed] [Google Scholar]
- 3.Fang H, Declerck YA. Targeting the tumor microenvironment: from understanding pathways to effective clinical trials. Cancer Res. 2013;73(16):4965–4977. doi: 10.1158/0008-5472.CAN-13-0661. [DOI] [PMC free article] [PubMed] [Google Scholar]
- 4.Nagasawa H. Pathophysiological response to hypoxia – from the molecular mechanisms of malady to drug discovery: drug discovery for targeting the tumor microenvironment. J Pharmacol Sci. 2011;115(4):446–452. doi: 10.1254/jphs.10r25fm. [DOI] [PubMed] [Google Scholar]
- 5.Semenza GL. HIF-1 inhibitors for cancer therapy: from gene expression to drug discovery. Curr Pharm Des. 2009;15(33):3839–3843. doi: 10.2174/138161209789649402. [DOI] [PubMed] [Google Scholar]
- 6.Hattori H, Okuda K, Murase T, et al. Isolation, identification, and biological evaluation of HIF-1-modulating compounds from Brazilian green propolis. Bioorg Med Chem. 2011;19(18):5392–5401. doi: 10.1016/j.bmc.2011.07.060. [DOI] [PubMed] [Google Scholar]
- 7.Semenza GL. Hypoxia-inducible factors in physiology and medicine. Cell. 2012;148(3):399–408. doi: 10.1016/j.cell.2012.01.021. [DOI] [PMC free article] [PubMed] [Google Scholar]
- 8.Semenza GL. HIF-1: upstream and downstream of cancer metabolism. Curr Opin Genet Dev. 2010;20(1):51–56. doi: 10.1016/j.gde.2009.10.009. [DOI] [PMC free article] [PubMed] [Google Scholar]
- 9.Kaufman RJ, Scheuner D, Schröder M, et al. The unfolded protein response in nutrient sensing and differentiation. Nat Rev Mol Cell Biol. 2002;3(6):411–421. doi: 10.1038/nrm829. [DOI] [PubMed] [Google Scholar]
- 10.Wouters BG, Koritzinsky M. Hypoxia signalling through mTOR and the unfolded protein response in cancer. Nat Rev Cancer. 2008;8(11):851–864. doi: 10.1038/nrc2501. [DOI] [PubMed] [Google Scholar]
- 11.Suh DH, Kim MK, Kim HS, Chung HH, Song YS. Unfolded protein response to autophagy as a promising druggable target for anticancer therapy. Ann N Y Acad Sci. 2012;1271:20–32. doi: 10.1111/j.1749-6632.2012.06739.x. [DOI] [PMC free article] [PubMed] [Google Scholar]
- 12.Feldman DE, Chauhan V, Koong AC. The unfolded protein response: a novel component of the hypoxic stress response in tumors. Mol Cancer Res. 2005;3(11):597–605. doi: 10.1158/1541-7786.MCR-05-0221. [DOI] [PubMed] [Google Scholar]
- 13.Ueda JY, Athikomkulchai S, Miyatake R, Saiki I, Esumi H, Awale S. (+)-Grandifloracin, an antiausterity agent, induces autophagic PANC-1 pancreatic cancer cell death. Drug Des Devel Ther. 2014;8:39–47. doi: 10.2147/DDDT.S52168. [DOI] [PMC free article] [PubMed] [Google Scholar]
- 14.Awale S, Lu J, Kalauni SK, et al. Identification of arctigenin as an antitumor agent having the ability to eliminate the tolerance of cancer cells to nutrient starvation. Cancer Res. 2006;66(3):1751–1757. doi: 10.1158/0008-5472.CAN-05-3143. [DOI] [PubMed] [Google Scholar]
- 15.Saito S, Furuno A, Sakurai J, et al. Chemical genomics identifies the unfolded protein response as a target for selective cancer cell killing during glucose deprivation. Cancer Res. 2009;69(10):4225–4234. doi: 10.1158/0008-5472.CAN-08-2689. [DOI] [PubMed] [Google Scholar]
- 16.Kourelis TV, Siegel RD. Metformin and cancer: new applications for an old drug. Med Oncol. 2012;29(2):1314–1327. doi: 10.1007/s12032-011-9846-7. [DOI] [PubMed] [Google Scholar]
- 17.Luo Z, Zang M, Guo W. AMPK as a metabolic tumor suppressor: control of metabolism and cell growth. Future Oncol. 2010;6(3):457–470. doi: 10.2217/fon.09.174. [DOI] [PMC free article] [PubMed] [Google Scholar]
- 18.Matsuo J, Tsukumo Y, Saito S, et al. Hyperactivation of 4E-binding protein 1 as a mediator of biguanide-induced cytotoxicity during glucose deprivation. Mol Cancer Ther. 2012;11(5):1082–1091. doi: 10.1158/1535-7163.MCT-11-0871. [DOI] [PubMed] [Google Scholar]
- 19.Mayer S, Daigle DM, Brown ED, Khatri J, Organ MG. An expedient and facile one-step synthesis of a biguanide library by microwave irradiation coupled with simple product filtration. Inhibitors of dihydrofolate reductase. J Comb Chem. 2004;6(5):776–782. doi: 10.1021/cc049953+. [DOI] [PubMed] [Google Scholar]
- 20.Wick AN, Murphy PJ, inventors, San Diego State College Foundation, assignee N1-[2-(p-Hydroxyphenyl)ethyl]biguanide. Jul 15, 1969. United States patent US3456059 A.
- 21.Alkalay D, Volk J, Bartlett MF. Conversion of biguanides into substituted s-triazines assayable by GC or mass fragmentography. J Pharm Sci. 1976;65(4):525–529. doi: 10.1002/jps.2600650412. [DOI] [PubMed] [Google Scholar]
- 22.Shapiro SL, Parrino VA, Freedman L. Hypoglycemic agents. III.1–3 N1-alkyl- and aralkylbiguanides. J Am Chem Soc. 1959;81(14):3728–3736. [Google Scholar]
- 23.Park HR, Tomida A, Sato S, et al. Effect on tumor cells of blocking survival response to glucose deprivation. J Natl Cancer Inst. 2004;96(17):1300–1310. doi: 10.1093/jnci/djh243. [DOI] [PubMed] [Google Scholar]
- 24.Kasai S, Nagasawa H, Shimamura M, Uto Y, Hori H. Design and synthesis of antiangiogenic/heparin-binding arginine dendrimer mimicking the surface of endostatin. Bioorg Med Chem Lett. 2002;12(6):951–954. doi: 10.1016/s0960-894x(02)00066-5. [DOI] [PubMed] [Google Scholar]
- 25.Semenza GL, Jiang BH, Leung SW, et al. Hypoxia response elements in the aldolase A, enolase 1, and lactate dehydrogenase A gene promoters contain essential binding sites for hypoxia-inducible factor 1. J Biol Chem. 1996;271(51):32529–32537. doi: 10.1074/jbc.271.51.32529. [DOI] [PubMed] [Google Scholar]
- 26.Viollet B, Guigas B, Sanz Garcia N, Leclerc J, Foretz M, Andreelli F. Cellular and molecular mechanisms of metformin: an overview. Clin Sci (Lond) 2012;122(6):253–270. doi: 10.1042/CS20110386. [DOI] [PMC free article] [PubMed] [Google Scholar]
- 27.Sogame Y, Kitamura A, Yabuki M, Komuro S. A comparison of uptake of metformin and phenformin mediated by hOCT1 in human hepatocytes. Biopharm Drug Dispos. 2009;30(8):476–484. doi: 10.1002/bdd.684. [DOI] [PubMed] [Google Scholar]
- 28.Segal ED, Yasmeen A, Beauchamp MC, Rosenblatt J, Pollak M, Gotlieb WH. Relevance of the OCT1 transporter to the antineoplastic effect of biguanides. Biochem Biophys Res Commun. 2011;414(4):694–699. doi: 10.1016/j.bbrc.2011.09.134. [DOI] [PubMed] [Google Scholar]
- 29.Yuan P, Ito K, Perez-Lorenzo R, et al. Phenformin enhances the therapeutic benefit of BRAF(V600E) inhibition in melanoma. Proc Natl Acad Sci U S A. 2013;110(45):18226–18231. doi: 10.1073/pnas.1317577110. [DOI] [PMC free article] [PubMed] [Google Scholar]
- 30.Shitara Y, Nakamichi N, Norioka M, Shima H, Kato Y, Horie T. Role of organic cation/carnitine transporter 1 in uptake of phenformin and inhibitory effect on complex I respiration in mitochondria. Toxicol Sci. 2013;132(1):32–42. doi: 10.1093/toxsci/kfs330. [DOI] [PubMed] [Google Scholar]
- 31.Charton M. Steric effects. I. Esterification and acid-catalyzed hydrolysis of esters. J Am Chem Soc. 1975;97(6):1552–1556. [Google Scholar]
- 32.Soraya H, Esfahanian N, Shakiba Y, et al. Anti-angiogenic Effects of Metformin, an AMPK Activator, on Human Umbilical Vein Endothelial Cells and on Granulation Tissue in Rat. Iran J Basic Med Sci. 2012;15(6):1202–1209. [PMC free article] [PubMed] [Google Scholar]
Associated Data
This section collects any data citations, data availability statements, or supplementary materials included in this article.
Supplementary Materials
Synthesis of compounds 2–4 and 22.
Notes: Bolded numbers signify an individual compound. Reagent and conditions: (A) (a) MeI, EtOH, reflux; (b) (Boc)2O, H2O/1,4-dioxane, NaOH aq, rt; (c) phenethylamine (15), CH2Cl2, rt; (d) 4 M HCl-1,4-dioxane, rt; (B) (e) Al2O3, toluene, reflux; (C) (f) bromobenzene, reflux under N2; and (D) (g) 1) (Boc)2O, NiCl2 · 6H2O, NaBH4, dry MeOH, 0°C to rt; 2) diethylenetriamine, rt; (h) 5% HCl/MeOH, rt; (i) Boc2O, NaOH aq, MeOH, 0°C to rt; (j) Ac2O, NEt3, DMAP, dry CH2Cl2, 0°C to rt; (k) 1) 5% HCl/MeOH, rt; 2) sat. NaHCO3 aq.
Abbreviations: Boc, tert-butoxycarbonyl; aq, aqueous solution; rt, room temperature; sat., saturated.


