Abstract
Excitotoxicity describes a pathogenic process whereby death of neurons releases large amounts of the excitatory neurotransmitter glutamate, which then proceeds to activate a set of glutamatergic receptors on neighboring neurons (glutamate, N-methyl-D-aspartate (NMDA), and kainate), opening ion channels leading to an influx of calcium ions producing mitochondrial dysfunction and cell death. Excitotoxicity contributes to brain damage after stroke, traumatic brain injury, and neurodegenerative diseases, and is also involved in spinal cord injury. We tested whether low level laser (light) therapy (LLLT) at 810-nm could protect primary murine cultured cortical neurons against excitotoxicity in vitro produced by addition of glutamate, NMDA or kainate. Although the prevention of cell death was modest but significant, LLLT (3 J/cm2 delivered at 25 mW/cm2 over 2 min) gave highly significant benefits in increasing ATP, raising mitochondrial membrane potential, reducing intracellular calcium concentrations, reducing oxidative stress and reducing nitric oxide. The action of LLLT in abrogating excitotoxicity may play a role in explaining its beneficial effects in diverse central nervous system pathologies.
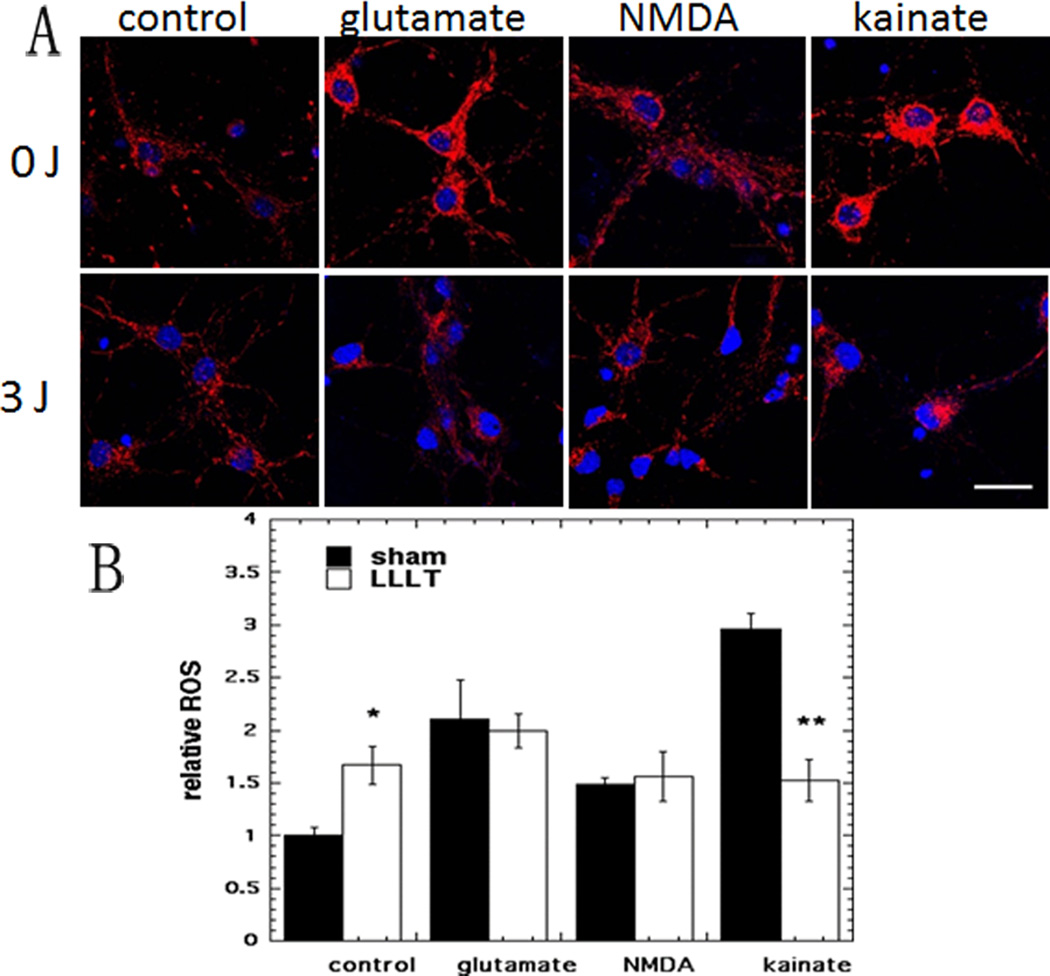
((Figure: 5a)) Effect of 810-nm laser on intracellular reactive oxygen species (ROS) in cortical neurons with excitotoxicity
Keywords: low-level laser therapy, cultured cortical neurons, excitotoxicity, reactive oxygen species, mitochondrial membrane potential glutamate, NMDA, kainic acid
1. INTRODUCTION
Excitotoxicity is a pathological process by which neurons are damaged and killed by the excessive stimulation of receptors for the excitatory amino acid neurotransmitter glutamate (Glu) in the central nervous system (CNS). Excitotoxicity may be involved in CNS pathologies such as stroke, traumatic brain injury and spinal cord injury, and is also implicated in neurodegenerative diseases such as multiple sclerosis, Alzheimer's disease, amyotrophic lateral sclerosis (ALS), Parkinson's disease, and Huntington's disease.
Low level light (laser) therapy (LLLT) consists of non-thermal red and/or near infrared light (600–1000 nm) delivered from a laser or from a non-coherent light source, shown to have beneficial effects on a wide range of diseases. A growing number of reports have shown a positive outcome for LLLT in diseases and injuries related to the nervous system (both peripheral and central). The exact cellular and molecular mechanisms of LLLT are still under investigation. The most acceptable hypothesis at the cellular level is based on the absorption of red and/or NIR light by cytochrome c oxidase of the cellular respiratory chain localized in mitochondria [1]. The light may either be monochromatic from a laser or broad band from a LED or even a filtered lamp. LLLT promoted axonal growth and nerve regeneration in both rat spinal cord [2, 3] and peripheral nerve injuries [4]. The efficacy of LLLT in the nervous system has been further demonstrated in animal studies showing improved neurological and functional outcome post-stroke [5–7] and post-traumatic brain injury (TBI) [8–13]. LLLT also enhanced emotional response and memory function of middle aged CD-1 mice [14]. Recently, promising results of human studies have been shown in patients with long-term peripheral nerve injury and ischemic stroke [15, 16]. Although the exact mechanisms are yet to be fully understood, LLLT has been used to help tissue repair and wound healing in animal models [17] and rescue neurons from neurotoxic injuries [18–20]. It has been reported that visible light can change the redox state of the cell by producing ROS or by increasing the cellular reduction capability [21].
Previous studies from our laboratory have shown that LLLT (810 nm) increased cellular ATP synthesis, raised mitochondrial membrane potential (MMP) and raised intracellular calcium levels, with a biphasic pattern in murine primary cultured cortical neurons [22]. ROS production and NO release had two peaks, one at low fluence and another at high fluence. We also studied [23] the effect of LLLT (810 nm) on murine primary cultured cortical neurons that had been subjected to oxidative stress-induced by three different agents (hydrogen peroxide, cobalt chloride and rotenone). MMP was raised by LLLT in both stressed and control cells, while ROS was reduced in stressed cells but raised in control cells. In the present work, we report that LLLT protects primary cortical neurons from excitotoxicity caused by three different excitotoxins.
2. Materials and Methods
2.1. Materials
Hank's balanced salt solution (CMF-HBSS), HEPES buffer, Glutamax, Neurobasal media, B27 supplement and PrestoBlue® Cell Viability Reagent were purchased from Life Technologies Invitrogen (Grand Island, NY), while CellRoxTM deep red, tetramethylrhodamine methyl ester (TMRM), 4-amino-5-methylamino-2’,7’-difluorofluorescein (DAF-FM) nitric oxide indicator, Fluo-4 AM calcium indicator, Hoechst 33342 were obtained from Molecular Probes Invitrogen (Eugene, OR). 2.5% trypsin/EDTA, penicillin/streptomycin, Type IV deoxyribonuclease I (DNAse I), poly-D-lysine (MW 150,000–300,000), Krebs-Ringer solution, dimethyl sulfoxide (DMSO), N-Methyl-D-aspartic acid (NMDA), glutamic acid, and kainic acid (KA) were purchased from Sigma, (St. Louis, MO). Glass-bottom petri dishes were purchased from In Vitro Scientific (Sunnyvale, CA).
2.2. Primary Mouse Cortical Neuron isolation from mice
All animal procedures were approved by the Subcommittee on Research Animal Care of the Massachusetts General Hospital (IACUC) and met the guidelines of the National Institutes of Health. Timed pregnant CD1 mice (age 8–10 weeks) were purchased from Charles River Pregnant and sacrificed at 16 days post-conception. The cortical lobes of 10 embryonic brains were separated from sub-cortical structures in calcium-magnesium-free, Hank's balanced salt solution containing 20 mM HEPES buffer (CMF-Hepes-HBSS). After removal of the meninges, brain tissue was placed into CMF-Hepes-HBSS, triturated briefly with pipetting, and incubated at 37°C for 30 min with 2.5% trypsin and 50 µg/ml DNAse I. Cells were then further dissociated mechanically and centrifuged at 1000 rpm, at 4°C for 5 min. The pellet was resuspended in Neurobasal Media (NBM) supplemented with 2 mM Glutamax, 100 units/ml of penicillin, 100 mg/ml of streptomycin, and B27 supplement. Neurons were plated at a density of approximately 600 cells/cm2 on poly-D-lysine coated cell culture plastic plates or glass-bottom petri dishes. The plating and maintenance media consisted of Neurobasal plus B27 supplement (NB27). Cultures were then placed in a humidified atmosphere of 95% air, 5% CO2 at 37°C. This media formulation inhibited the outgrowth of glia resulting in a neuronal population that is >95% pure. Half of the culture medium was changed at division 4 and then every 3 days. Experiments were performed on culture days 14 to 16. Before treatment, neurons were washed with and kept in HEPES-buffered Krebs-Ringer solution (Hepes-KB solution), containing 125 mM NaCl, 4.8 mM KCl, 1.2 mM MgSO4, 1.3 mM CaCl2, 1.2 mM KH2PO4, 10 mM Glucose, 20 mM HEPES, pH 7.40. All the experiments were carried out at 37°C.
2.3 Excitotoxicity
We used three different excitotoxins: glutamate at 30 µM, NMDA at 100 µM and kainite at 50µM. These concentrations were chosen in pilot experiments to produce about 50% cytotoxicity in neurons measured 24 hours after a 1 hour incubation followed by a wash.
2.4 Laser irradiation protocol
The experiments were conducted with a diode laser (Photothera Inc., Carlsbad, CA), which emits continuous wave (CW) 810-nm wavelength near infrared radiation. The cells were irradiated with a power density of 25 mW/cm2 for 2 mins to achieve total energy densities of 3 J/cm2. The spot size was 5 cm in diameter. When 96-well plates were illuminated the laser spot equally covered 9 wells.
2.5 Experimental groups
Laser treatments (CW 810 nm; 3 J/cm2 at 25 mW/cm2) were given for 2 mins commencing immediately after excitotoxicity was added. Sham laser exposure consisted of neurons being taken out of the incubator and set in the dark for 2 mins immediately after excitotoxicity was added. Neurons were divided into 7 experimental groups: 1) Sham control: normal neurons with sham laser exposure; 2) Exposure to 30µM glutamate with 10µM glycine for 1 h followed by a wash with 2 mins sham exposure; 3) 30µM glutamate with 10µM glycine exposure for 1 h followed by a wash, with 2 min LLLT; 4) exposure to 100 µM NMDA with 10µM glycine for 1 h followed by wash with 2 mins sham exposure; 5) NMDA 100 µM with 10µM glycine exposure for 1 h followed by a wash with 2 mins LLLT; 6) exposure to KA (50µM) for 1 h, followed by wash with 2 mins sham exposure; 7) KA exposure (50µM) for 1 h followed by a wash with 2 mins LLLT.
2.6 Cell viability assay
Cells were seeded in 96-well plates, and after treatment with excitotoxins with or without laser, cell viability was assayed after 24 h in culture. 10 µl Prestoblue solution was added into each well and the plate incubated at 37 °C for 2 h, then the fluorescence from the wells was measured at excitation 560 nm, emission 590 nm on a 96-well plate reader (Molecular Devices SpectraMax M5) following manufacturer’s instructions. Three independent experiments were carried out.
2.7 ATP generation assay
ATP determination with CellTiter-Glo Luminescent Cell Viability Assay (Promega, Madison, WI) was used to measure the effects of 810-nm laser light on the primary cortical neurons immediately after the final wash (30 mins after excitotoxicity was added). This assay generates a “glow-type” luminescent signal produced by a luciferase reaction with cellular ATP. The Cell Titer-Glo reagent was added in an amount equal to the volume of media in the well and resulted in cell lysis followed by a sustained luminescent reaction that was measured using a reporter luminometer (Turner Biosystems, Sunnyvale, CA). Amounts of ATP present in the primary cortical neurons were quantified in relative luminescent units (RLUs) by the protein (measured by BCA kit, Promega, Madison, WI) in each well. The results are expressed as mean standard error of the mean (SEM) of 25 wells for control or laser-treated tissue culture wells. Wells on the same plate were control or laser treated.
2.8 Evaluation of cellular ROS production
Cytoplasmic ROS was measured using CellROX™ Deep Red, a stable fluorescent indicator of cytoplasmic ROS. 30 mins after addition of excitoxins, the neurons were incubated with 5 µM of CellROX™ Deep Red in Hepes-KB solution for another 30 mins, 5 µg/ml of Hoechst-33342 (Sigma) was then added as a nuclei stain. Cells were washed twice and kept in Hepes Krebs-Ringer’s buffer. The fluorescence was imaged with a confocal microscope (Olympus America Inc, Center Valley, PA) using ex/em 635 nm/660 nm for CellROX™ Deep Red.
2.9 Mitochondrial membrane potential determination
Mitochondrial membrane potential was monitored with tetramethylrhodamine methyl ester (TMRM) at a loading concentration of 25 nM, 30 mins after addition of excitotoxins. After washing with Hepes-KB solution twice, fluorescence was monitored in the presence of TMRM by excitation at 559 nm with emission at 610 nm by confocal microscopy.
2.10 Intracellular calcium measurement
Changes of intracellular free calcium levels were monitored using the Ca-indicator dye Fluo-4 AM. Untreated neuronal cultures on coverslips were loaded with 5 µM Fluo-4 AM and 0.1% pluronic F-127 in Tyrots Media in the dark for 1h in 5% CO2 at 37°C, and were then washed three times with PBS. Excitotoxins and or laser were applied to Fluo-4 pretreated cultures and confocal images of cellular Fluo-4 AM fluorescence (λex = 488 nm and λem = 520 nm) collected after the final wash (30mins after excitotoxicity). Imaging conditions such as gain levels, confocal aperture size, and laser power were held constant.
2.11 Nitric oxide assay
Intracellular NO levels were monitored by using nitric oxide indictor DAF-FM (4,5-diaminofluorescein diacetate) as described previously [22]. After the addition of excitotoxins for 30mins, neurons were incubated in fresh culture medium with DAF-FM at a final concentration of 5 µM, for another 30mins at 37 °C. Fluorescence was monitored using confocal microscopy.
2.12 Quantitative confocal microscopy
Images were collected on an inverted confocal microscope (Olympus FV1000, Olympus, Japan) with a Zeiss C-Apochromat 63×/NA 1.2 water-immersion objective (Carl Zeiss Inc., Jena, Germany). Images were collected using the Olympus Fluoview software with 800×800 pixels with the slow scan speed. Fluorescence quantification was carried out on fields selected at random throughout the dish and focused using phase-contrast optics before viewing the fluorescence. Digital images were recorded and the quantification of fluorescence intensity was performed using Image-Pro Plus 6.0 software (Media Cybernetics). Total fluorescence per field was obtained by summing the pixel intensity over the whole field after subtracting an integer corresponding to a background value obtained from a field that did not contain any cells. Background fluorescence values including auto fluorescence and nonspecific fluorescence were obtained by imaging fields of cells under the same illumination and exposure conditions. The fluorescence intensity was calculated by dividing the total integrated optical density by the total number of cells in each field and expressed as relative fluorescence intensity [24].
2.13 Statistical analysis
All fluorescence readings were normalized to total protein (measured by BCA, Pierce Biotechnology Inc.). All assays were performed in triplicate with n=6 for each sample. Excel software was used to perform one way ANOVA with Tukey’s post-hoc test to evaluate the statistical significance of experimental results (p < 0.05).
3 Results
3.1 Effect of 810 nm LLLT on cell viability after excitotoxicity
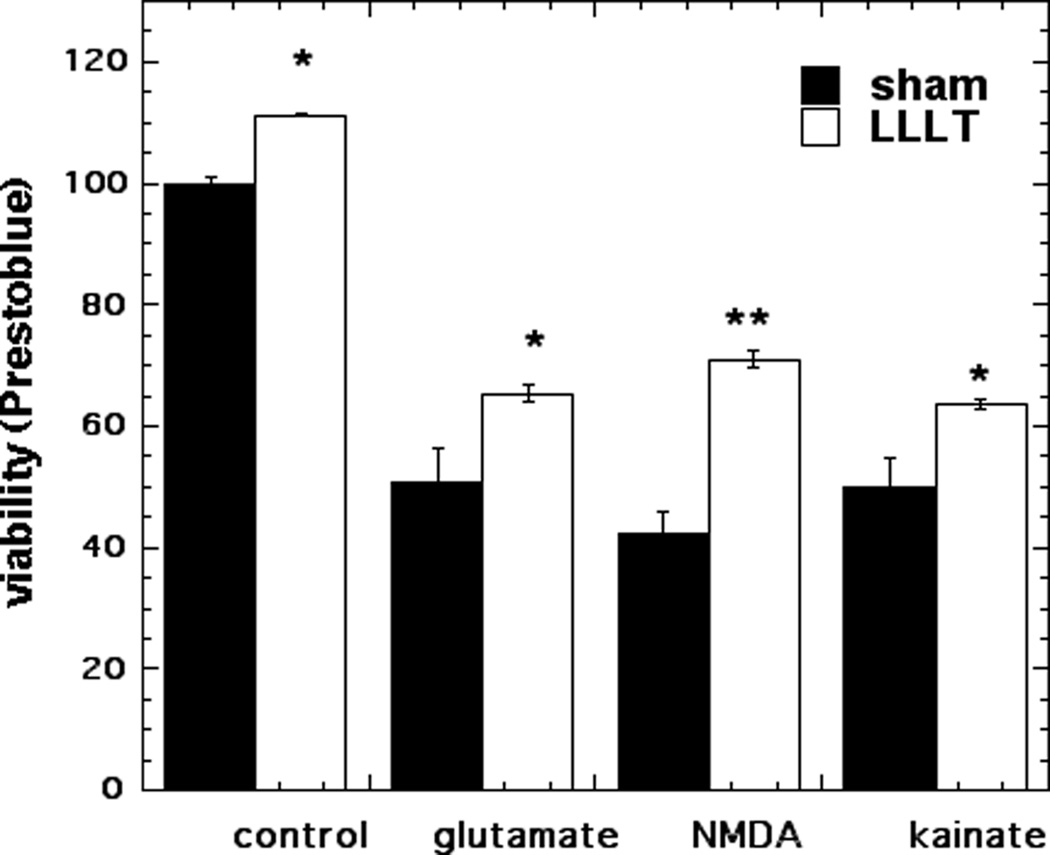
Cell viability assays were performed to determine reduction of viability in the cortical neurons caused by 1 h exposure to either 30µM glutamate, 100 µM NMDA or 50 µM KA followed by 24 h incubation and to investigate the effect of 810 nm LLLT on cell viability. Glutamate led to survival of 51%, NMDA led to survival of 42%, and kainate treatment produced survival of 50% (p < 0.001). LLLT treatment produced a modest but significant increase in survival: to 65% for glutamate (p < 0.05), to 71% for NMDA (p < 0.01) and to 64% for kainate (Fig 1).
Figure 1. Effect of 810-nm laser on MTT cell viability in cortical neurons with excitotoxicity.
Neurons were treated with excitotoxins for 1 hour with and without 3 J/cm2 810 nm laser in first 3 min. Points are means of 6 wells per group, error bars are SEM and *p < 0.05; ** = p<0.01 vs sham (dark).
3.2 Effect of 810 nm laser on ATP
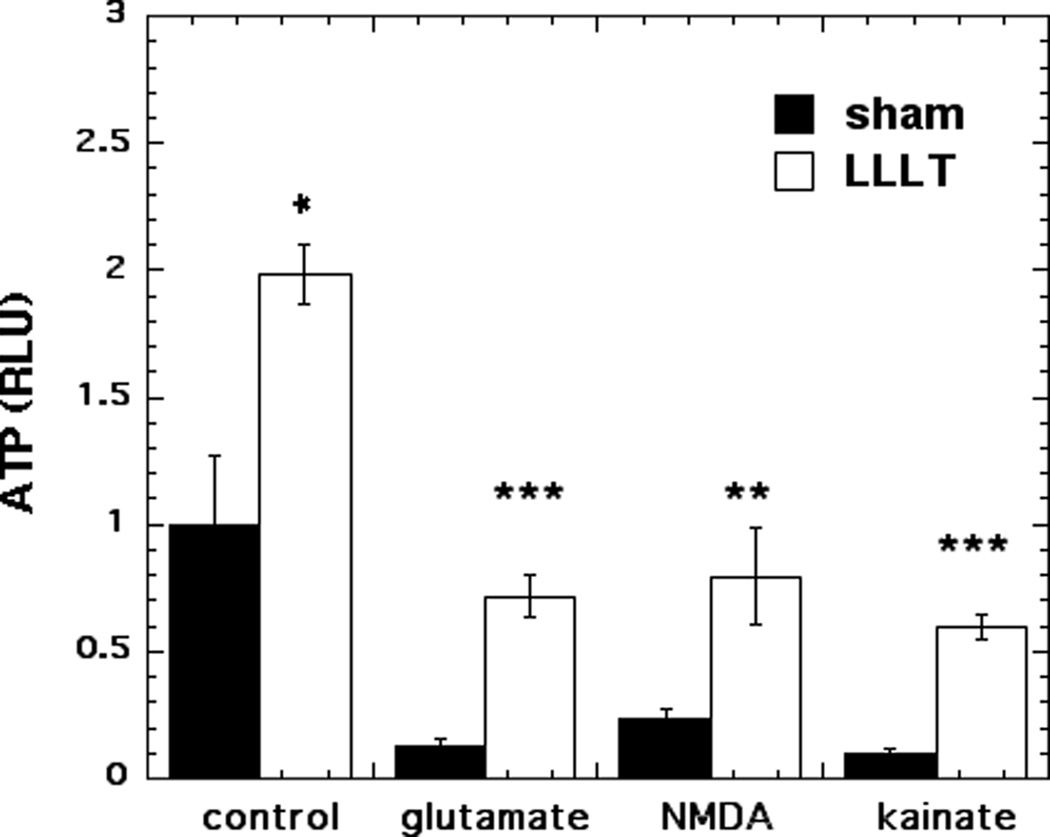
Figure 2 shows the ATP content per mg cell protein in the mouse cortical neurons. ATP content was found to significantly increase (98% more, p < 0.05) when control neurons were treated with 810-nm light. All three excitotoxins significantly reduced the ATP content of the neurons to between 10–23% of the control value (p < 0.001). LLLT increased the ATP content of glutamate-treated neurons from 13% to 73% of dark control value (p < 0.001). LLLT increased the ATP content of NMDA-treated neurons from 23% to 80% of dark control value (p < 0.01). LLLT increased the ATP content of kainate-treated neurons from 10% to 60% of dark control value (p < 0.001). In all three examples of excitotoxicity the ATP content was at least tripled by LLLT.
Figure 2. Effect of 810-nm laser on ATP generation in cortical neurons with excitotoxicity.
Quantification by luminescence plate reader of the relative light unit values per mg cell protein using Cell Titer Glo ATP assay in cortical neurons as control and with 3 excitotoxins, with and without LLLT (3 J/cm2 810 nm laser). Points are means from nine wells. Error bars are SEM. * = p <0.05; ** = p<0.01; *** = p<0.001 vs sham (dark).
3.3 Effect of 810 nm laser on intracellular calcium
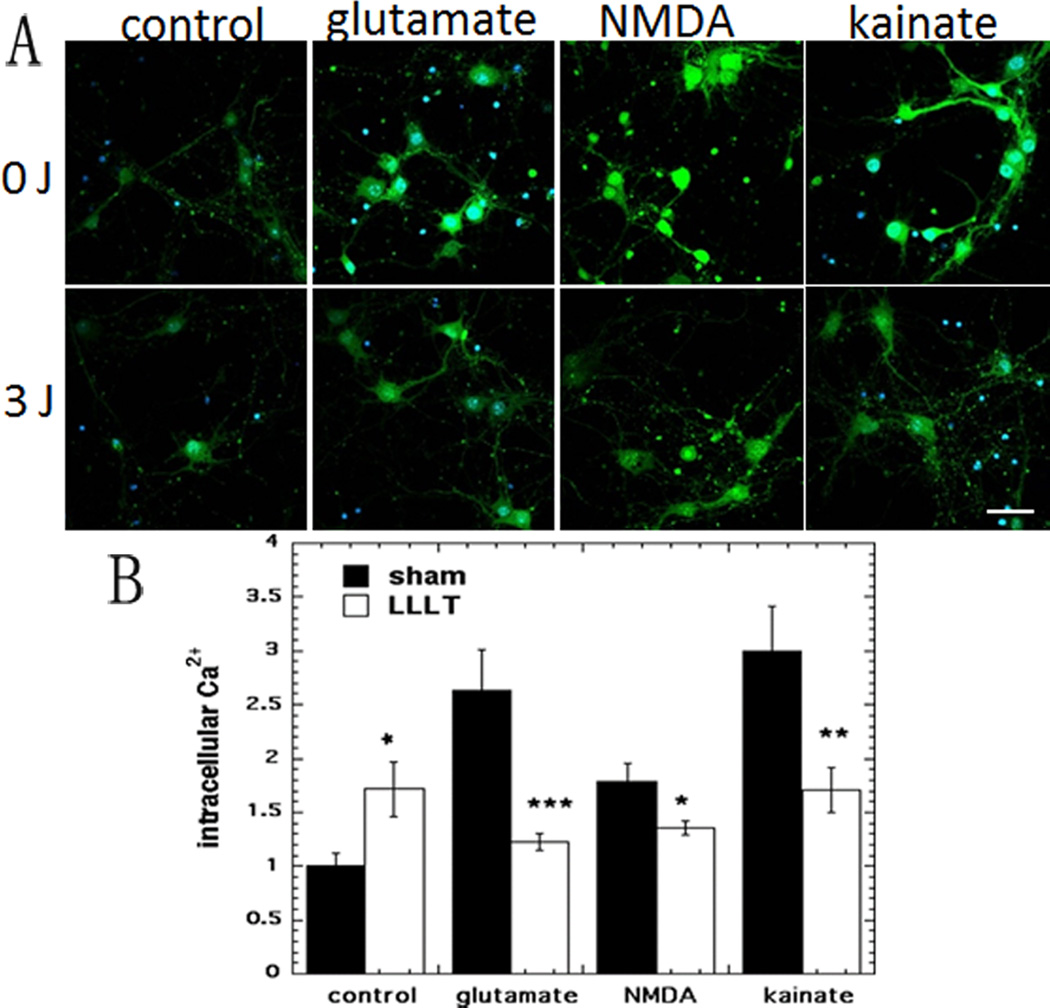
Representative confocal microscope images are shown in Fig 3A and the quantification of the fluorescence measurements is shown in Fig 3B. In agreement with our previously published data [22] a 71% rise in intracellular Ca2+ was seen after LLLT treatment of control neurons. All three excitotoxins significantly increased the intracellular Ca2+ content of the neurons by between 80–200% of the dark control value (p < 0.001). LLLT reduced the Ca2+ content of glutamate-treated neurons by more than 50% (p < 0.001). LLLT produced a smaller decrease in the Ca2+ content of NMDA-treated neurons of 25% (p < 0.01). The decrease in Ca2+ content in the kainate-treated neurons produced by LLLT was almost as large (43%, p < 0.01) as that found with glutamate.
Figure 3. Effect of 810-nm laser on intracellular calcium release in cortical neurons with excitotoxicity.
(A) Fluo-4 AM (green) fluorescence for calcium and Hoechst (blue) fluorescence for nuclei in cortical neurons as control and with 3 excitotoxins, with and without LLLT (3 J/cm2 810 nm laser). Scale bar = 20 µm. (B) Quantification by Image J of mean fluorescence values. N= 6 fields per group. Error bars are SEM and * = p <0.05; ** = p<0.01; *** = p<0.001 vs sham (dark).
3.4 Effect of 810 nm laser on mitochondrial membrane potential (MMP)
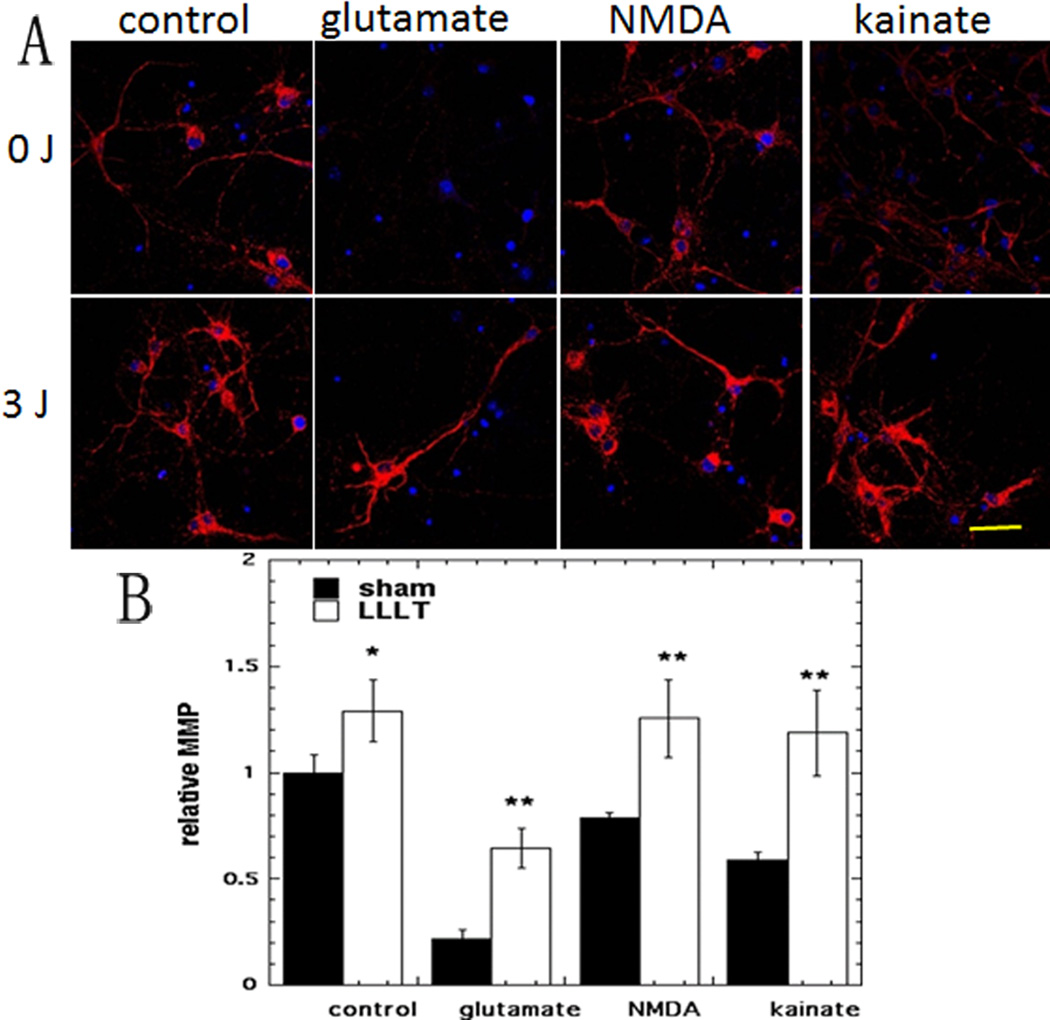
Representative images are shown in Fig 4A and the quantification of the fluorescence measurements is shown in Fig 4B. Again in agreement with the results from a previous study [22] we found a 29% rise in MMP (p < 0.05) when laser was delivered to control neurons without excitotoxicity. The three excitotoxins all produced drops in MMP ranging from 21% to 78% of control values. MMP in glutamate treated neurons was sharply increased by 200% (p<0.01) after LLLT. The MMP in NMDA treated neurons was increased by 60 % (p < 0.01) and MMP in kainate treated neurons was doubled by LLLT (p < 0.01).
Figure 4. Effect of 810-nm laser on mitochondrial membrane potential (MMP) in cortical neurons with excitotoxicity.
(A) TMRM (red) fluorescence for MMP and Hoechst (blue) fluorescence for nuclei in cortical neurons as control and with 3 excitotoxins, with and without LLLT (3 J/cm2 810 nm laser). Scale bar = 20 µm. (B) Quantification by Image J of mean fluorescence values. N= 6 fields per group. Error bars are SEM and * = p <0.05; ** = p<0.01 vs sham (dark).
3.4 Effect of 810 nm laser on cytoplasmic ROS generation measured by CellRox deep red
Representative images are shown in Fig5A and the quantification of the fluorescence measurements is shown in Fig 5B. In agreement with our previous study [22] we found find a significant rise (66%, p < 0.05) in cytoplasmic ROS when LLLT was delivered to control neurons without excitotoxins. The rise in ROS upon addition of excitotoxins ranged from 50% more (NMDA), 110% more (glutamate) to 200% more (kainate). In this experiment there was only a significant reduction in ROS (48% less, p <0.01) produced by LLLT in the case of kainate treated neurons. The increased ROS produced by glutamate and by NMDA was not significantly affected by LLLT.
Figure 5. Effect of 810-nm laser on intracellular reactive oxygen species (ROS) in cortical neurons with excitotoxicity.
(A) CellRox Red (red) fluorescence for cytoplasmic ROS and Hoechst (blue) fluorescence for nuclei in cortical neurons as control and with 3 excitotoxins, with and without LLLT (3 J/cm2 810 nm laser). Scale bar = 20 µm. (B) Quantification by Image J of mean fluorescence values. N= 6 fields per group. Error bars are SEM and * = p <0.05 vs sham (dark).
3.5 Effect of 810 nm laser on NO generation measured by DAF2
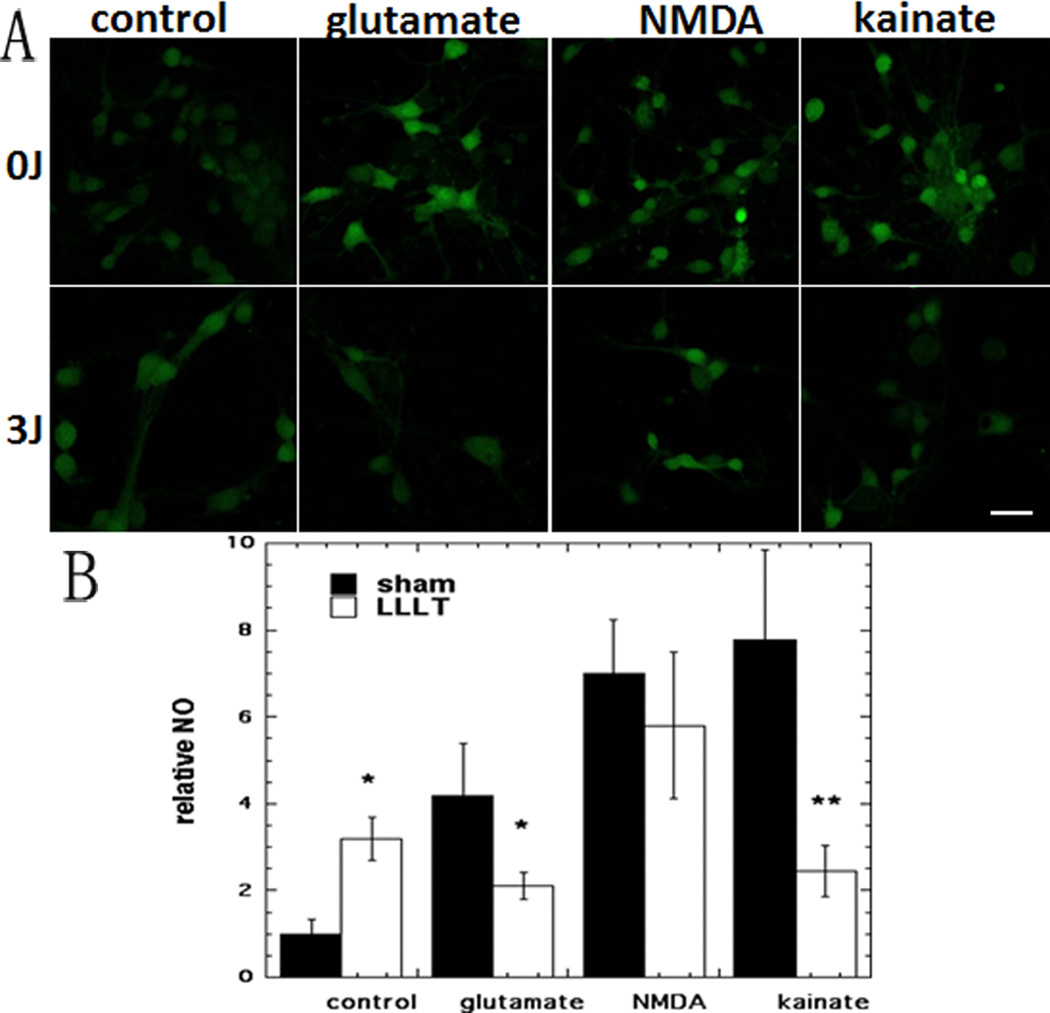
Representative images are shown in Fig 6A and the quantification of the fluorescence measurements is shown in Fig 6B. There was a rise in NO content of 220% in control neurons treated by LLLT (p < 0.05) in agreement with our previous study [22]. All three excitotoxins produced a large increase in NO ranging from 318% for glutamate, 600% for NMDA, to 677% for kainate (p < 0.01). LLLT reduced the NO content of glutamate-treated neurons by 50% (p < 0.05). While there was a 20% reduction in NO for NMDA treated neurons it was not statistically significant. The NO in kainate treated neurons was reduced most by 69% (p < 0.01) by LLLT.
Figure 6. Effect of 810-nm laser on nitric oxide (NO) production in cortical neurons with excitotoxicity.
(A) DAF-FM (green) fluorescence for NO in cortical neurons as control and with 3 excitotoxins, with and without LLLT (3 J/cm2 810 nm laser). Scale bar = 20 µm. (B) Quantification by Image J of mean fluorescence values. N= 6 fields per group. Error bars are SEM and * = p <0.05; ** = p <0.01 vs sham (dark).
4 DISCUSSION
Excitotoxins like N-methyl-D-aspartate (NMDA) and kainic acid (KA) which bind to ionotropic glutamate receptors (mGluR), as well as pathologically high levels of glutamate, can cause excitotoxicity by allowing an influx of calcium ions to enter the cell [25, 26]. Exogenous administration of glutamatergic agonists that activate KA or NMDA receptors in cultured primary neurons has proven to be a useful model system for studying the mechanisms of excitotoxic brain injury in mature neurons [27, 28] [29].
GluR are categorized into iGluRs and metabotropic Glu receptors (mGluRs), according to the mechanism by which their activation gives rise to a postsynaptic current [30]. iGluRs are ligand-gated nonselective cation channels. When binding to glutamate or glutamate analogs, iGluRs will open and allow the influx of Na+ (and sometimes Ca2+), directly causing different excitatory postsynaptic current for each type of receptors. mGluRs indirectly activate ion channels on the plasma membrane through a signaling cascade that involves G proteins. iGluRs tend to be faster in relaying information, but mGluRs are associated with a more prolonged stimulus. iGluRs have three major subtypes, termed the α-amino-3-hydroxy-5-methyl-4-isoxazolepropionic acid (AMPA), kainate, and NMDA.
Mitochondria are known to be key mediators of cell death through apoptotic and/or necrotic processes [31, 32]. In fact, mitochondrial dysfunction is a primary event of neurons exposed to Glu [33]. The inhibition of Ca2+ transport toward mitochondria is shown to protect neurons from cell death mediated by Glu, suggesting that Glu- induced neuronal death requires Ca2+ entry into mitochondria [34].
Excessive calcium in the cytosol can initiate apoptosis through cleaved caspase processing [26]. The major damaging result of excess calcium in the cytosol is the opening of the mitochondrial permeability transition pore (MPTP) [35, 36], that in the case of neurons can lead to cell death [37, 38].
Multiple studies have found the MPTP to be a key factor in the damage to neurons caused by excitotoxicity [33, 39, 40]. The induction of MPT, which increases mitochondrial membrane permeability, causes mitochondria to become further depolarized, which led Δψ abolished [33, 40]. Opening of MPTP may cause mitochondria to swell and allow entry of other substances, which can lead to apoptosis. Recently, it has been found that extrasynaptic NMDA receptor activation may cause loss of mitochondrial membrane potential (∆ψ) [41]. Loss of Δψ leads to decreased production of adenosine triphosphate (ATP), because mitochondria have lost the electrochemical gradient to provide the driving force for ATP production. In addition, ATP synthase may begin hydrolysing ATP instead of producing it [42]. Furthermore, the ion pumps such as Na+/Ca2+ exchanger, which consumes most of the ATP, must be activated more than normal in order to rid the cell of excess calcium when energy deficit happens in the cell. The MPTP also allows Ca2+ to leave the mitochondrion, which can place further stress on neighboring mitochondria. Reactive oxygen species (ROS) are also produced as a result of opening the MPT pore. MPT can allow antioxidant molecules such as glutathione to exit mitochondria, reducing the organelles' ability to neutralize ROS.
Under some conditions, NMDA-induced Δψ dissipation is abolished by inhibition of nitric oxide (NO) synthase (NOS) [43, 44]. NO dissipates Δψ at nanomolar concentrations, reversibly competing with O2 for the reduced binuclear center CuB/a3 of cytochrome oxidase [45, 46]. NMDA induced significantly larger DAF-FM slope increases compared with untreated neurons [47].
We have found that near-infrared laser can beneficially interact with all these detrimental effects caused in the cultured neurons by addition of three different excitotoxins. However the remarkable finding from our study is that the effects that LLLT has on normal neurons are in many cases diametrically opposed to the effects that LLLT has on neurons suffering from excitotoxicity. In fact the measurements can be divided into two groups: those in which the effect of the LLLT is similar in direction (both increased) regardless of whether the neurons are normal or excitotoxic (these are viability, ATP and MMP); and those measurements in which the direction of the LLLT effect is opposite, raised for normal neurons and decreased for excitoxic neurons (these are intracellular Ca2+, ROS and NO). This can be explained as follows. The photons are absorbed by cytochrome c oxidase in respiratory chain that increases electron transport thus increasing MMP and ATP synthesis. However a transient increase in MMP in normal cells could lead to increased electron leakage from the respiratory chain thus producing ROS, and moreover the increased production of ATP could lead to a transient increase in intracellular calcium by the phenomenon known as ATP-induced intracellular calcium increase [48, 49]. The transient increase in NO could also be explained by the recent finding [50] that in hippocampal neurons ATP can induce NO production via activation of ionotropic P2X7 (a purinoceptor for ATP) and hence up-regulation of neuronal nitric oxide synthase. Therefore the “unexpected increase in ATP above the physiological range” as a result of LLLT could be responsible for transient production of both of the Janus signaling molecules, ROS [51] and NO [52].
In the neurons subjected to excitotoxicity the situation is entirely different. The influx of calcium ions depolarizes the mitochondrial membrane and rapidly exhausts the supply of ATP. The inhibition of the electron transport chain due to lowered MMP also produces ROS (to a greater extent than that produced by LLLT stimulation of electron transport in normal neurons). The NO is probably produced by direct activation of iGluRs. When cytochrome c oxidase is activated by absorbed NIR photons, the resulting restoration of MMP due to increased electron transport removes the ROS generation, the increased ATP powers the Na+/Ca2+ ion-pump to rid the cell of excess calcium.
The divergent actions of LLLT on normal neurons compared to its action on stressed neurons was reported by us in a previous study looking at oxidative stress [23]. In that study we used three different oxidative stress-inducing agents and found that LLLT reduced the elevated intracellular ROS levels in the three kinds of stressed neurons, while increasing the ROS levels in normal unstressed neurons.
In conclusion the present study has added further mechanistic insights to the scientific rationale for the use of LLLT in brain disorders, and particularly its role after traumatic events such as stroke and TBI. The ability of LLLT to reverse many of the adverse consequences of neuronal excitotoxicity, in combination with its known ability to lower inflammation, increase angiogenesis and act as a neuroprotective agent should encourage its much wider use in these applications.
ACKNOWLEDGEMENTS
This work was supported by sponsored research funding from Photothera Inc and by NIH grant R01AI050875, Center for Integration of Medicine and Innovative Technology (DAMD17-02-2-0006), CDMRP Program in TBI (W81XWH-09-1-0514) and Air Force Office of Scientific Research (FA9950-04-1-0079).
Footnotes
Please see Supporting Information online.
REFERENCES
- 1.Karu T. J Photochem Photobiol B. 1989;3:638–640. doi: 10.1016/1011-1344(89)80088-0. [DOI] [PubMed] [Google Scholar]
- 2.Byrnes KR, Waynant RW, Ilev IK, Wu X, Barna L, Smith K, Heckert R, Gerst H, Anders JJ. Lasers Surg Med. 2005;36:171–185. doi: 10.1002/lsm.20143. [DOI] [PubMed] [Google Scholar]
- 3.Wu X, Dmitriev AE, Cardoso MJ, Viers-Costello AG, Borke RC, Streeter J, Anders JJ. Lasers Surg Med. 2009;41:36–41. doi: 10.1002/lsm.20729. [DOI] [PubMed] [Google Scholar]
- 4.Rochkind S. Neurosurg Focus. 2009;26:E8. doi: 10.3171/FOC.2009.26.2.E8. [DOI] [PubMed] [Google Scholar]
- 5.Oron A, Oron U, Chen J, Eilam A, Zhang C, Sadeh M, Lampl Y, Streeter J, DeTaboada L, Chopp M. Stroke. 2006;37:2620–2624. doi: 10.1161/01.STR.0000242775.14642.b8. [DOI] [PubMed] [Google Scholar]
- 6.Detaboada L, Ilic S, Leichliter-Martha S, Oron U, Oron A, Streeter J. Lasers Surg Med. 2006;38:70–73. doi: 10.1002/lsm.20256. [DOI] [PubMed] [Google Scholar]
- 7.Lapchak PA, De Taboada L. Brain Res. 2010;1306:100–105. doi: 10.1016/j.brainres.2009.10.022. [DOI] [PubMed] [Google Scholar]
- 8.Oron A, Oron U, Streeter J, de Taboada L, Alexandrovich A, Trembovler V, Shohami E. J Neurotrauma. 2007;24:651–656. doi: 10.1089/neu.2006.0198. [DOI] [PubMed] [Google Scholar]
- 9.Ando T, Xuan W, Xu T, Dai T, Sharma SK, Kharkwal GB, Huang YY, Wu Q, Whalen MJ, Sato S, Obara M, Hamblin MR. PLoS One. 2011;6:e26212. doi: 10.1371/journal.pone.0026212. [DOI] [PMC free article] [PubMed] [Google Scholar]
- 10.Wu Q, Xuan W, Ando T, Xu T, Huang L, Huang YY, Dai T, Dhital S, Sharma SK, Whalen MJ, Hamblin MR. Lasers Surg Med. 2012;44:218–226. doi: 10.1002/lsm.22003. [DOI] [PMC free article] [PubMed] [Google Scholar]
- 11.Huang YY, Gupta A, Vecchio D, Arce VJ, Huang SF, Xuan W, Hamblin MR. J Biophotonics. 2012;5:827–837. doi: 10.1002/jbio.201200077. [DOI] [PMC free article] [PubMed] [Google Scholar]
- 12.Khuman J, Zhang J, Park J, Carroll JD, Donahue C, Whalen MJ. J Neurotrauma. 2012;29:408–417. doi: 10.1089/neu.2010.1745. [DOI] [PMC free article] [PubMed] [Google Scholar]
- 13.Quirk BJ, Torbey M, Buchmann E, Verma S, Whelan HT. Photomed Laser Surg. 2012;30:523–529. doi: 10.1089/pho.2012.3261. [DOI] [PMC free article] [PubMed] [Google Scholar]
- 14.Michalikova S, Ennaceur A, van Rensburg R, Chazot PL. Neurobiol Learn Mem. 2008;89:480–488. doi: 10.1016/j.nlm.2007.07.014. [DOI] [PubMed] [Google Scholar]
- 15.Lampl Y, Zivin JA, Fisher M, Lew R, Welin L, Dahlof B, Borenstein P, Andersson B, Perez J, Caparo C, Ilic S, Oron U. Stroke. 2007;38:1843–1849. doi: 10.1161/STROKEAHA.106.478230. [DOI] [PubMed] [Google Scholar]
- 16.Lapchak PA. Ann Med. 2010;42:576–586. doi: 10.3109/07853890.2010.532811. [DOI] [PMC free article] [PubMed] [Google Scholar]
- 17.Albertini R, Villaverde AB, Aimbire F, Salgado MA, Bjordal JM, Alves LP, Munin E, Costa MS. J Photochem Photobiol B. 2007;89:50–55. doi: 10.1016/j.jphotobiol.2007.08.005. [DOI] [PubMed] [Google Scholar]
- 18.Wong-Riley MT, Liang HL, Eells JT, Chance B, Henry MM, Buchmann E, Kane M, Whelan HT. J Biol Chem. 2005;280:4761–4771. doi: 10.1074/jbc.M409650200. [DOI] [PubMed] [Google Scholar]
- 19.Liang HL, Whelan HT, Eells JT, Meng H, Buchmann E, Lerch-Gaggl A, Wong-Riley M. Neuroscience. 2006;139:639–649. doi: 10.1016/j.neuroscience.2005.12.047. [DOI] [PubMed] [Google Scholar]
- 20.Liang HL, Whelan HT, Eells JT, Wong-Riley MT. Neuroscience. 2008;153:963–974. doi: 10.1016/j.neuroscience.2008.03.042. [DOI] [PMC free article] [PubMed] [Google Scholar]
- 21.Lubart R, Eichler M, Lavi R, Friedman H, Shainberg A. Photomed Laser Surg. 2005;23:3–9. doi: 10.1089/pho.2005.23.3. [DOI] [PubMed] [Google Scholar]
- 22.Sharma SK, Kharkwal GB, Sajo M, Huang YY, De Taboada L, McCarthy T, Hamblin MR. Lasers Surg Med. 2011;43:851–859. doi: 10.1002/lsm.21100. [DOI] [PMC free article] [PubMed] [Google Scholar]
- 23.Huang YY, Nagata K, Tedford CE, McCarthy T, Hamblin MR. J Biophotonics. 2012 doi: 10.1002/jbio.201200157. [DOI] [PMC free article] [PubMed] [Google Scholar]
- 24.Dunn KW, Mayor S, Myers JN, Maxfield FR. Faseb J. 1994;8:573–582. doi: 10.1096/fasebj.8.9.8005385. [DOI] [PubMed] [Google Scholar]
- 25.Nakamura T, Cieplak P, Cho DH, Godzik A, Lipton SA. Mitochondrion. 2010;10:573–578. doi: 10.1016/j.mito.2010.04.007. [DOI] [PMC free article] [PubMed] [Google Scholar]
- 26.Dutta R, Trapp BD. Prog Neurobiol. 2011;93:1–12. doi: 10.1016/j.pneurobio.2010.09.005. [DOI] [PMC free article] [PubMed] [Google Scholar]
- 27.McGeer EG, McGeer PL. Int Rev Neurobiol. 1981;22:173–204. doi: 10.1016/s0074-7742(08)60293-7. [DOI] [PubMed] [Google Scholar]
- 28.Cook TM, Crutcher KA. Neuroscience. 1986;18:79–92. doi: 10.1016/0306-4522(86)90180-6. [DOI] [PubMed] [Google Scholar]
- 29.Azcoitia I, Sierra A, Garcia-Segura LM. Neuroreport. 1998;9:3075–3079. doi: 10.1097/00001756-199809140-00029. [DOI] [PubMed] [Google Scholar]
- 30.Palmada M, Centelles JJ. Front Biosci. 1998;3:d701–d718. doi: 10.2741/a314. [DOI] [PubMed] [Google Scholar]
- 31.Goldstein JC, Waterhouse NJ, Juin P, Evan GI, Green DR. Nat Cell Biol. 2000;2:156–162. doi: 10.1038/35004029. [DOI] [PubMed] [Google Scholar]
- 32.Green DR, Kroemer G. Science. 2004;305:626–629. doi: 10.1126/science.1099320. [DOI] [PubMed] [Google Scholar]
- 33.Schinder AF, Olson EC, Spitzer NC, Montal M. J Neurosci. 1996;16:6125–6133. doi: 10.1523/JNEUROSCI.16-19-06125.1996. [DOI] [PMC free article] [PubMed] [Google Scholar]
- 34.Stout AK, Raphael HM, Kanterewicz BI, Klann E, Reynolds IJ. Nat Neurosci. 1998;1:366–373. doi: 10.1038/1577. [DOI] [PubMed] [Google Scholar]
- 35.Hunter DR, Haworth RA, Southard JH. J Biol Chem. 1976;251:5069–5077. [PubMed] [Google Scholar]
- 36.Halestrap AP. Biochem Soc Trans. 2006;34:232–237. doi: 10.1042/BST20060232. [DOI] [PubMed] [Google Scholar]
- 37.Baines CP, Kaiser RA, Purcell NH, Blair NS, Osinska H, Hambleton MA, Brunskill EW, Sayen MR, Gottlieb RA, Dorn GW, Robbins J, Molkentin JD. Nature. 2005;434:658–662. doi: 10.1038/nature03434. [DOI] [PubMed] [Google Scholar]
- 38.Shalbuyeva N, Brustovetsky T, Bolshakov A, Brustovetsky N. J Biol Chem. 2006;281:37547–37558. doi: 10.1074/jbc.M607263200. [DOI] [PubMed] [Google Scholar]
- 39.Ichas F, Mazat JP. Biochim Biophys Acta. 1998;1366:33–50. doi: 10.1016/s0005-2728(98)00119-4. [DOI] [PubMed] [Google Scholar]
- 40.White RJ, Reynolds IJ. J Neurosci. 1996;16:5688–5697. doi: 10.1523/JNEUROSCI.16-18-05688.1996. [DOI] [PMC free article] [PubMed] [Google Scholar]
- 41.Hardingham GE, Fukunaga Y, Bading H. Nat Neurosci. 2002;5:405–414. doi: 10.1038/nn835. [DOI] [PubMed] [Google Scholar]
- 42.Stavrovskaya IG, Kristal BS. Free Radic Biol Med. 2005;38:687–697. doi: 10.1016/j.freeradbiomed.2004.11.032. [DOI] [PubMed] [Google Scholar]
- 43.Almeida A, Bolanos JP, Medina JM. Brain Res. 1999;816:580–586. doi: 10.1016/s0006-8993(98)01240-2. [DOI] [PubMed] [Google Scholar]
- 44.Keelan J, Vergun O, Duchen MR. J Physiol. 1999;520(Pt 3):797–813. doi: 10.1111/j.1469-7793.1999.00797.x. [DOI] [PMC free article] [PubMed] [Google Scholar]
- 45.Brown GC, Borutaite V. Biochem Soc Symp. 1999;66:17–25. doi: 10.1042/bss0660017. [DOI] [PubMed] [Google Scholar]
- 46.Antunes F, Boveris A, Cadenas E. Proc Natl Acad Sci U S A. 2004;101:16774–16779. doi: 10.1073/pnas.0405368101. [DOI] [PMC free article] [PubMed] [Google Scholar]
- 47.Marks JD, Boriboun C, Wang J. J Neurosci. 2005;25:6561–6575. doi: 10.1523/JNEUROSCI.1450-05.2005. [DOI] [PMC free article] [PubMed] [Google Scholar]
- 48.Guo Y, Hong YJ, Jang HJ, Kim MJ, Rhie DJ, Jo YH, Hahn SJ, Yoon SH. Korean J Physiol Pharmacol. 2010;14:21–28. doi: 10.4196/kjpp.2010.14.1.21. [DOI] [PMC free article] [PubMed] [Google Scholar]
- 49.Kim HJ, Choi JS, Lee YM, Shim EY, Hong SH, Kim MJ, Min DS, Rhie DJ, Kim MS, Jo YH, Hahn SJ, Yoon SH. Neuropharmacology. 2005;49:265–274. doi: 10.1016/j.neuropharm.2005.03.007. [DOI] [PubMed] [Google Scholar]
- 50.Codocedo JF, Godoy JA, Poblete MI, Inestrosa NC, Huidobro-Toro JP. PLoS One. 2013;8:e57626. doi: 10.1371/journal.pone.0057626. [DOI] [PMC free article] [PubMed] [Google Scholar]
- 51.Lipton SA. Nat Med. 1997;3:20–22. doi: 10.1038/nm0197-20. [DOI] [PubMed] [Google Scholar]
- 52.Calabrese V, Cornelius C, Rizzarelli E, Owen JB, Dinkova-Kostova AT, Butterfield DA. Antioxid Redox Signal. 2009;11:2717–2739. doi: 10.1089/ars.2009.2721. [DOI] [PubMed] [Google Scholar]


