

Abstract
Background
Berberine is known to improve glucose and lipid metabolism disorders, but it poorly absorbed into the blood stream from the gut. Therefore, the exact underlying mechanism for berberine is still unknown. In this study, we investigated the effect of berberine on glucose metabolism in diabetic rats and tested the hypothesis that berberine acts directly in the terminal ileums.
Methods
Rats were divided into a control group, diabetic group (DM), low dose of berberine group (BerL) and high dose of berberine group (BerH). Ileum samples were analyzed using a Roche NimbleGen mRNA array, qPCR and immunohistochemistry.
Results
We found that 8 weeks of treatment with berberine significantly decreased fasting blood glucose levels. An oral glucose tolerance test (OGTT) showed that blood glucose was significantly reduced in the BerL and BerH groups before and at 30 min, 60 min and 120 min after oral glucose administration. Plasma postprandial glucagon-like peptide-1 (GLP-1) levels were increased in the berberine-treated groups. The ileum from the BerH group had 2112 genes with significantly changed expression (780 increased, 1332 decreased). KEGG pathway analyses indicated that all differentially expressed genes included 9 KEGG pathways. The top two pathways were the MAPK signaling pathway and the GnRH signaling pathway. Q-RT-PCR and immunohistochemistry verified that glucagon-like peptide 1 receptor (Glp1r) and mitogen activated protein kinase 10 (Mapk10) were significantly up-regulated, in contrast, gonadotropin releasing hormone receptor (Gnrhr) and gonadotropin-releasing hormone 1 (Gnrh1) were down-regulated in the BerH group.
Conclusion
Our data suggest that berberine can improve blood glucose levels in diabetic rats. The mechanisms involved may be in the MAPK and GnRh-Glp-1 pathways in the ileum.
Keywords: Diabetes, Digestive tract, Gene expression, GnRH
Background
Diabetes is a disorder of the metabolism of carbohydrates, lipids and proteins in which the body cannot produce insulin or cannot use it to its full potential. Over 135 million people are affected by diabetes worldwide [1]. Diabetes can cause long-term complications such as retinopathy, neuropathy and nephropathy, and people with diabetes are at higher risk of myocardial infarction, stroke and limb amputation. Diabetes therapy is centered upon the control of blood glucose levels. Management of hyperglycemia with few side effects remains a challenge to the medical system.
Rhuzima Coptidis was recorded as an anti-diabetes medication approximately 1500 years ago in a book titled “Note of Elite Physicians” by Hongjing Tao. Berberine is the major active component of Rhizoma coptidis, and many studies have been published on the glucose reducing mechanisms of berberine. Zhou et al. found that berberine stimulated glucose transport through a mechanism distinct from insulin in 3T3-L1 adipocyes [2]. Moreover, berberine could activate AMPK and induced glycolysis in L6, C2C12, and 3 T3-L1 cell lines [3]. Additionally, berberine dose-dependently inhibited respiration in L6 myotubes through its specific effect on the respiratory complex I [4].
Berberine has beneficial properties in lipid and glucose metabolism regulation and has been effectively used in the treatment of diabetes, obesity and hypercholesterolemia. However, berberine has a low bioavailability [5], which is attributed to its poor aqueous solubility and dissolution.
Thus, we hypothesized that berberine can change gene expression in the intestine directly to moderate lipid and glucose metabolism. To understand the exact mechanisms, we used a type 2 diabetes rat model to investigate differential expression of genes in the intestine.
Methods
Animal modeling, groups, and treatment
Male Sprague–Dawley rats (280–320 g) were purchased from the Institute of Laboratory Animal Science, Chinese Academy of Medical Sciences and Peking Union Medical College (Beijing, China, SCXK-2012- 0007). According to a previous study [6] diabetic rats were fed a high-fat diet (40% of calories as fat) for 4 weeks and then administered with a single dose of streptozotocin (STZ, 50 mg/kg, tail vein) formulated in 0.1 mmol/l citrate buffer, pH 4.5 (Sigma-Aldrich, Germany). One week after the STZ injection, the random blood glucose levels of the diabetic rats were measured to confirm hyperglycemia. Random blood glucose measurements above 16.7 mmol/l were used to define rats as diabetic. Diabetic rats were fed a high-fat diet throughout the experiment. Diabetic rats with a similar degree of hyperglycemia were randomly divided into three groups: vehicle, low dose berberine (BerL), and high dose berberine (BerH) groups (n = 8, in each group). The typical human daily dose of berberine is 1200 mg/60 kg body weight. According to the formula: drat = dhuman X 0.71/0.11 [7], the corresponding dose of berberine for rats is 129.09 mg/kg per day, so we selected 120 mg/kg and 240 mg/kg per day as low and high dosages, respectively. The control (n = 8) and vehicle group received 0.5% saline, whereas the BerL and BerH groups were given berberine at 120 mg/kg and 240 mg/kg in 0.5% saline, respectively. The drug was administered once daily for 8 weeks using a gastric gavage. All animals were housed in an environmentally controlled room at 25°C in a 12 h light: 12 h darkness cycle and given free access to food and water throughout the experimental period. Fasting animals were allowed free access to water. After 6 weeks of treatment, an oral glucose tolerance test (OGTT) was performed. After 8 weeks of treatment, blood samples were taken from the rats after anesthesia. The rats were then sacrificed. Some terminal ileum sample was collected to perform the microarray and quantitative real-time PCR (qRT-PCR) experiments. Some terminal ileum sample was fixed in 10% neutralized formalin for immunohistochemical staining. All procedures involving animals were approved by the animal care and use committee of the Peking Union Medical College Hospital (Beijing, China, MC-07-6004) and were conducted in compliance with the Guide of the Care and Use of Laboratory Animals (NIH publication No. 86-23, revised 1996). All surgeries were performed under sodium pentobarbital anesthesia, and all efforts were made to minimize suffering.
Measurement of body weight and fasting blood glucose levels
Body weight was monitored every 2 weeks. The 6-h fasting blood glucose (FBG) level was measured monthly using the enzyme end-point method (Roche, Germany) with blood from a tail bleed.
Oral glucose tolerance test (OGTT)
After the rats fasted for 6 h, 2.2 g/kg of glucose was orally administered. Then, blood samples were collected from tail veins at 0 min (prior to glucose load), 30 min, 60 min, and 120 min (after glucose load) for the glucose assay. The area under the curve (AUC) was calculated for blood glucose during the OGTT using the following equation: AUC = 0.5 × (BG0 + BG30)/2 + 0.5 × (BG30 + BG60)/2 + 1 × (BG60 + BG120)/2, where BG is blood glucose.
Serum biochemistry analysis
At week 6, after the rats fasted for 6 h, the animals were euthanized. Rats received 2.2 g/kg of glucose by gavage, then the abdominal cavity was opened and a canula was inserted in the portal vein. Before the glucose load, some blood samples were taken and then centrifuged at 1000 g for 10 min. Serum was stored in aliquots at -80°C for an assay of serum fasting insulin. At 15 min following the glucose load, portal blood samples were collected in EDTA tubes containing dipeptidyle peptidase IV inhibitor (10 μL/mL blood sample, Millipore, MA, USA) via the portal vein. Plasma samples were obtained and stored at -80°C for assessment of glucagon-like peptide-1 (GLP-1). Serum insulin and plasma active GLP-1 (i.e., GLP-1 [7-36 amide] and GLP-1 [7-37]) was measured with an ELISA (Millipore, USA). HOMA-IR = FBG (mmol/L) × FINS (μU/mL)/22.5.
RNA preparation and whole-genome gene expression profiling array experiments
The terminal ileum was taken from the BerH group and DM group (n = 3, in each group) to perform the microarray experiments. We selected the Rat 12 × 135 K Gene Expression Array which was manufactured by Roche NimbleGen (Germany). This array includes approximately 26,420 genes. Before the microarray experiment, total RNA was harvested using TRIzol (Invitrogen, CA, USA) and an RNeasy kit (Qiagen, Valencia, CA, USA) according to the manufacturer’s instructions. Total RNA from each sample was quantified by the NanoDrop ND-1000 and RNA integrity was assessed by standard denaturing agarose gel electrophoresis. The total RNA of each sample was labeled using a NimbleGen One-Color DNA labeling kit and hybridized in a NimbleGen Hybridization System. After hybridization and washing, the processed slides were scanned with an Axon GenePix 4000B microarray scanner (Molecular Devices Corporation, USA). The microarray experiment was independently repeated in triplicate.
Gene array data analysis
The data files were imported into Agilent GeneSpring Software (Agilent, version 11.0, USA) for analysis. The gene expression level in the BerH group was normalized to that in the DM group. Differentially expressed genes were identified through Fold Change and t-test P-value screening.
To assign biological meaning to the group of genes with changed expression, the subset of genes that met the above criteria was analyzed with the Gene Ontology (GO) classification system, using Database for Annotation, Visualization, and integrated Discovery (DAVID) software (http://http:david.abcc.ncifcrf.gov/) [8] as well as the Kyoto Encyclopedia of Genes and Genomes (KEGG). All thresholds in our analyses were set to 0.001. Over-representation of genes with altered expression within specific GO categories was determined using the one-tailed Fisher exact probability modified by the addition of a jack-knifing procedure, which penalizes the significance of categories with very few (eg. one or two) genes and favors more robust categories with larger numbers of genes [9].
Quantitative real time PCR analysis
For validation of the microarray results, quantitative real time PCR (Q-RT-PCR) analyses were performed using SYBR Green. Each Q-RT-PCR assay was repeated using three biological replicates and each analysis consisted of three technical replicates. Before PCR, each total RNA was processed with RNase-free DNase (Qiagen, Valencia, CA, USA). RNA was reverse transcribed by Superscript II (Invitrogen, CA, USA). The primers were designed using Applied Biosystems (Foster City, CA, USA) Primer Express™ design software. Primers were purchased from Applied Biosystems (Table 1). The reaction production could be accurately measured in the exponential phase of amplification by the ABI prism 7700 Sequence Detection System, with the following cycling conditions: an initial denaturation at 48°C for 30 min, 95°C for 15 min, 40 cycles of 95°C for 15 sec, 55°C for 1 min, and a final unlimited 4°C hold. The sequences of the primers used are listed in Table 1. The signal of the housekeeping gene glyceraldehyde-3-phosphate dehydrogenase (Gapdh) was used for normalization. Relative quantification of the mRNA between BerL, BerH and DM rats was calculated with the comparative Ct method [10].
Table 1.
Olgonucleotide sequences for Q-PCR
| Gene symbol | Forward primer | Reverse primer |
|---|---|---|
|
Glp1r |
CATCGTGGTATCCAAACTGA |
GCTCGTCCATCACAAAGG |
|
Gnrh1 |
TGGTATCCCTTTGGCTTTCA |
TCCTCCTCCTTGCCCATCTC |
|
Gnrhr |
TTGTTGATGGCTGAGCAGTGA |
AAGCCCGTCCTTGGAGGAAAT |
|
Mapk10 |
TCGAGACCGTTTCAGTCCAT |
CCACGGACCAAATATCCACT |
| Gadph | GACCCCTTCATTGACCTCAAC | CGCTCCTGGAAGATGGTGATG |
Glp1r: glucagon-like peptide 1 receptor; Gnrh1: gonadotropin releasing hormone 1; Gnrhr: gonadotropin releasing hormone receptor; Mapk10: mitogen activated protein kinase 10.
Immunohistochemical straining
Ileum samples from the BerH and DM groups (n = 6 in each group) were fixed in 10% neutral buffered formalin, cast in paraffin, sliced into 4-μm sections and placed onto microscope slides. After the removal of the paraffin by xylene and dehydration by graded alcohol, the slides were immersed into distilled water. Ileum sections were then transferred into a 10 mmol/L citrate buffer solution (pH 6.0) and heated at 80°C for 5 min for antigen retrieval. After washing, 3.0% peroxide was applied for 20 min to block the activity of endogenous peroxidase. To avoid nonspecific staining, the sections were incubated in blocking solution (5% BSA, Sigma, Germany) for 1 h at room temperature, followed by treatment with rabbit polyclonal anti-GLP1R antibody (1:100, Abcam lnc., UK), or rabbit polyclonal anti-MAPK10 antibody (1:100, Abcam Inc., UK), where indicated, overnight at 4°C. Negative control sections were stained under identical conditions by substituting the primary antibody with equivalent concentrations of normal rabbit IgG. After washing with phosphate-buffered saline, the slides were incubated with a labeled streptavidin biotin reagent, following the manufacturer’s instructions. Immunoreactive products were visualized with the DAB reaction. Sections were counterstained with hematoxylin for 15 sec. Brownish yellow granular or linear deposits were interpreted as positive areas. Three observers who were blinded to the clinical information evaluated the immunohistochemical staining scores independently. Staining intensity was graded semi-quantitatively using the H-SCORE [11], which was calculated using the following equation: H-SCORE = ∑Pi (i + 1), where i is the intensity of staining with a value of 1, 2 or 3 (mild, moderate, or strong, respectively) and Pi is the percentage of epithelial cells stained with different intensity, varying from 0% to 100%. The results are expressed as the mean ± SE. Differences between the groups were statistically analyzed with a one-way analysis of variance (ANOVA). A P value of < 0.05 was considered significant.
Statistical analysis
All results are expressed as the mean ± standard deviation (SD). Statistical analyses were performed with analysis of variance followed by Student’s t-test. P < 0.05 was considered statistically significant. Analysis was done with SPSS 11.0 (SPSS, Inc., Chicago, IL, USA).
Results
Berberine showed no effect on body weight of DM rats
The mean body weight of diabetic rats was significantly decreased compared to the control rats at week 2 (P < 0.05), week 4 (P < 0.01), week 6 (P < 0.01) and week 8 (P < 0.01). No significant differences were noted between the DM group and berberine-treated groups (Figure 1A).
Figure 1.
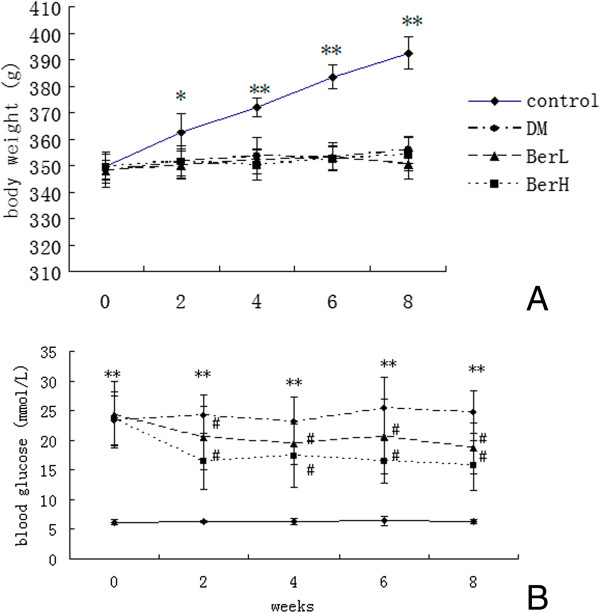
The body weight (A) and fasting blood glucose (B) before and after berberine treatment in the rats (n = 8, in each group). Data represent mean ± S. D. (n = 8). *P < 0.05, **P < 0.01 versus the control group; #P < 0.05 versus DM group.
Berberine decreased fasting blood glucose of DM rats
The fasting blood glucose (FBG) levels of DM rats and the BerL group and BerH group were significantly higher than those of control rats at week 0 (P < 0.01), week 2 (P < 0.01), week 4 (P < 0.01), week 6 (P < 0.01) and week 8 (P < 0.01). FBG in the BerL group and BerH group decreased significantly at week 2 (P < 0.05), week 4 (P < 0.05), week 6 (P < 0.05) and week 8 (P < 0.05) compared to the DM group (Figure 1B).
Berberine moderated the glucose tolerance of DM rats
The blood glucose levels of the DM, BerL and BerH groups were higher than those of the control group before (0 min, P < 0.01) and at 30 min (P < 0.01), 60 min (P < 0.01) and 120 min (P < 0.01) after oral glucose administration. Blood glucose levels of the BerL and BerH groups significantly decreased before (0 min, P < 0.05) and after oral glucose administration (P < 0.05 all above, Figure 2A). The AUC of OGTT for the DM, BerL and BerH groups increased compared to the control group (P < 0.05). The AUC for the BerL and BerH groups reduced compared with the DM group (P < 0.05, Figure 2B).
Figure 2.
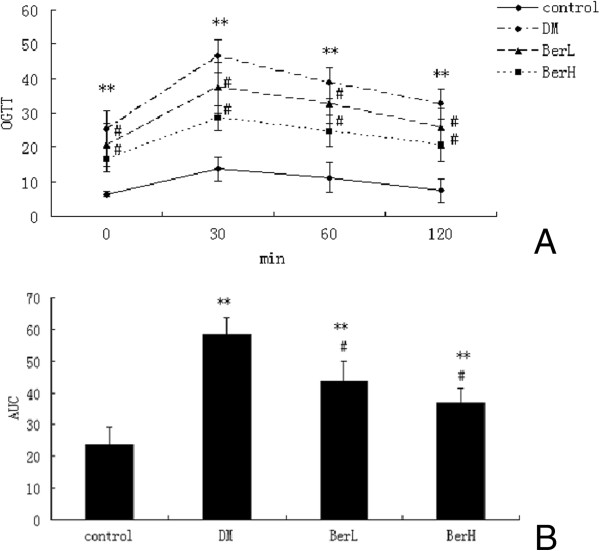
The effect of berberine on oral glucose tolerance test blood glucose (A) and AUC (B) in rats (n = 8, in each group). Data represent mean ± S. D. (n = 8). **P < 0.01 versus the control group; #P < 0.05 versus DM group.
Berberine reduced FINS and HOMA-IR in DM rats
FINS and HOMA-IR levels of the DM rats were significantly elevated (P < 0.01) after 8 weeks of treatment and berberine significantly suppressed FINS (P < 0.05) and HOMA-IR (P < 0.01, Figure 3A and B).
Figure 3.
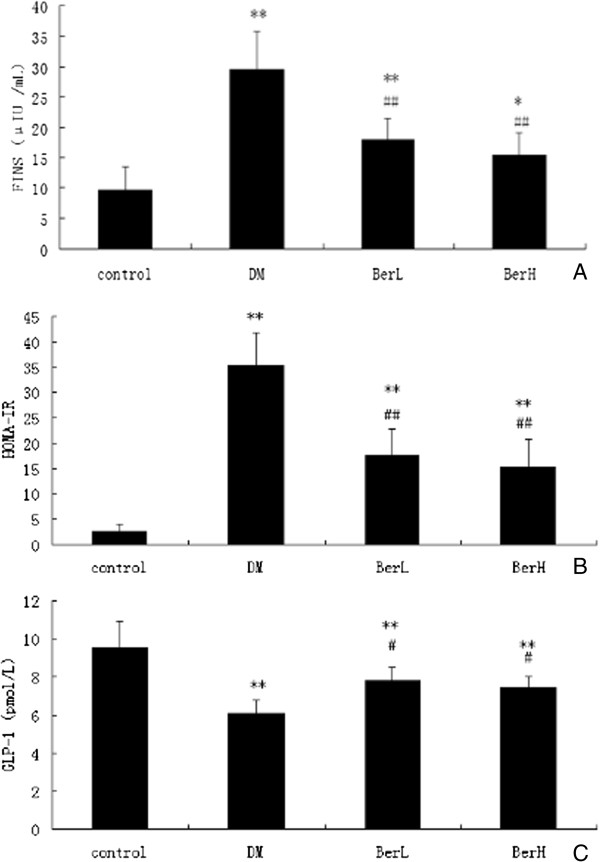
The effect of berberine on serum fasting insulin (A), HOMA-IR (B) and plasma postprandial GLP-1 (C) in rats (n = 8, in each group). Data represent mean ± S. D. (n = 8). **P < 0.01 versus the control group; # P < 0.05, ##P < 0.01 versus DM group.
Berberine increased GLP-1 in DM rats
Plasma postprandial GLP-1 levels in the BerH group were increased to the DM group (Figure 3C).
Genes differentially regulated by berberine
There were 2,112 differentially expressed genes identified in the terminal ileum between the BerH group and DM group. Of those, 780 genes (36.9%) were up-regulated and 1,332 genes (63.1%) were down-regulated in the BerH group.
The aforementioned DAVID annotation tool was used for identification of GO and putative KEGG pathways. DAVID analysis of all the differentially expressed genes yielded 55 GO categorues (FDR<0.001, Table 2). The genes were mapped to 9 pathways (FDR < 0.001, Table 3). Two of the most common types of enriched pathways were the MAPK signaling pathway (FDR = 3.26E-19) and the GnRH signaling pathway (FDR = 1.01E-13). In the MAPK signaling pathway, in particular, 266 genes were represented on the gene array, of which 95 genes were differentially expressed.
Table 2.
Gene ontology groups with significant over-representation among genes with significantly changed expression in the BerH (FDR < 0.001)
| GO classification | Go term | GO ID | Count | Fold enrichment | FDR |
|---|---|---|---|---|---|
| Biological process |
Intracellular signaling cascade |
GO:0007242 |
60 |
7.195 |
1.61E-18 |
| Phosphate metabolic process |
GO:0006796 |
55 |
7.186 |
1.06E-17 |
|
| Phosphorus metabolic process |
GO:0006793 |
55 |
7.169 |
1.20E-17 |
|
| Protein kinase cascade |
GO:0007243 |
34 |
14.126 |
7.10E-16 |
|
| Regulation of phosphorylation |
GO:0042325 |
37 |
10.287 |
1.03E-15 |
|
| Regulation of phosphate metabolic process |
GO:0019220 |
37 |
9.890 |
4.11E-15 |
|
| Regulation of phosphorus metabolic process |
GO:0051174 |
37 |
9.890 |
4.11E-15 |
|
| Protein amino acid phosphorylation |
GO:0006468 |
42 |
7.539 |
2.09E-14 |
|
| Regulation of kinase activity |
GO:0043549 |
32 |
12.455 |
2.41E-14 |
|
| Regulation of transferase activity |
GO:0051338 |
32 |
11.872 |
1.06E-13 |
|
| Response to organic substance |
GO:0010033 |
48 |
5.738 |
2.16E-13 |
|
| Regulation of protein kinase activity |
GO:0045859 |
30 |
12.280 |
1.81E-12 |
|
| Phosphorylation |
GO:0016310 |
42 |
6.516 |
5.62E-12 |
|
| MAPKKK cascade |
GO:0000165 |
24 |
18.618 |
9.75E-12 |
|
| Positive regulation of kinase activity |
GO:0033674 |
26 |
14.494 |
5.94E-11 |
|
| Positive regulation of transferase activity |
GO:0051347 |
26 |
13.866 |
1.81E-10 |
|
| Response to endogenous stimulus |
GO:0009719 |
37 |
7.163 |
2.64E-10 |
|
| Positive regulation of molecular function |
GO:0044093 |
34 |
7.439 |
6.39E-09 |
|
| Positive regulation of protein kinase activity |
GO:0045860 |
24 |
13.939 |
8.79E-09 |
|
| Positive regulation of catalytic activity |
GO:0043085 |
32 |
7.995 |
1.47E-08 |
|
| Response to hormone stimulus |
GO:0009725 |
33 |
7.178 |
8.01E-08 |
|
| Regulation of apoptosis |
GO:0042981 |
32 |
5.243 |
2.47E-06 |
|
| Regulation of programmed cell death |
GO:0043067 |
32 |
5.174 |
3.54E-06 |
|
| Regulation of cell death |
GO:0010941 |
32 |
5.152 |
4.01E-06 |
|
| Activation of protein kinase A activity |
GO:0034199 |
9 |
66.561 |
3.21E-05 |
|
| Enzyme linked receptor protein signaling pathway |
GO:0007167 |
21 |
8.320 |
7.94E-05 |
|
| Regulation of MAP kinase activity |
GO:0043405 |
15 |
14.469 |
2.47E-04 |
|
| Cellular response to hormone stimulus |
GO:0032870 |
16 |
12.588 |
2.76E-04 |
|
| Negative regulation of catalytic activity |
GO:0043086 |
19 |
9.007 |
3.78E-04 |
|
| cAMP biosynthetic process |
GO:0006171 |
8 |
73.957 |
4.80E-04 |
|
| Activation of protein kinase activity |
GO:0032147 |
14 |
15.687 |
6.06E-04 |
|
| Cellular constituent |
Cytosol |
GO:0005829 |
46 |
4.618 |
4.08E-17 |
| Cell fraction |
GO:0000267 |
32 |
3.714 |
9.48E-08 |
|
| Nucleoplasm |
GO:0005654 |
25 |
4.037 |
5.43E-06 |
|
| Insoluble fraction |
GO:0005626 |
25 |
3.716 |
2.73E-05 |
|
| Soluble fraction |
GO:0005625 |
16 |
6.026 |
5.40E-05 |
|
| Organelle lumen |
GO:0043233 |
31 |
2.849 |
1.12E-04 |
|
| Plasma membrane |
GO:0005886 |
45 |
2.108 |
1.93E-04 |
|
| Membrane-enclosed lumen |
GO:0031974 |
31 |
2.772 |
2.06E-04 |
|
| Nuclear lumen |
GO:0031981 |
26 |
3.148 |
3.24E-04 |
|
| Intracellular organelle lumen |
GO:0070013 |
28 |
2.668 |
0.002417965 |
|
| Molecular function | Protein kinase activity |
GO:0004672 |
38 |
7.617 |
4.54E-12 |
| Purine ribonucleotide binding |
GO:0032555 |
53 |
3.841 |
1.29E-11 |
|
| Ribonucleotide binding |
GO:0032553 |
53 |
3.839 |
1.33E-11 |
|
| Protein serine/threonine kinase activity |
GO:0004674 |
30 |
8.615 |
2.66E-11 |
|
| Purine nucleotide binding |
GO:0017076 |
53 |
3.660 |
1.11E-10 |
|
| ATP binding |
GO:0005524 |
46 |
4.169 |
6.83E-10 |
|
| Adenyl ribonucleotide binding |
GO:0032559 |
46 |
4.087 |
1.47E-09 |
|
| Adenyl nucleotide binding |
GO:0030554 |
46 |
3.856 |
1.44E-08 |
|
| Purine nucleoside binding |
GO:0001883 |
46 |
3.789 |
2.78E-08 |
|
| Nucleoside binding |
GO:0001882 |
46 |
3.759 |
5.66E-08 |
|
| Nucleotide binding |
GO:0000166 |
53 |
3.059 |
3.25E-07 |
|
| MAP kinase activity |
GO:0004707 |
9 |
59.748 |
7.78E-06 |
|
| Adenylate cyclase activity |
GO:0004016 |
8 |
82.079 |
1.34E-05 |
|
| Phosphoprotein phosphatase activity |
GO:0004721 |
15 |
13.329 |
5.76E-05 |
|
| Kinase binding | GO:0019900 | 16 | 10.031 | 5.56E-04 |
Table 3.
KEGG pathway (FDR < 0.001, Fold enrichment > 2.0)
| KEGG_ID | Term | Count | Total number of genes in the pathway | Fold enrichment | FDR | Genes |
|---|---|---|---|---|---|---|
| rno04010 |
MAPK signaling pathway |
95 |
266 |
17.985 |
3.26E-19 |
RGD1565395, HRAS, PDGFA, TGFB3, NFKB1, FGF12, NFKB2, DAXX, TGFB1, TGFB2, AKT1, CDC42, FOS, CASP3, MOS, RRAS, PRKACA, PRKACB, FAS, MAP2K7, AKT3, AKT2, MAP2K5, EGFR, PRKCA, RELA, PTPRR, TP53, FLNC, ECSIT, FLNB, PRKCB, MAPK1, MAP4K4, RASGRF1, JUN, MAPK3, PDGFRA, HSPB1, MAPK9, PDGFRB, MAPK8, MAP3K14, GADD45A, FGFR2, FGFR1, TRAF2, GRB2, MRAS, MAPKAPK5, MKNK2, DUSP10, ELK1, HSPA1A, HSPA1B, MAPKAPK2, HSPA1L, TNFRSF1A, HSPA2, ELK4, SOS1, SOS2, DUSP16, RAC1, PPP3CB, PPP3CC, PPP3CA, CHP, HSPA8, PTPN7, MAP2K1, MAP2K2, PTPN5, MAP2K3, NLK, MAP2K4, TAOK3, NR4A1, RAF1, MAPK10, DUSP5, NRAS, DUSP4, DUSP3, ATF4, DUSP2, DUSP1, MAPK14, NTRK2, IKBKG, MAPK8IP3, DUSP9, IKBKB, CRK, DUSP7, DUSP6 |
| rno04912 |
GnRH signaling pathway |
42 |
94 |
22.501 |
1.01E-13 |
ADCY3, ADCY4, ADCY1, HRAS, ADCY2, ADCY7, GRB2, ADCY5, GNA11, ADCY6, ELK1, GNRHR, MMP2, CDC42, PTK2B, SOS1, SOS2, PRKACA, PRKACB, MAP2K7, EGFR, PRKCA, GNRH1, MAP2K1, MAP2K2, MAP2K3, MAP2K4, RAF1, MAPK10, MMP14, PRKCD, PRKCB, MAPK1, NRAS, ATF4, GNAQ, ADCY9, JUN, MAPK14, MAPK3, MAPK9, MAPK8 |
| rno04540 |
Gap junction |
29 |
81 |
18.030 |
9.06E-11 |
ADCY3, ADCY4, ADCY1, HRAS, ADCY2, ADCY7, PDGFA, GRB2, ADCY5, GNA11, ADCY6, SOS1, SOS2, PRKACA, PRKACB, MAP2K5, PRKCA, EGFR, MAP2K1, MAP2K2, RAF1, PRKCB, NRAS, MAPK1, ADCY9, GNAQ, MAPK3, PDGFRA, PDGFRB |
| rno04722 |
Neurotrophin signaling pathway |
31 |
126 |
12.390 |
2.14E-09 |
HRAS, GRB2, NFKB1, MAPKAPK2, AKT1, CDC42, SOS1, RAC1, SOS2, MAP2K7, AKT3, AKT2, MAP2K5, MAP2K1, MAP2K2, RELA, TP53, RAF1, MAPK10, PRKCD, NRAS, MAPK1, ATF4, JUN, MAPK14, MAPK3, NTRK2, MAPK9, MAPK8, IKBKB, CRK |
| rno05200 |
Pathways in cancer |
43 |
317 |
6.831 |
4.57E-08 |
FGFR2, TRAF2, FGFR1, HRAS, PDGFA, GRB2, TGFB3, NFKB1, FGF12, NFKB2, MMP2, TGFB1, TGFB2, AKT1, CDC42, FOS, CASP3, SOS1, SOS2, RAC1, FAS, AKT3, AKT2, EGFR, PRKCA, MAP2K1, MAP2K2, RELA, TP53, RAF1, MAPK10, PRKCB, MAPK1, NRAS, JUN, IKBKG, MAPK3, PDGFRA, PDGFRB, MAPK9, MAPK8, IKBKB, CRK |
| rno04662 |
B cell receptor signaling pathway |
25 |
75 |
16.786 |
9.81E-07 |
HRAS, GRB2, NFKB1, AKT1, FOS, SOS1, RAC1, SOS2, PPP3CB, PPP3CC, CHP, PPP3CA, AKT3, AKT2, MAP2K1, MAP2K2, RELA, RAF1, PRKCB, NRAS, MAPK1, JUN, MAPK3, IKBKG, IKBKB |
| rno04660 |
T cell receptor signaling pathway |
28 |
109 |
12.936 |
2.43E-06 |
HRAS, GRB2, NFKB1, AKT1, CDC42, FOS, SOS1, SOS2, PPP3CB, PPP3CC, PPP3CA, CHP, MAP2K7, AKT3, AKT2, MAP2K1, MAP2K2, RELA, RAF1, NRAS, MAPK1, JUN, MAPK14, IKBKG, MAPK3, MAPK9, IKBKB, MAP3K14 |
| rno04062 |
Chemokine signaling pathway |
32 |
171 |
9.424 |
2.04E-05 |
ADCY3, ADCY4, ADCY1, HRAS, ADCY2, ADCY7, GRB2, ADCY5, ADCY6, NFKB1, AKT1, CDC42, PTK2B, SOS1, SOS2, RAC1, PRKACA, PRKACB, AKT3, AKT2, MAP2K1, RELA, RAF1, PRKCD, PRKCB, NRAS, MAPK1, ADCY9, IKBKG, MAPK3, IKBKB, CRK |
| rno05215 | Prostate cancer | 25 | 90 | 13.988 | 1.32E-04 | FGFR2, FGFR1, HRAS, PDGFA, GRB2, NFKB1, AKT1, SOS1, SOS2, AKT3, AKT2, EGFR, MAP2K1, MAP2K2, RELA, TP53, RAF1, NRAS, MAPK1, ATF4, IKBKG, MAPK3, PDGFRA, PDGFRB, IKBKB |
Immunohistochemical staining
To confirm that protein expression in the GLP1R and MAPK pathways was altered in the ileum of DM rats treated with berberine, immunohistochemistry analyses for GLP1R and MAPK10 were performed on ileum tissues. In the BerH group, there was a statistically significant increase in the immunoreactivities of GLP1R and MAPK10 (Figure 4).
Figure 4.
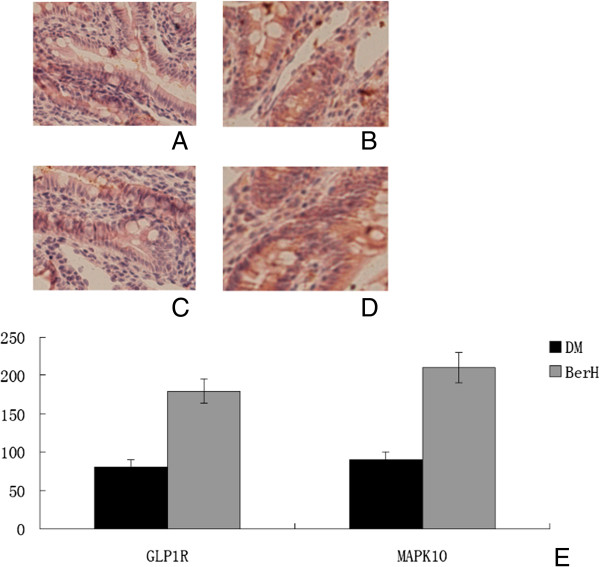
The iluem immunohistochemistry for GLP1R and MAPK10 expression (original magnification × 200) and semiquantitative assessments. A-B Immunostaining for GLP1R. C-D immunostaining for MAPK10. Iluem were harvested form DM (A, C) and berH group (B, D). (E) Semiquatitatve scores of GLP1R and MAPK10. Data represent mean ± SD (n = 6). #P < 0.05 versus DM group.
Q-RT-PCR experiment
We used Q-RT-PCR assays to verify some of the microarray results. Four genes [Glucagon-like peptide 1 receptor (Glp1r), gonadotropin-releasing hormone 1 (Gnrh1), gonadotropin releasing hormone receptor (Gnrhr) and mitogen activated protein kinase 10 (Mapk10)] were selected for verification, because of their central positions in the MAPK signaling pathway and GnRH signaling pathway. The expression ratios of these four genes, as determined through microarrays and Q-RT-PCR, are shown in Table 4. Glp1r and Mapk10 were up-regulated; while Gnrhr and Gnrh1 were down-regulated in both of the BerL group and BerH group. Strong agreement between the microarray and Q-RT-PCR results was observed for both genes, indicating the reliability of our microarray assays.
Table 4.
Fold change in gene expression measured by gene array and Q-RT-PCR
| Gene symbol |
BerL vs DM |
BerH vs DM |
||||
|---|---|---|---|---|---|---|
| Fold change (gene array) | Fold change (Q-RT-PCR) | P_value (Q-RT-PCR) | Fold change (gene array) | Fold change (Q-RT-PCR) | P_value (Q-RT-PCR) | |
|
Glp1r |
3.862 |
4.6 ± 0.3 |
0.027 |
4.231 |
4.3 ± 0.2 |
0.026 |
|
Gnrh1 |
−4.615 |
−3.7 ± 0.2 |
0.038 |
−3.758 |
−3.5 ± 0.3 |
0.025 |
|
Gnrhr |
−3.715 |
−3.1 ± 0.4 |
0.014 |
−3.271 |
−2.9 ± 0.4 |
0.039 |
| Mapk10 | 6.362 | 5.9 ± 0.3 | 0.031 | 5.837 | 6.2 ± 0.5 | 0.015 |
Glp1r: glucagon-like peptide 1 receptor; Gnrh1: gonadotropin-releasing hormone 1; Gnrhr: gonadotropin releasing hormone receptor; Mapk10: mitogen activated protein kinase 10.
Each Q-RT-PCR assay was repeated using three biological replicates and each analysis consisted of three technical replicates.
Discussion
In this study, we found that the administration of berberine to diabetic rats significantly reduced fasting blood glucose, moderated glucose tolerance and reduced serum insulin. These results suggest that berberine can moderate glucose metabolism and ameliorate oral glucose tolerance and insulin sensitivity. These results are similar to the results of other studies [12-16].
Moreover, we found that berberine increased plasma GLP-1 after an oral glucose load. GLP-1 is a gut derived hormone secreted from intestinal L cells in response to glucose [17]. GLP-1 exerts important effects on the regulation of glucose metabolism, stimulating glucose-dependent insulin secretion and promoting β cell proliferation [18]. At the same time, GLP-1 inhibits glucagon release, gastric emptying and food intake [19]. Berberine may increase GLP-1 (7-36) amide secretion in STZ-induced diabetic rats [20], even in normal SD rats [21]. Recently, Shan et al. found that berberine could increase GLP-2 in type 2 diabetic rats [22].
We found that berberine could increase the expression of Glp1r in gene array experiments and Q-PCR experiments. Camilleri et al. found that GLP-1 can suppress gastrointestinal movement [23]. Furthermore, Feng et al. found that berberine could inhibit myoelectrical activity and gastrointestinal transit in rodents [21]. Therefore, berberine can increase plasma GLP-1 levels and Glp-1r expression to suppress gastrointestinal movement, moderate insulin secretion, and therefore moderate glucose metabolism.
In KEGG analysis, we found that the significant pathway in the berberine-treated group was the MAPK signaling pathway. Q-RT-PCR verified this result. TNF-α is interconnected with MAPK pathways. Waetzig et al. found that SB203580, a p38 inhibitor, significantly reduced mucosa secretion of TNF-α [24]. Hollenbach et al. found that SB203580 can reduce the mRNA levels of proinflammatory cytokines (i.e., TNF-α, IL-2 and IL-18) in the gut of BALB/c mice [25].
The GnRH signaling pathway was the second pathway in KEGG analysis. Q-PCR experiments also showed Gnrh1 and Gnrhr was reduced in the BerH group. Gonadotropin-releasing hormone (GnRH) and its receptor were expressed in the rat gastrointestinal system, pancreas and submaxillary glands, and its receptor had the same mRNA sequence with that of the hypothalamus, which demonstrated that GnRH was a brain-gut peptide [26,27]. Intestinal GnRH had a regulatory role on the endocrine and exocrine functions of the digestive system. GnRH and its receptor were also expressed in glucagon-immunoreactive cells of the rat ileum. GnRH analogs had a regulatory role on intestinal glucagon-like immunoreactivity [28]. A focused literature review showed GnRH agonists could increase the weight and fat mass and insulin resistance syndrome in men. These results indicate that GnRH may increase the risk of diabetes mellitus [29]. In premenopausal women with symptomatic uterine leiomyomas, GnRH agonists also increased insulin levels and HOMA scores [30]. Moreover, Antide, a GnRH receptor antagonist, administration prevented an increased incidence of diabetes in a castrated male nonobese mouse model of autoimmune diabetes (NOD) mice [31]. In addition, GnRH modulates the expression of insulin in the NOD mouse independently of gonadal steroids. These results demonstrated that GnRH could inhibit insulin secretion by islet cells in vitro experiments [32]. Thus, berberine may moderate blood glucose and insulin secretion through decreasing activity of GnRH.
Conclusion
In conclusion, our studies provide evidence that berberine reduces blood glucose and insulin in diabetic rats. The mechanism may be within the MAPK pathway and GnRH-GLP-1 pathway in the ileum. These results provide molecular information for further investigation of the mechanisms by which berberine moderates glucose metabolism. Furthermore, these results could be important in devising mechanism-based and targeted therapeutic strategies for diabetes. More experiments should been performed in the future to confirm these results (such as studying gastrointestinal movement and use of Western blot analysis).
Competing interests
The authors declare that there is no competng interest that could be perceived as prejudicing the impartiality of the research reported.
Authors’ contributions
QZ, ZXW, MY, HBZ and FP conceived and designed the experiments and performed the experiments. ML, WHL and JZ analyzed the data. QZ wrote the manuscript. All authors read and approved the final manuscript.
Pre-publication history
The pre-publication history for this paper can be accessed here:
Contributor Information
Qian Zhang, Email: rubiacordifolia@sohu.com.
Xinhua Xiao, Email: xiaoxinhua@medmail.com.cn.
Ming Li, Email: liming1@outlook.com.
Wenhui Li, Email: liwenhui68@vip.sina.com.
Miao Yu, Email: yumiao@medmail.com.cn.
Huabing Zhang, Email: huabingzhang@yahoo.com.
Fan Ping, Email: pingfan6779@163.com.
Zhixin Wang, Email: wangzhixin-903@163.com.
Jia Zheng, Email: 6300607933@163.com.
Acknowledgments
This work was funded by National Natural Science Foundation of China (No. 81170736), National Natural Science Foundation for Young Scholars of China (No. 81300649), National Key Program of Clinical Science and Peking Union Medical College Hospital Foundation for Young Scholars (pumch-2013-122).
References
- Wild S, Roglic G, Green A, Sicree R, King H. Global prevalence of diabetes. Diabetes Cares. 2004;27:1047–1053. doi: 10.2337/diacare.27.5.1047. [DOI] [PubMed] [Google Scholar]
- Zhou L, Yang Y, Wang X, Liu S, Shang W, Yuan G, Li F, Tang J, Chen M, Chen J. Berberine stimulates glucose transport through a mechanism distinct from insulin. Metabolism. 2007;56:405–412. doi: 10.1016/j.metabol.2006.10.025. [DOI] [PubMed] [Google Scholar]
- Yin J, Gao Z, Liu D, Liu Z, Ye Y. Berberine improves glucose metabolism through induction of glycolysis. Am J Physiol. 2008;294:E148–E156. doi: 10.1152/ajpendo.00211.2007. [DOI] [PMC free article] [PubMed] [Google Scholar]
- Turner N, Li YJ, Gosby A, To SW, Cheng Z, Miyoshi H, Taketo MM, Cooney GJ, Kraegen EW, James DE, Hu LH, Li J, Ye JM. Berberine and its more biologically available derivative, dihydroberberine, inhibit mitochondrial respiratory complex I: a mechanism for the action of berberine to activate AMP-activated protein kinase and improve insulin action. Diabetes. 2008;57:1414–1418. doi: 10.2337/db07-1552. [DOI] [PubMed] [Google Scholar]
- Wang YW, Wang YP, Zhang H, Kong WJ, Li YH, Liu F, Gao RM, Liu T, Jiang JD, Song DQ. Synthesis and biological evalutation of berberine analogues as novel up-regulators for both low-density-lipoprotein receptor and insulin receptor. Bioorg Med Chem Lett. 2009;9:6004–6008. doi: 10.1016/j.bmcl.2009.09.059. [DOI] [PubMed] [Google Scholar]
- Reed MJ, Meszaros K, Entes LJ, Claypool MD, Pinkett JG, Gadbois TM, Reaven GM. A new rat model of type 2 diabetes: the fat-fed, streptozotocin-treated rat. Metabolism. 2000;49:1390–1394. doi: 10.1053/meta.2000.17721. [DOI] [PubMed] [Google Scholar]
- Huang JH, Huang XH, Chen ZY, Zheng QS, Sun RY. Dose conversion among different animals and healthy volunteers in pharmacological study. Chinese J Clinical Pharmacol Therap. 2004;9:1069–1072. [Google Scholar]
- Dennis G Jr, Sherman BT, Hosack DA, Yang J, Gao W, Lane HC, Lempicki RA. DAVID: database for annotation, visualization, and intrgrated discovery. Genome Biol. 2003;4:P3. doi: 10.1186/gb-2003-4-5-p3. [DOI] [PubMed] [Google Scholar]
- Hosack DA, Dennis G Jr, Sherman BT, Lane HC, Lempocki RA. Identifying biological themes within lists of genes with EASE. Genome Biol. 2003;4:R70. doi: 10.1186/gb-2003-4-10-r70. [DOI] [PMC free article] [PubMed] [Google Scholar]
- Livak KJ, Schmittgen TD. Analysis of relative gene expression data using real-time quantitative PCR and the 2(-delta delta C(T)) method. Methods. 2001;25:402–408. doi: 10.1006/meth.2001.1262. [DOI] [PubMed] [Google Scholar]
- Heeckt PF, Klein D, Beger HG. Short-bowel syndrome-surgical treatment with long-term benefit? Langenbecks Arch Surg. 2000;385:50–56. doi: 10.1007/s004230050011. [DOI] [PubMed] [Google Scholar]
- Lee YS, Kim WS, Kim KH, Yoon MJ, Cho HJ, Shen Y, Ye JM, Lee CH, Oh WK, Kim CT, Hohnen-Behrens C, Gosby A, Kraegen EW, James DE, Kim JB. Berberine, a natural plant product, activates AMP-activated protein kinase with beneficial metabolic effects in diabetic and insulin-resistant states. Diabetes. 2006;55:2256–2264. doi: 10.2337/db06-0006. [DOI] [PubMed] [Google Scholar]
- Yin J, Hu R, Chen M, Tang J, Li F, Yang Y, Chen J. Effects of berberine on glucose metabolism in vitro. Metabolism. 2002;51:1439–1443. doi: 10.1053/meta.2002.34715. [DOI] [PubMed] [Google Scholar]
- Tang LQ, Wei W, Chen LM, Liu S. Effects of berberine on diabetes induced by alloxan and a high fat/highcholesterol diet in rats. J Ethnopharmacol. 2006;108:109–115. doi: 10.1016/j.jep.2006.04.019. [DOI] [PubMed] [Google Scholar]
- Gao CR, Zhang JG, Huang QL. Experimental study on berberin raised insulin sensitivity in insulin resistance rat Models. Zhongguo Zhong Xi Yi Jie He Za Zhi. 1997;17:162–164. Chinese. [PubMed] [Google Scholar]
- Zhang Q, Xiao X, Feng K, Wang T, Li W, Yuan T, Sun Q, Xiang H, Wang H. Berberine moderates glucose and lipid metabolism through multipathway mechanism. Evidence-based Complement Alter Med. 2011. doi:10.1155/2011/924851. Epub 2010 Sep 26. [DOI] [PMC free article] [PubMed]
- Burcelin R, Cani PD, Knauf C. Glucagon-like peptide-1 and energy homeostasis. J Nutri. 2007;137:2534S–2538S. doi: 10.1093/jn/137.11.2534S. [DOI] [PubMed] [Google Scholar]
- Schmidtler J, Schepp W, Janczewska I, Weigert N, Furlinger C, Schusdziarra V, Classen M. GLP-1-(7-36) amide -(1-37), and -(1-36) amide: potent cAMP-dependent stimuli of rat parietal cell function. Am J Physiol. 1991;260:940–950. doi: 10.1152/ajpgi.1991.260.6.G940. [DOI] [PubMed] [Google Scholar]
- Ranganath LR. Incretins: pathophysiological and therapeutic implications of glucose-dependent insulinotropic polypeptide and glucagon-like peptide-1. J Clin Pathol. 2008;61:401–409. doi: 10.1136/jcp.2006.043232. [DOI] [PubMed] [Google Scholar]
- Lu SS, Yu YL, Zhu HJ, Liu XD, Liu L, Liu YW, Wang P, Xie L, Wang GJ. Berberine promotes glucagon-like peptide-1 (7-36) amide secretion in streptozotocin-induced diabetic rats. J Endocronol. 2009;200:159–165. doi: 10.1677/JOE-08-0419. [DOI] [PubMed] [Google Scholar]
- Feng Y, Li Y, Chen X, Lin X, Yang Y, Cai H, Lv Z, Cao M, Li K, Xu J, Li S, Jia Y. Inhibiting roles of berberine in gut movement of rodents are related to activation of the endogenous opioid system. Phytotheapyr Res. 2013;27:1564–1571. doi: 10.1002/ptr.4926. [DOI] [PubMed] [Google Scholar]
- Shan C, Yang J, Kong Y, Wang X, Zheng M, Xu Y, Wang Y, Ren H, Chang B, Chen L. Alteration of intestinal barrier and GLP2 secretion in berberine treated type 2 diabetic rats. J Endocrinol. 2013;218:255–262. doi: 10.1530/JOE-13-0184. [DOI] [PubMed] [Google Scholar]
- Camilleri M, Vazguez-Rogue M, Iturrino J, Boldingh A, Burton D, McKinzie S, Wong BS, Rao AS, Kenny E, Mansson M, Zinsmeister AR. Effect of a glucagon-like peptide 1 analog, ROSE-010, on GI motor functions in female patients with constipation-predominant irritable bowel syndrome. Am J Physiol Gastroint Liver Physiol. 2012;303:G120–G128. doi: 10.1152/ajpgi.00076.2012. [DOI] [PubMed] [Google Scholar]
- Waetzig GH, Seegert D, Rosenstiel P, Nikolaus S, Schreiber S. p38 mitogen-activated protein kinase is activated and linked to TNF- alpha signaling in inflammatory bowel disease. J Immunol. 2002;168:5342–5351. doi: 10.4049/jimmunol.168.10.5342. [DOI] [PubMed] [Google Scholar]
- Hollenbach E, Neumann M, Vieth M, Roessner A, Malfertheiner P, Naumann M. Inhibition of p38MAP kinase- and RICK/NF-kappaB-signaling suppresses inflammatory bowel disease. FASEB J. 2004;18:1550–1552. doi: 10.1096/fj.04-1642fje. [DOI] [PubMed] [Google Scholar]
- Huang W, Yao B, Sun L, Pu R, Wang L, Zhang R. Immunohistichemical and in situ hybridization of gonadotropin releasing hormone (GnRH) and its receptor mRNA in rat digestive tract. Life Sci. 2001;68:1727–1734. doi: 10.1016/S0024-3205(01)00968-7. [DOI] [PubMed] [Google Scholar]
- Yao B, Huang W, Huang Y, Chui Y, Wang Y, Li H, Pu R, Wan L, Zhang R. A study on the localization and distribution of GnRH and its receptor in rat submaxillary glands by immunohistochemical, in situ hybridization and RT-PCR. Life Sci. 2003;72:2895–2904. doi: 10.1016/S0024-3205(03)00194-2. [DOI] [PubMed] [Google Scholar]
- Gao B, Ji QH, Huang WQ. Immunihistichemical localization of glucagon, gonadotropin releasing hormone receptor in rat digestive tract. Chinese J Anatomy. 2004;27:372–379. [Google Scholar]
- Smith MR. Ostroporosis and obesity in men receiving hormone therapy for prostate cancer. J Urol. 2004;172:S52–S57. doi: 10.1097/01.ju.0000141820.17959.2f. [DOI] [PubMed] [Google Scholar]
- Palomba S, Russo T, Orio JF, Sammartino A, Sbano FM, Nappi C, Colao A, Mastrantonio P, Lombardi G, Zullo F. Lipid, glucose and lomocysteine metabolism in women treated with a GnRH agonist with or without raloxifene. Hum Reprod. 2004;19:415–421. doi: 10.1093/humrep/deh053. [DOI] [PubMed] [Google Scholar]
- Ansari MA, Dhar M, Spieker S, Bakht N, Rahman AM, Moore WV, Jacobson JD. Modulation of diabetes with gonadotropin-releasing hromine antagonists in the nonobese mouse model of autoimmune diabetes. Endocrinology. 2004;145:337–342. doi: 10.1210/en.2003-0512. [DOI] [PubMed] [Google Scholar]
- Klier M, Schusdziarra V, Pfeiffer EF. Effect of luteinizing hormone-releasing hormone upon insulin release form rat islets in vitro. FEBS Lett. 1980;121:363–365. doi: 10.1016/0014-5793(80)80382-6. [DOI] [PubMed] [Google Scholar]