

Abstract
We report on a noncontact low-coherence optical phase-based imaging method, termed shear wave imaging optical coherence tomography (SWI-OCT), which enables 2D depth-resolved visualization of the low-amplitude elastic wave propagation in tissue with ultrahigh frame rate. SWI-OCT is based on 1D transverse scanning of the M-mode OCT imaging that is precisely synchronized with a low-pressure short-duration air-puff loading system. This approach of scanning and data recording allows visualization of the induced tissue deformation at high frame rate. The applied phase-resolved interferometric technique, with sensitivity on the nanometer scale, makes the low-amplitude tissue displacement detectable. For the demonstration of this method, and to study its application for tissue biomechanics, we performed pilot experiments on agar phantoms and ex vivo rabbit corneas. Samples with different elastic properties can be differentiated based on the velocity of the elastic wave propagation that is directly visualized with a 25 kHz frame rate. Our results indicate that SWI-OCT has the potential to be further developed as a major technique for depth-resolved high-resolution tissue elastography in vivo.
The mechanical properties (e.g., elasticity) of tissues are of great clinical significance for the detection and the diagnosis of various diseases [1,2]. Assessing the velocity of the elastic waves propagating in tissue is an important approach for quantitatively measuring tissue elasticity, and has been widely used with many imaging modalities, including ultrasonic imaging [3,4], magnetic resonance imaging [5], and optical techniques [6–8]. Thus, direct visualization of the propagating elastic waves in tissue with ultrahigh frame rate can provide more straightforward and explicit information on the tissue biomechanical properties (and, thus, health of the tissue), which is extremely helpful for rapid clinical tissue examination and high-resolution tissue elastography.
The current ultrafast ultrasonic imaging technique, supersonic shear imaging, enables the visualization of shear wave propagation in tissue with tens of kHz frame rate [4]. Elastographic images (2D and 3D) can be generated based on wave velocity, and have been successfully utilized in the clinical detection of tumors, like breast cancer [9]. However, the relatively low depthwise resolution of ultrasonic imaging may prevent the use of this technique for detecting small targets of micro-scale size. This limitation can become more prominent when dealing with ocular tissues, e.g., cornea, since the axial sampling points are highly reduced with the small sample thickness (less than 1 mm) [10]. Besides, for efficient detection, this low spatial resolution requires relatively high amplitude (tens of microns) of tissue deformation to be induced, which might be harmful to delicate soft tissues, such as cornea.
Optical coherence tomography (OCT) is a 3D imaging modality that has been demonstrated for in vivo high-resolution (1–10 μm) ocular tissue imaging [11], and recent developments in phase-resolved OCT allows tissue displacement sensitivity at the nano-scale [12]. However, the relatively low frame rate (up to 400 Hz with 500 A-lines per frame) of traditional OCT imaging methods limits the capability of using OCT for the direct visualization of shear waves propagating in tissue. To address this problem, in this Letter, we introduce a new optical phase-based imaging method, termed shear wave imaging OCT (SWI-OCT), which enables 2D depth-resolved visualization of the low-amplitude elastic (shear, Lamb, etc.) wave propagation in tissue with the frame rate at the A-line acquisition speed.
The SWI-OCT system is developed with the combination of a phase-sensitive spectral-domain OCT and a focused air-puff device. The schematic of the system setup is shown in Fig. 1(a). The detailed description of the OCT system can be found in our recent publication [13]. This spectral domain system provides an axial resolution of ~9 μm in tissue with the A-line acquisition speed of 25 kHz. The M-mode OCT imaging (continuously acquiring A-scans over time at a constant position), thus, has the temporal resolution of 0.04 ms. The phase stability of the system can reach ~0.03 radius, corresponding to ~2 nm of the sensitivity to the sample displacement. The focused air-puff system has an output stream of low-pressure air with a time duration of ~800 μs (FWHM of the Gaussian profile). The detailed characterization of this loading system can be found in our previous study [14]. The pressure of the air excitation on the tissue surface can be well predicted and controlled, based on the source pressure, the distance, and the angle of the air-puff delivery, which makes it a suitable device for loading delicate ocular tissues like cornea.
Fig. 1.

(a) Schematic of the SWI-OCT system setup. (b) Illustration of the system synchronization. (c) Illustration of the positions for loading and imaging with SWI-OCT.
For the synchronization of the OCT recording and the air-puff excitation, a transistor–transistor logic signal from the digital-to-analog convertor (DAC) is used to simultaneously trigger the start of the OCT M-mode imaging and the opening of the air gate. Therefore, the delivery of the air-puff occurs simultaneously with starting each M-mode data acquisition, as shown in Fig. 1(b). For the scan, the step-rotation of one of the galvanometer mirrors is precisely synchronized with the triggering signal from the DAC, as illustrated in Fig. 1(b). The synchronizations in our study are confirmed using an oscilloscope. The movement of the mirror forms a one-dimensional scan line on the sample surface, where the M-mode imaging is performed at each scanning position, as shown in Fig. 1(c). The loading from the air-puff system is maintained at the same point within the scan line during imaging. With respect to the air-puff excitations, all the M-mode imaging can be treated as performed at the same time, but at different spatial locations. Thus, the 2D depth-resolved information of the tissue displacement is acquired over time, and can be reconstructed to be visualized at the rate of the A-line acquisition speed.
The total time required for the SWI-OCT data acquisition depends on the number of scanning points and the duration of the M-mode imaging, which can be selected based on the velocity of the shear waves. For example, with 2 m/s wave velocity, which is a typical value for in vivo healthy pig corneas [15], to scan a transverse distance of 6 mm, the M-mode imaging duration should be at least 3 ms to cover the whole wave-propagation process. Taking into account the time for the air-puff to reach the tissue surface (1–2 ms) and also for the induced tissue displacement to damp to zero (up to 10 ms for healthy corneas), the duration of M-mode imaging can be selected as 20 ms. With 500 transverse scanning positions, the total data acquisition time is 10 s, which makes SWI-OCT potentially possible for in vivo applications.
Based on the phase-retrieval technique for low-coherence interferometric systems [16], we developed our reconstruction method for 2D depth-resolved visualization of the propagating shear waves. The whole procedure for the reconstruction is shown in Fig. 2. From the OCT, complex signals (after inverse-Fourier-transform), both intensity and phase M-mode images can be achieved with the depthwise tissue information over time. Due to a 1D transverse scan, we have 3D (transverse-depthwise-temporal) data matrices for both the intensity and the phase values. For the phase data, from each position within the spatial plane, the phase profile, over time, can be obtained through signal unwrapping and represent the dynamic deformation amplitude of the tissue. Then, all these phase signals are shifted to have the initial phase values close to zero, which aligns the original states of all spatial positions. After this, the phase values p(t) are converted to the displacement values d(t), based on a system central wavelength λ (0.84 μm) and sample refractive index n, with the equations: dsurface (t) λpsurface(t)/4πnair for the sample surface and dinside(t)=λ[pinside(t) + (nsample – nair)psurface(t)/nair]/4πnsample for inside the sample. Based on the aligned 3D displacement data, depth-resolved 2D displacement images can be obtained with a transposed view of the data from the transverse-depthwise plane. Similar to this, from the matrix of intensity values, a depth-resolved 2D intensity image of the sample is directly produced at the time point before the air-puff excitation. This OCT structural image is then binarized and used as a mask for element-by-element multiplication with all the obtained displacement images, which results in the elimination of random displacement profiles from the image background. Finally, the 2D depth-resolved displacement images are properly scaled and color-coded for visualization over time.
Fig. 2.

Reconstruction procedure of SWI-OCT method.
To demonstrate the SWI-OCT method and to study its application for corneal biomechanics, we have performed pilot experiments on agar phantoms and ex vivo rabbit corneas. In the phantom experiments, two types of agar samples (n assumed to be 1.3330) are utilized. One is 1% homogeneous phantom; the other is mixed phantom, with 1% and 2% parts connected. The OCT structural images of these two phantoms are shown in Fig. 3(a), where the yellow spots represent the positions of the air-puff excitations. The reconstructed visualizations of the shear wave propagation with 25 kHz frame rate in these two samples are placed together for comparison, and are shown in Fig. 3(b) (Media 1). It can be seen that, at the time of 0 ms, the air-puff is just arriving at the surface of the phantoms and small displacement at the excitation position can be observed. During the wave propagation in the 1% part in the mixed phantom, it is clear that the wavefront is at the same location as the one from the shear wave propagating in the 1% homogeneous phantom, shown at the time of 0.68 ms. Here, we define the wavefront as the furthest position that has a negative displacement amplitude, meaning the place in the sample that has the initial downward displacement. The wavefronts are positioned using dotted lines in the figures. When the shear wave enters the 2% part in the mixed phantom, the wave velocity suddenly increases, and, at the time of 1.44 ms it can be observed that the wavefront already leads the one from the wave in the homogeneous sample. The velocity of the shear wave can be calculated based on the selected distance divided by the time duration, for which the detailed information can be found in our previous work [14,17]. The quantified wave velocities indicate good agreement with the literature [18,19], and are listed in Table 1. These results demonstrate that the ultrafast visualization of the shear wave propagation provided by SWI-OCT can offer direct and straightforward information on a sample’s elastic properties. At the time of 1.96 ms, shown in Fig. 3(b), the deformation in the 2% part of the mixed phantom has reduced amplitude compared with the 1% homogeneous sample, due to higher stiffness in the 2% region.
Fig. 3.

(a) OCT structural images of the phantom samples. (b) Visualization of the shear wave propagation in agar phantoms (Media 1). Scale bars equal 1 mm.
Table 1.
Velocities of Elastic Waves in Agar Phantoms
In the cornea experiments, two groups of ex vivo rabbit corneas (Pel-Freez Arkansas LLC) are used. One is with young cornea samples (N = 3) with ages of 8–12 months, and the other is with mature cornea samples (N = 3) with ages of 1–3 years. The refractive index of the corneas is assumed to be 1.3771. During the experiments, the relative position of the air-puff port and the corneas is kept consistent, with typical 3D OCT images shown in Fig. 4. The distance between the port tip and the cornea top surface is around 350 μm. The angle of delivery is about 30° with respect to the surface normal, and the source pressure is set as 13.8 kPa. Based on the characteristics of this air-puff loading device [14], the estimated pressure of the excitation on the cornea surface is ~1.3 Pa. For corneas, we use elastic wave to describe the observed mechanical corneal response that strictly is not shear wave, due to the complex boundary condition [10].
Fig. 4.

3-D OCT structural images of sample setup. Scale of the images: x, 7.35 mm; y, 0.91 mm; z, 1.18 mm.
The reconstructed typical elastic wave propagation in cornea with a 25 kHz frame rate is shown in Fig. 5 (Media 2). It can be seen that, similar to the wave propagation in phantoms, when the center part of the cornea starts to deform, both sides of the cornea simultaneously show positive displacement. With wave propagation, this upward movement damps to zero and the position starts the negative deformation as the elastic wave arrives at this point. We believe our result shows the first 2D ultra-high-speed observation of the elastic wave in cornea, which might be important for improving our understanding of corneal biomechanical response.
Fig. 5.
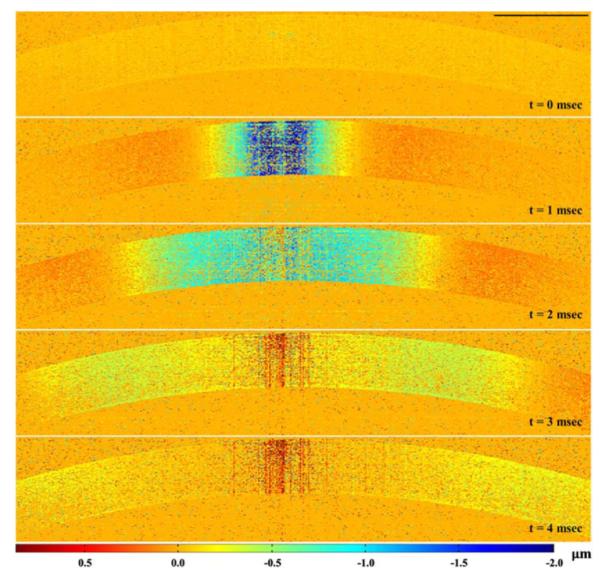
Visualization of the elastic wave propagation in ex vivo rabbit cornea (Media 2); scale bar equals 1 mm.
A comparison of the elastic wave propagation in young and mature corneas is presented in Fig. 6(a) (Media 3). Based on the dotted-line-marks of the excitation positions (red) and the wavefronts (black), at the time of 1.92 ms, it is clear that the propagation of the elastic wave is faster in the mature sample compared with the young one. Quantitative results presented in Fig. 6(b) show that the wave velocities in young and mature corneas are 1.14 ± 0.08 m/s (N = 3) and 1.30 ± 0.10 m/s (N = 3), respectively. These velocity values from healthy animal corneas agree well with the measurements under similar experimental conditions from the literature [15]. Also, the detected increase in wave velocity with age is in accord with our previous age-related studies on in vivo mouse corneas [20]. These results demonstrate the feasibility of SWI-OCT in the high-speed visualization of elastic wave propagation in corneas, and also indicate the possibility of using SWI-OCT for the assessment of corneal elastic properties.
Fig. 6.
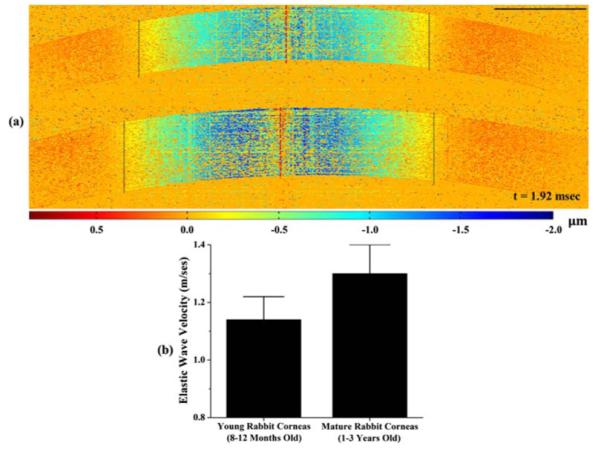
(a) Comparison of the elastic wave propagation in young (top) and mature (bottom) corneas (Media 3); (b) Quantified wave velocities in young and mature corneas; N = 3 for young and mature cornea samples.
From the results of the elastic wave propagation in phantoms and corneas, the remaining positive or negative displacements can be found around the air-puff excitation positions. This is the result of discontinuous artifacts of the signal profiles, caused by the phase unwrapping performed on a relatively large deformation (but still at a micro-level). Although it does not affect observing the wave propagation, advanced unwrapping algorithms will be applied in the reconstruction to remove these artifacts.
In SWI-OCT, air-puff loading is synchronized with the start of each M-mode imaging cycle. This makes the times of the mechanical stimulation equal to the number of the scan positions. For high-resolution observation of the elastic waves, several hundred air-puff excitations are required with this method. However, due to the low excitation pressure (~1.3 Pa), and the short excitation duration (~800 μs) from our air-puff system with 500 times of loading, we did not find any alteration in the structures or shapes of the corneas. However, for future in vivo studies, we will perform further investigations of the safety issues using histological tests and refractive index measurements. The influence of the accuracy and stability of the galvanometer on SWI-OCT detection will also be investigated in our future work.
In conclusion, we present the SWI-OCT method for 2D depth-resolved visualization of low-amplitude elastic wave propagation in tissue, with the frame rate at the A-line acquisition speed. The observations of the propagating elastic waves, induced by an air-puff system in agar phantoms and ex vivo rabbit corneas at 25 kHz frame rate, are presented. Our studies of SWI-OCT on the samples with different mechanical properties indicate that this method can provide a direct and explicit indication of tissue elasticity, which makes it potentially useful for high-resolution corneal elastography.
Acknowledgments
This work was supported by grant 1R01EY022362 from the National Institutes of Health.
Footnotes
OCIS codes: (170.4500) Optical coherence tomography; (120.5050) Phase measurement; (170.4460) Ophthalmic optics and devices.
References
- 1.Shah S, Laiquzzaman M, Bhojwani R, Mantry S, Cunliffe I. Investig. Ophthalmol. Vis. Sci. 2007;48:3026. doi: 10.1167/iovs.04-0694. [DOI] [PubMed] [Google Scholar]
- 2.Paszek MJ, Zahir N, Johnson KR, Lakins JN, Rozenberg GI, Gefen A, Reinhart-King CA, Margulies SS, Dembo M, Boettiger D, Hammer DA, Weaver VM. Cancer Cells. 2005;8:241. doi: 10.1016/j.ccr.2005.08.010. [DOI] [PubMed] [Google Scholar]
- 3.Sarvazyan AP, Rudenko OV, Swanson SD, Fowlkes JB, Emelianov SY. Ultrasound Med. Biol. 1998;24:1419. doi: 10.1016/s0301-5629(98)00110-0. [DOI] [PubMed] [Google Scholar]
- 4.Bercoff J, Tanter M, Fink M. IEEE Trans. Ultrason. Ferroelectr. Freq. Control. 2004;51:396. doi: 10.1109/tuffc.2004.1295425. [DOI] [PubMed] [Google Scholar]
- 5.Muthupillai R, Ehman RL. Nat. Med. 1996;2:601. doi: 10.1038/nm0596-601. [DOI] [PubMed] [Google Scholar]
- 6.J. Schmitt, Opt. Express. 1998;3:199. doi: 10.1364/oe.3.000199. [DOI] [PubMed] [Google Scholar]
- 7.Liang X, Boppart SA. IEEE Trans. Biomed. Eng. 2010;57:953. doi: 10.1109/TBME.2009.2033464. [DOI] [PMC free article] [PubMed] [Google Scholar]
- 8.Li C, Guan G, Cheng X, Huang Z, Wang RK. Opt. Lett. 2012;37:722. doi: 10.1364/OL.37.000722. [DOI] [PubMed] [Google Scholar]
- 9.Youk J, Gweon H, Son E, Chung J, Kim J-A, Kim E-K. Eur. Radiol. 2013;23:1519. doi: 10.1007/s00330-012-2736-3. [DOI] [PubMed] [Google Scholar]
- 10.Tanter M, Touboul D, Gennisson JL, Bercoff J, Fink M. IEEE Trans. Med. Imaging. 2009;28:1881. doi: 10.1109/TMI.2009.2021471. [DOI] [PubMed] [Google Scholar]
- 11.Drexler W, Morgner U, Ghanta RK, Kartner FX, Schuman JS, Fujimoto JG. Nat. Med. 2001;7:502. doi: 10.1038/86589. [DOI] [PMC free article] [PubMed] [Google Scholar]
- 12.Wang RK, Nuttall AL. J. Biomed. Opt. 2010;15:056005. doi: 10.1117/1.3486543. [DOI] [PMC free article] [PubMed] [Google Scholar]
- 13.Wang S, Aglyamov S, Karpiouk A, Li J, Emelianov S, Manns F, Larin KV. Biomed. Opt. Express. 2013;4:2769. doi: 10.1364/BOE.4.002769. [DOI] [PMC free article] [PubMed] [Google Scholar]
- 14.Wang S, Larin KV, Li J, Vantipalli S, Manapuram RK, Aglyamov S, Emelianov S, Twa MD. Laser Phys. Lett. 2013;10:075605. doi: 10.1088/1612-2011/10/7/075605. [DOI] [PMC free article] [PubMed] [Google Scholar]
- 15.Nguyen TM, Aubry JF, Touboul D, Fink M, Gennisson JL, Bercoff J, Tanter M. Investig. Ophthalmol. Vis. Sci. 2012;53:5948. doi: 10.1167/iovs.11-9142. [DOI] [PubMed] [Google Scholar]
- 16.Choma MA, Ellerbee AK, Yang C, Creazzo TL, Izatt JA. Opt. Lett. 2005;30:1162. doi: 10.1364/ol.30.001162. [DOI] [PubMed] [Google Scholar]
- 17.Wang S, Li J, Manapuram RK, Menodiado FM, Ingram DR, Twa MD, Lazar AJ, Lev DC, Pollock RE, Larin KV. Opt. Lett. 2012;37:5184. doi: 10.1364/OL.37.005184. [DOI] [PMC free article] [PubMed] [Google Scholar]
- 18.Sinan L, Heng QY, Cheng W, Zhihong H, Chunhui L, Ruikang W. Biomedical Engineering and Informatics (BMEI), 2011 4th International Conference.2011. pp. 2343–2346. [Google Scholar]
- 19.Li C, Huang Z, Wang RK. Opt. Express. 2011;19:10153. doi: 10.1364/OE.19.010153. [DOI] [PubMed] [Google Scholar]
- 20.Manapuram RK, Aglyamov SR, Monediado FM, Mashiatulla M, Li J, Emelianov SY, Larin KV. J. Biomed. Opt. 2012;17:100501. doi: 10.1117/1.JBO.17.10.100501. [DOI] [PMC free article] [PubMed] [Google Scholar]