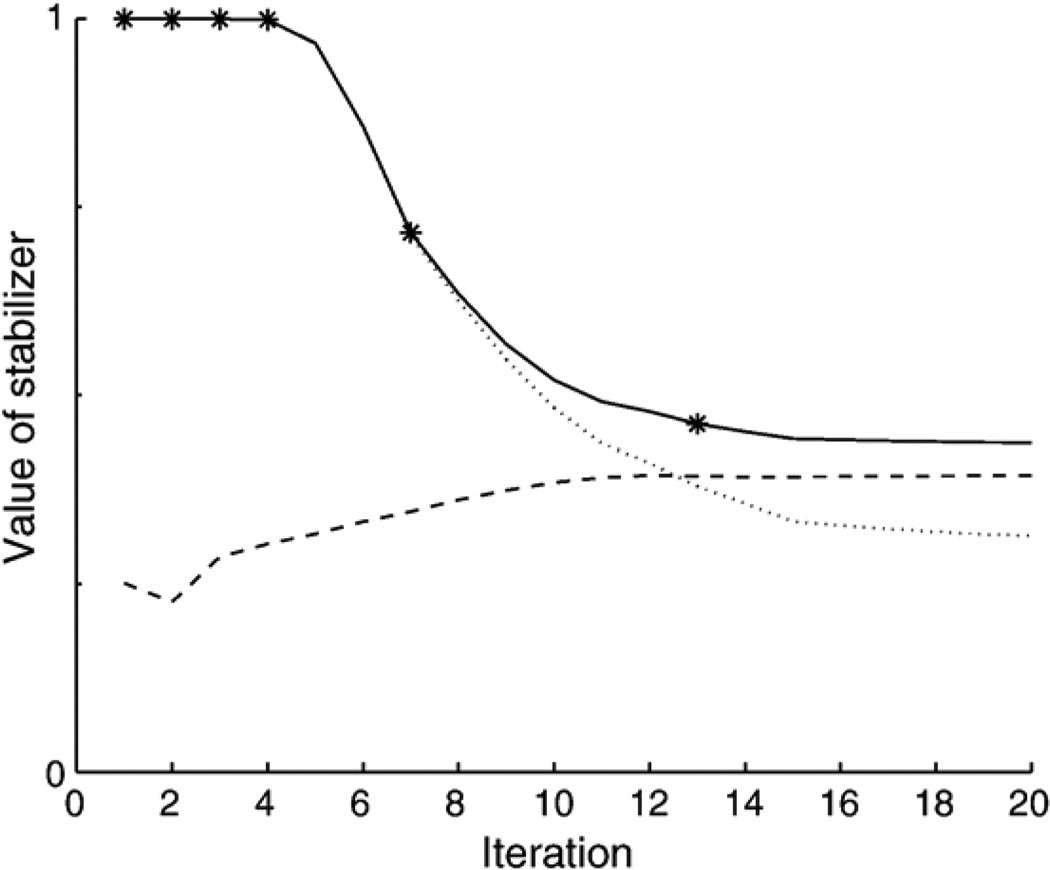
Fig. 6.
Evolution of stabilizers during reweighted iterations. Solid line shows evolution of S, dashes show evolution of αSreg and dots show the evolution of (1−α)Smin. Stars show the stopping point, where term (1−α)Smin becomes less than term αSreg. After that point term αSreg (dashes) dominates, and Scon (solid line) flattens, as illustrated by this figure.

