Abstract
Although physical metrics can objectively characterize computed tomography (CT) image quality, quantitative approaches to predict human observer performance are more accurate and clinically relevant. This study compared a modified channelized Hotelling model observer (CHO) with human observers in a shape discrimination task. Eight lesion-mimicking rods (two contrasts, two sizes and two shapes) were inserted into a 35 × 26 cm torso-shaped water phantom and scanned 100 times on a 128-slice CT scanner at five dose levels. CT images were reconstructed using filtered backprojection (FBP) and iterative reconstruction (IR) techniques. Two-alternative forced choice (2AFC) studies were constructed with hexagonal and circular rod images put side-by-side in a randomized order. An edge mask was introduced to CHO to reflect the human observers’ emphasis on lesion boundaries in discriminating shape. For small size lesions, the performance of three human observers and the modified CHO was highly correlated across lesion contrasts, CT doses and reconstruction algorithms; while for large size lesions, a ceiling effect was observed for both human and model observers’ performance at high doses. Our result suggests the potential of CHO to predict human observer performance for both FBP and IR. For this shape discrimination task with uniform background, IR significantly improved human and model observer performance compared to FBP, with the amount of improvement depending on lesion size, contrast and dose.
Keywords: computed tomography (CT), model observer, channelized Hotelling observer (CHO), human observer, discrimination task, iterative reconstruction (IR)
1. Introduction
Dose reduction techniques, such as image- or sinogram-based denoising methods and iterative reconstruction (IR) algorithms, have been widely investigated to address concerns about radiation dose from CT scans (Thibault et al., 2007; Willemink et al., 2013). Assessing the performance of these algorithms, however, is increasingly challenging. Observer studies performed by interpreting radiologists are the gold standard approach but are costly and extremely labour intensive. Traditional physical metrics, such as the modulation transfer function and contrast-to-noise ratio, provide simpler and more objective ways to assess CT image quality, but correlating these physical measurements with the performance of interpreting radiologists is challenging, given that physical measurements do not take into account information about either the objects or the tasks. More importantly, recent studies have indicated that some traditional physical metrics are inadequate for characterizing IR and other nonlinear noise reduction algorithms (Evans et al., 2011), as well as non-stationary noise in CT systems (Brunner et al., 2012).
A model observer is a mathematical algorithm that makes use of the image data and its statistical properties to make decisions on defined tasks (Barrett et al., 1993). There is growing interest in developing and utilizing model observers to accurately predict human observer performance for image system optimization and comparison. A variety of models, which differ in how much information about signal and noise are used and whether certain properties of the human visual system responses are incorporated, have been proposed and applied to medical image research. These models include the ideal (Bayesian) observer (Myers, 2000), non-prewhitening matched filter (NPW) (Wagner et al., 1979), NPW modified with an eye filter (NPWE) (Burgess, 1994; Richard and Siewerdsen, 2008), and Hotelling observer and channelized Hotelling observer (CHO) (Barrett et al., 1993), to name a few. Some models correlate better with human observer performance than others, depending on the imaging tasks. CHO is a widely used model observer and has been applied to multiple imaging modalities, including x-ray angiography (Zhang et al., 2004), mammography (Chawla et al., 2007), breast tomosynthesis (Chawla et al., 2009), photoacoustic imaging (Petschke and La Riviere, 2013), nuclear medicine (Gifford et al., 2005), and CT (Wunderlich and Noo, 2008). Channelization refers to the process of segregating image data within certain spatial and spatial-frequency channels. Channel profiles have included squares, Laguerre-Gauss polynomials, difference of Gaussian functions, and Gabor elementary functions (Eckstein et al., 2000).
In previous studies, we have investigated the correlation between CHO and human observer performances using real CT images for a lesion detection task in which the lesion location was known exactly (Yu et al., 2013), and a lesion detection and localization task in which the lesion location was uncertain (Leng et al., 2013). In addition to the detection of suspicious lesions, clinical diagnostic tasks also involve classifying lesions into different categories based on their characteristics, such as size, shape, texture and response to contrast medium. Lesion shape often plays an important role in differentiating benign from malignant tumours. For example, polygonal shapes are specific to benign solitary pulmonary nodules seen in CT images (Takashima et al., 2003). The few studies that have used model observers in lesion discrimination tasks (Myers et al., 1990; Burgess et al., 2003; Reiser and Nishikawa, 2006; Abbey et al., 2006; Richard and Siewerdsen, 2008) have all used simulated or hybrid images, and none of them were performed in CT. In addition, studies that have included validation with human observer performance showed a greater discrepancy between human and model observer performance for discrimination tasks than for detection tasks (Reiser and Nishikawa, 2006; Richard and Siewerdsen, 2008).
The goal of this study was therefore, to investigate the correlation between human and model observer performance for a lesion shape discrimination task using real CT images. Physical phantoms with two cross-sectional shapes (hexagonal vs. circular) were scanned at different dose levels and reconstructed with filtered backprojection (FBP) and IR methods. The resulting lesion images were used to construct two-alternative forced choice (2AFC) trials for which the performances of human and model observers were compared.
2. Materials and Methods
2.1. Phantom setup and image acquisition
A 35 × 26 cm torso-shaped water tank was used to simulate the average attenuation of a standard-size adult abdomen (figure 1). Plastic rods made with one of two materials of lexan or acrylic, diameters of 7/16″ (11 mm) or 1/2″ (13 mm), and cross-sectional shapes of circle or hexagon were used to simulate lesions with two contrasts, two sizes and two shapes. Hexagonal rods were manufactured to have the same cross-sectional area as the circular rods. The CT numbers of lexan and acrylic were 105 and 125 HU at 120 kV, respectively. The water tank was filled fully with degassed water to generate uniform background without anatomical structure. Iodine solutions were added to the water to generate approximately 35 HU background, resulting in contrasts of 70 and 90 HU, respectively.
Figure 1.
Phantom setup. A 35 × 26 cm torso-shaped water tank was used to simulate the average attenuation of a standard-size adult abdomen. Plastic rods with circular and hexagonal cross-sectional shapes were “suspended” in the water to simulate lesions. This phantom was scanned with one rod at a time. All rods were placed at the same location in the phantom (arrow).
Rods were attached perpendicularly to an acrylic block placed inside the water tank. This configuration allowed the rods to be “suspended” in the water with their long axes parallel to z-axis of the scanner. To avoid potential correlations among different study conditions, the phantom was scanned with one rod at a time so that background images were statistically independent samples. In addition, rods were carefully placed at the same location inside the phantom to minimize the location-dependent noise variance inherent in the helical scan.
This phantom was scanned on a 128-slice CT scanner (Definition Flash, Siemens Healthcare, Forchheim, Germany) operated in single-source mode. A routine clinical adult abdomen protocol was used with the scanning parameters of 120 kV, 0.5 s rotation time, 0.75 helical pitch and 128 × 0.6 mm collimation (64 × 0.6 mm physical collimation with z flying focal spot technique). Images were acquired at five quality reference mAs levels: 120, 180, 240, 360 and 480 mAs with automatic exposure control (CareDose4D). The corresponding volume CT dose index (CTDIvol) values were 8, 13, 17, 27 and 32 mGy, respectively. All images were reconstructed axially with 5 mm image thickness; a field of view of 100 × 100 mm2 (inplane pixel size = 0.2 × 0.2 mm2) with its centre coinciding with the centre of the rod; and a traditional FBP algorithm with a medium sharp kernel (B40), the same as that used in routine abdomen CT scans. Images were also reconstructed with an IR algorithm available on the scanner (SAFIRE, VA44, Siemens Healthcare) using the kernel with the same sharpness as that of FBP algorithm (I40), and a strength of 3 (on a scale of 1 to 5, with 1 the least amount of noise reduction and 5 the most). Background-only images were also acquired and reconstructed with the same protocol. In order to assess the statistical variability, scans at each condition were repeated 100 times.
2.2. Construction of 2AFC tasks
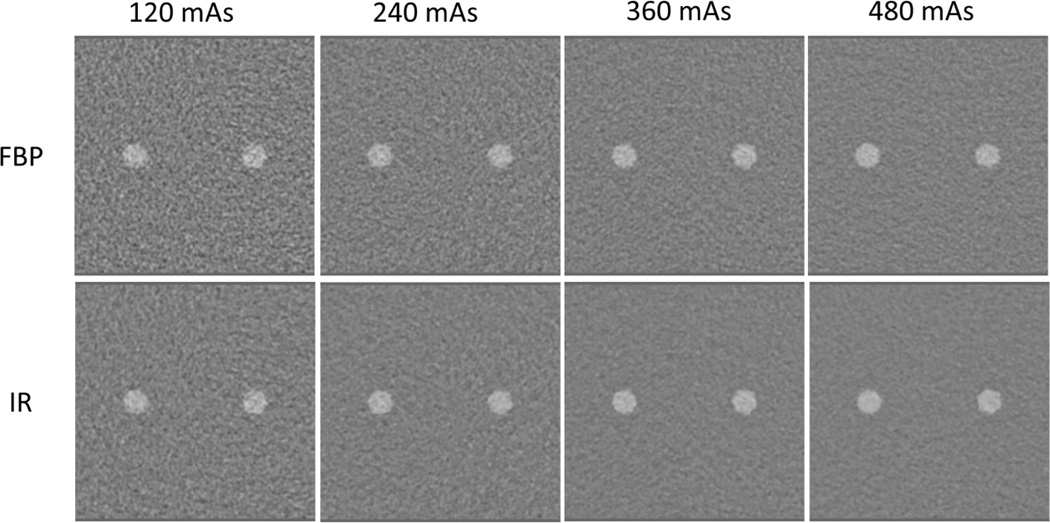
We chose the 2AFC experimental design (Abbey and Eckstein, 2002) for the lesion shape discrimination task. Forty 2AFC studies were generated from the combination of five dose levels, two lesion sizes, two lesion contrasts and two reconstruction algorithms. Each 2AFC study had 100 trials from 100 repeated scans, with each trial consisting of a hexagonal lesion image and a circular lesion image presented side-by-side in a randomized order. As first step towards more complex study design, all lesion images had uniform background without any anatomical structure. Texture background may deteriorate IR performance (Solomon and Samei, 2013). Figure 2 shows sample 2AFC trials of 70 HU contrast, 7/16” lesions at four dose levels for both FBP and IR reconstructions. In total, 4000 2AFC trials were presented to both human and model observers.
Figure 2.
Sample 2AFC trials of 70 HU contrast, 7/16” lesions at four different dose levels for both FBP and IR reconstructions. For the purpose of demonstration, hexagonal lesions were placed on the right side of all images. The window level was 40 HU and the window width was 400 HU.
2.3. Human observer experiments
Three medical physicists were recruited to perform the lesion shape discrimination task. Human observers gained prior knowledge of lesion characteristics through a training set of phantom images, which included 15 images of each lesion shape, size and contrast, for a total of 600 images across two lesion shapes, two sizes, two contrasts and five dose levels. Those training images reflected the morphology of lesions would be expected in the actual study and they were excluded from the subsequent observer study. The human observer study was conducted in a darkened room with illuminance <10 lux and images were displayed on a calibrated monitor following the ACR Technical Standard for Electronic Practice (Norweck et al., 2013). The display window was fixed at window level of 40 HU and window width of 400 HU. The viewing distance was approximately 40–50 cm. A maximal viewing period of 2 hours per session was imposed to avoid fatigue.
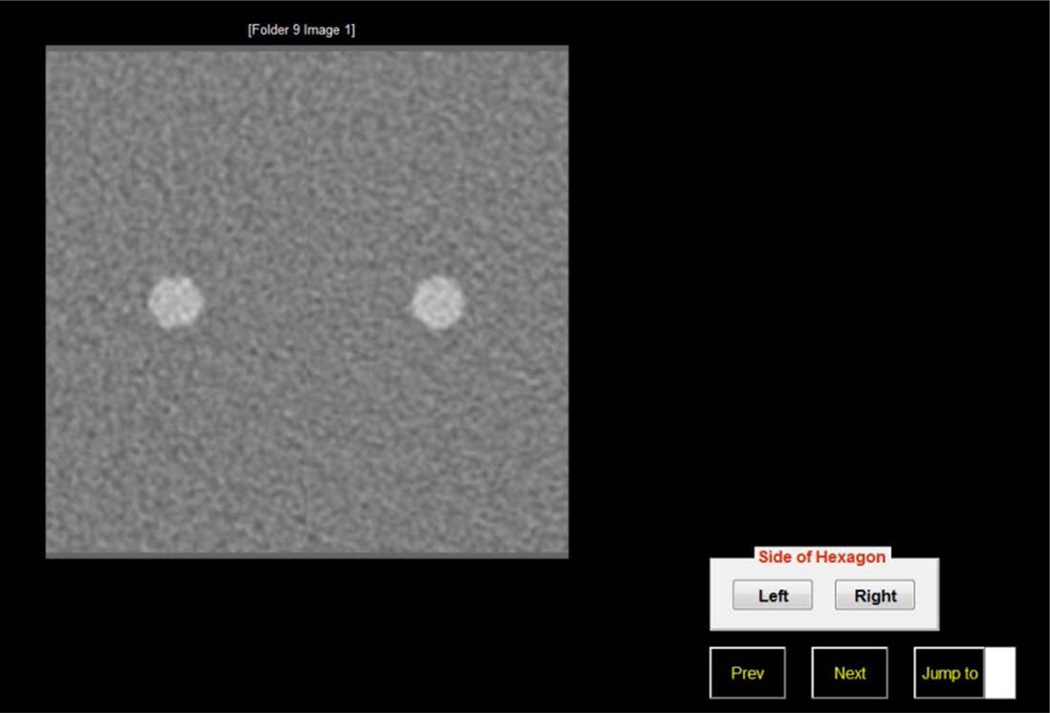
A graphic user interface written in Matlab (Mathworks Inc., Natick, MA) was developed in house to facilitate the human observer study (figure 3). Forty 2AFC studies were presented to human observers in a randomized order, one study at a time, without any identification of the study condition. Within each 2AFC study, the 100 repeated trials were also randomized. Hexagonal and circular lesion images were put side-by-side with noticeable boundary in-between. Backgrounds in these two images were not correlated since they were separate acquisitions. Human observers indicated the side of the hexagon for each 2AFC trial. The percent correct (Pc) for each human observer and each 2AFC study was calculated as the number of correct diagnoses divided by 100 trials.
Figure 3.
The graphic user interface developed in house to facilitate the human observer study. Human observer indicated the side of the hexagon for each 2AFC trial.
2.4. Channelized Hotelling observer
CHO was chosen as the model observer for this study because it models both signal and noise characteristics, and it has been validated in CT lesion detection and localization tasks [(Yu et al., 2013; Leng et al., 2013), also see the Introduction]. As one type of linear observer model, CHO classifies image data into states of truth by forming a scalar decision variable λ for each image. Channelization refers to a mechanism of processing image data through finite spatial and spatial-frequency bands before forming the decision variable (Barrett et al., 1993). The advantages of incorporating a channel mechanism are that 1) it reflects the constraints of the human visual system, and 2) it reduces the dimensionality problem of model computation.
Following the notations in Eckstein (Eckstein et al., 2000), a two-dimensional image i (128 × 128 pixels) can be represented by a vector gi (1282 × 1). For the shape discrimination task herein, ghex represents a hexagonal image and gcir represents a circular image. Images after the channelization process are given as:
where V (1282 × number of channels) is the channel matrix with its jth column representing the channel profile (spatial weighting) for the jth channel. The corresponding decision variable λi is the inner product of the model observer template WCHO and the image after the channelization process gc|i:
The CHO template WCHO is obtained by de-correlating noise prior to the matched template:
where 〈gc|hex〉 and 〈gc|cir〉 represent the hexagonal and circular mean images, respectively, after application of the channels. For the lesion detection task, a matched template is obtained as the difference between the mean signal and mean background. For the shape discrimination task in this study, the difference between the two lesions is the matched template, equivalent to considering one lesion as signal and the other lesion as background in the detection task. Sc is the intraclass scatter matrix (Barrett et al., 1993):
where Kc|hex and Kc|cir are covariance matrices of hexagonal and circular images after the channelization process:
2.5. Gabor channel profile
Individual neurons in the visual cortex are highly selective to drifting grate stimuli with certain spatial bandwidths, locations and orientations (Sachs et al., 1971; Campbell and Maffei, 1970). Early psychophysical studies demonstrated that the measured spatial receptive fields and spatial frequency tuning curves of simple cortical cells of feline and non-human primate models conform closely to the functional forms of two-dimensional Gabor elementary signals (Marcelja, 1980), making the Gabor scheme an attractive option for a channel profile. The general form of the Gabor elementary signal can be expressed as:
where Ws is the channel spatial width, (x0,y0) is the channel centre, fc is the center spatial frequency, θ indicates the channel orientation and ϕ is a phase factor (Gabor, 1946). Any arbitrary function can be expanded in terms of Gabor elementary signals. This study used 60 Gabor elementary signals including six passbands, five orientations and two phases. The six passbands had the same spatial frequency bandwidth of 1 octave (Watson, 1983) with centre frequency fc = 3/128, 3/64, 3/32, 3/16, 3/8 and 3/4 cycles/pixels. The five orientations θ are 0, π/5, 2π/5, 3π/5 and 4π/5, and the two phases ϕ are odd 0 and even π/2. This channel selection is similar to that used in previous studies (Wunderlich and Noo, 2009), except that two high spatial-frequency passbands were added to better preserve the high-frequency information of the lesion edge.
2.6. Edge mask
Human observers utilize available sources of information and combine them in an optimal manner in many visual tasks (Landy and Kojima, 2001). In this lesion shape discrimination task, the majority of discrimination information is constrained in the lesion margin areas, provided that other lesion characteristics, such as contrast, size and location are carefully controlled to be the same for hexagonal and circular lesions for the same 2AFC study. Thus, we hypothesized that human observers would preferentially use information about the lesion edge and modelled this in CHO by introducing an edge mask. The edge mask is a binary mask constructed with 2 concentric circles whose centre also coincides with lesion centres. A value of 1 is assigned to areas between two circle circumferences and 0 is assigned elsewhere. Every image is multiplied by the edge mask prior to its input to CHO so that only lesion margin information is preserved for subsequent CHO processes. The edge mask is implicitly included in the calculations of the CHO template WCHO, intraclass scatter matrix sc and internal noise variable ε (see next section). The non-zero area of the edge mask Areanon−zero is empirically set to be proportional to the lesion cross-sectional area Arealesion:
where Areaouter and Areainner are the areas of the outer and inner circles and are calculated as:
The scaling factor α was empirically calibrated using images of 90 HU contrast, 7/16” lesion diameter acquired with FBP reconstruction across five dose levels. The scaling factor α that generated the minimal root mean square error between the model and average human observer performance was selected and was subsequently used in all other conditions.
2.7. Internal noise
Human observers make different diagnostic decisions on the same set of images over repeated trials. Such inefficiency (variability) is inherent in human perceptual tasks and attributed to internal noise (Burgess and Colborne, 1988). The internal noise component is often included in the model observer so that the performance of model observers and human observers can be compared at the same absolute level. Different strategies for internal noise insertion have been investigated, including insertion at the channel level or at the decision variable. The amount of internal noise can be proportional to a fixed scaling factor or to external noise in images, or it can have a variable magnitude on a trial-to-trial basis (Zhang et al., 2007). A previous study (Burgess and Colborne, 1988) indicated that the dominant internal noise component was directly proportional to the external image noise in performing noise-limited discrimination tasks. Therefore, we inserted internal noise into the decision variable with the amount of internal noise proportional to external noise in images, according to the following equation:
where λi is the decision variable before adding internal noise, λ′i is the decision variable after adding internal noise, β is a scaling factor, and the random variable ε is sampled independently from a normal distribution with zero mean and a standard deviation σ proportional to the decision variable’s coefficient of variation due to the external image noise only; that is
where λbkg is the decision variable from rod-absent, background-only images. The scaling factor β was calibrated under one study condition of 90 HU contrast, 7/16” lesion diameter acquired with FBP reconstruction across five dose levels. The scaling factor β that generated the minimal root mean square error between the model and average human observer performance was selected and subsequently used in all other conditions.
2.8. 2AFC study for CHO
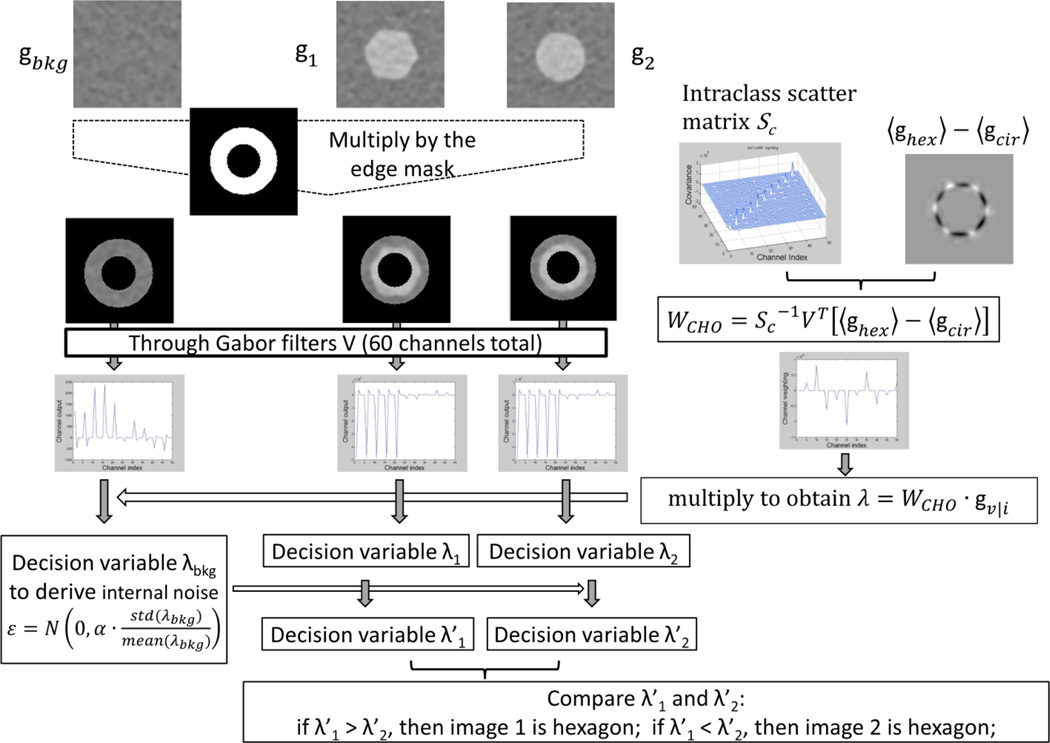
A total of 4000 2AFC trials that were read by human observers were also analyzed with CHO (figure 4). The edge mask was incorporated at the very front end of CHO, before further image processing. For the pair of images 1 and 2 from each 2AFC trial, two corresponding decision variables λ′1 and λ′2 were generated. Because the CHO template was derived by subtracting the mean circular lesion image from the mean hexagonal image, whichever image generated the higher decision variable was designated as the hexagonal lesion image and the other as the circular lesion image. As in the human observer study, Pc for each condition was calculated as the number of correct diagnoses divided by 100 trials. This was used as figure of merit to compare the performance between human and model observers.
Figure 4.
The flow chart illustrates how the modified CHO model makes a decision in a 2AFC trial.
2.9. Statistical analysis
Pc and its confidence interval (CI) were calculated for both human and model observers for each 2AFC condition. All of the human observers read the same images; therefore, a clustering analysis was used to estimate the CI for the human observer performance in order to take the inter-reader correlation into account. The clustering of evaluations (by observers) within images was analysed using the equations for complex survey design where the individual image served as a clustering unit. These equations yielded a zero standard error for instances where there were no incorrect decisions (100% correct by all 3 readers), so to address this issue, an approach was taken where the effective sample size was set to the number of unique images (100). This approach is “conservative” because the sample size was smaller, so the resulting CI was slightly wider while maintaining the same point estimate (100%) for the estimated Pc. The cluster-adjusted CIs were conducted using SAS PROC SURVEYFREC (Cary, NC) using the score (Wilson) CI option. The standard error (SE) was reported, with the mean SE corresponding to the 68% CI.
Our estimation of the CI for CHO performance took into account both the variability associated with internal noise and the variability within 100 sample trials by using a bootstrap analysis. For each 2AFC study, 100 2AFC trials were first inserted with a random internal noise and subsequently bootstrapped to obtain a Pc value. This bootstrap procedure was repeated 1000 times, each with different internal noise realizations, to compute the bootstrap distribution of Pc values, from which the mean and the 68% CI of Pc were calculated.
To visually assess the performance agreement between human and model observers, Pc values from both human and model observers were plotted for five dose levels for each lesion contrast, size and reconstruction algorithm (FBP and IR). Quantitative analysis of the correlation between human and model observers was performed with two-tailed nonparametric Spearman’s rank order correlation, which assesses a monotonic relationship instead of a purely linear relationship. The influence of different reconstruction algorithms on both human and model observer performances was evaluated by using a two-tailed nonparametric Wilcoxon’s signed rank test. For all statistical tests, P values <0.05 was considered statistically significant.
3. Results
3.1. Edge mask
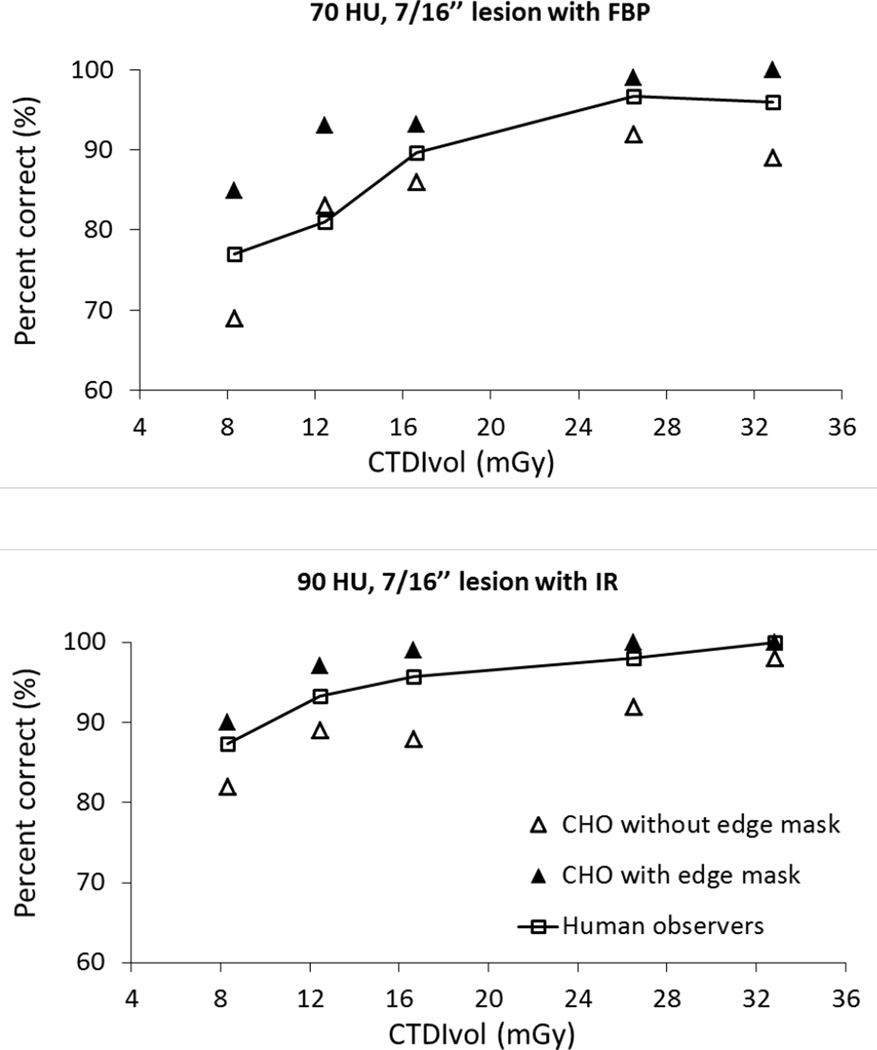
We first assessed the impact of edge mask on CHO performance. Conventional CHO without edge mask performed worse than human observers, as indicated by two representative study conditions: 70 HU contrast, 7/16” lesion with FBP algorithm and 90 HU contrast, 7/16” lesion with IR algorithm (figure 5). Additional internal noise would further degrade the performance of CHO (Eckstein et al., 2000), which leads to a larger discrepancy between human and model observers performance. The incorporation of an edge mask markedly improved the performance of CHO at all dose levels to where it outperformed human observers. Inclusion of internal noise at a subsequent step degraded CHO performance to allow quantitative comparison between human observer and CHO performance.
Figure 5.
Impact of edge mask on CHO performance as demonstrated in two representative study conditions of 70 HU contrast, 7/6” lesion reconstructed with FBP, and 90 HU contrast, 7/16” lesion reconstructed with IR. Conventional CHO without an edge mask performed worse than human observers. The edge mask improved CHO performance.
3.2. Calibration of internal noise
The amount of internal noise insertion was calibrated with images from one representative rod (90 HU contrast, 7/16” lesion) reconstructed with the FBP algorithm. Root mean square error between Pc values of the averaged human observer performance and CHO performance was calculated at different internal noise levels. The scaling factor β that yielded the minimal discrepancy between human and model observers was determined to be 2.5 (figure 6). This value was used for all other study conditions.
Figure 6.
Internal noise calibration was performed by minimizing the root mean square difference between the percent correct from human and modified CHO observers in one study condition (90 HU contrast, 7/16” lesion reconstructed with FBP). The derived scaling factor of 2.5 arbitrary units (a.u.) was used for all other study conditions.
3.3. Performance correlation between human observers and CHO
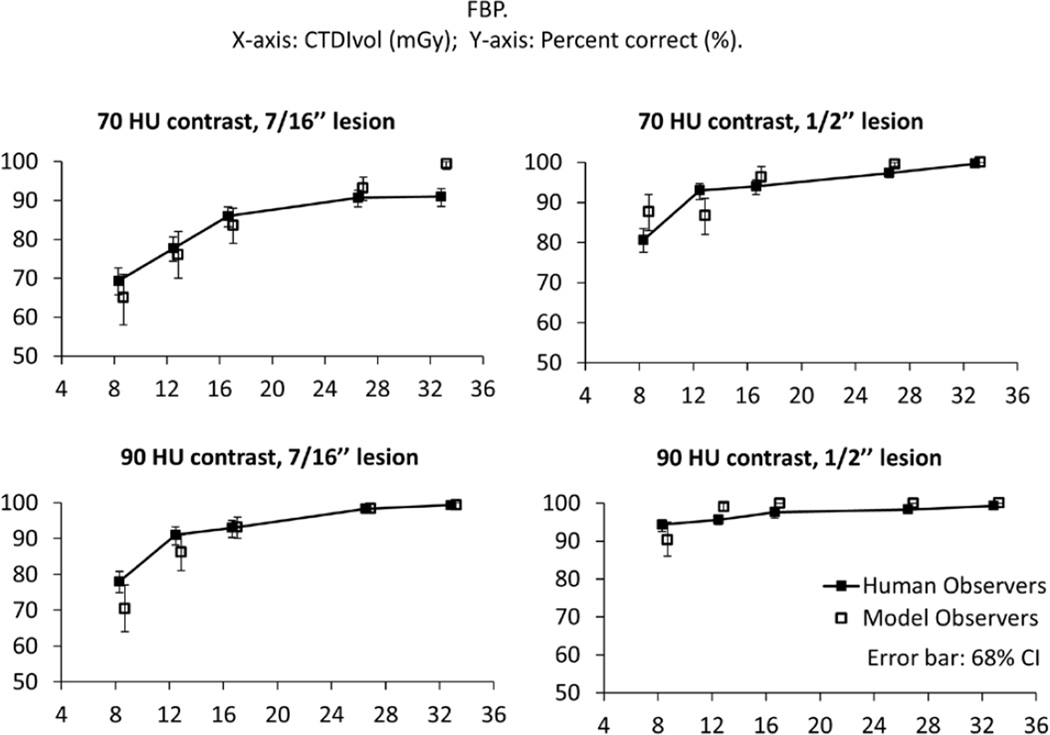
The average performance of human observers and that of CHO at five dose levels for two lesion sizes and lesion contrasts is shown in figure 7. All images were reconstructed with the FBP algorithm. Spearman’s rank correlation coefficients between the human and model observer performances were 0.97 (p < 0.05) for 70 HU contrast, 7/16” lesion; 0.90 (p = 0.08) for 70 HU contrast, 1/2” lesion; 1 (p < 0.05) for 90 HU contrast, 7/16” lesion; and 0.92 (p = 0.1) for 90 HU contrast, 1/2” lesion. The non-significant correlations for 1/2” size lesions are likely due to the fact that Pc from both human and model observers approached 100% even at lower radiation dose levels, so subtle fluctuations in Pc values could result in substantial changes in Spearman’s rank ordering. With FBP, the maximal absolute Pc difference between human and model observer for 7/16” lesion was 7.5%, and for 1/2” lesions was 7.0%. The overall coefficient between human and CHO performances was 0.89 (p < 0.01) across all 20 study conditions with FBP reconstruction.
Figure 7.
Percent correct obtained by human observers (filled squares) and predicted by the modified CHO (empty squares) for each of the 20 2AFC tasks (five dose levels, two lesion sizes, and two lesion contrasts for each observer). All images were reconstructed with FBP.
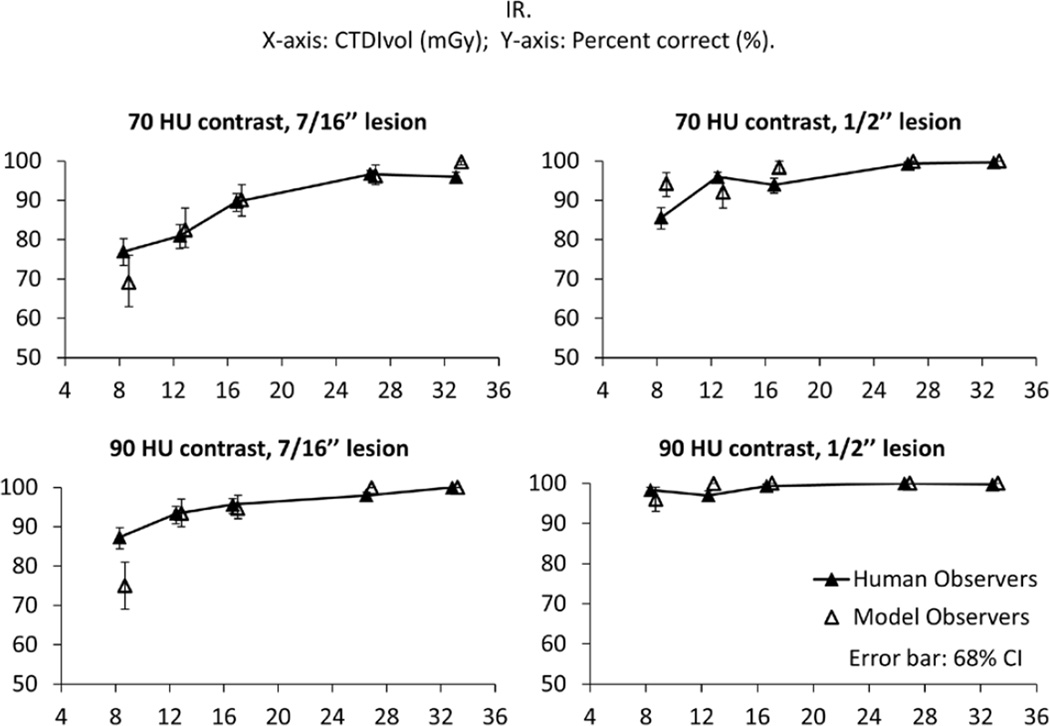
With the use of IR, CHO performance also correlated with human observer performance (figure 8). Spearman’s rank correlation coefficients were 0.9 (p < 0.05) for 70 HU contrast, 7/16” lesion; 0.67 (p = 0.27) for 70 HU contrast, 1/2” lesion; 0.97 (p < 0.05) for 90 HU contrast, 7/16” lesion; and 0.36 (p = 0.8) for 90 HU contrast, 1/2” lesion. Again, relatively low Spearman’s rank correlation coefficients for 1/2” lesions do not necessarily indicate a performance discrepancy but rather that the performance of both human and model observers approached the saturation level. With IR, the maximal absolute Pc difference between human and model observer for 7/16” lesion was 12.4%, and for 1/2” lesions was 8.6%. The overall coefficient between human and CHO performances was 0.86 (p < 0.01) across all 20 study conditions with IR reconstruction.
Figure 8.
Percent correct obtained by human observers (filled triangles) and predicted by the modified CHO (empty triangles) for each of the 20 2AFC tasks. All images were reconstructed with IR.
3.4. Impact of IR on observer performance
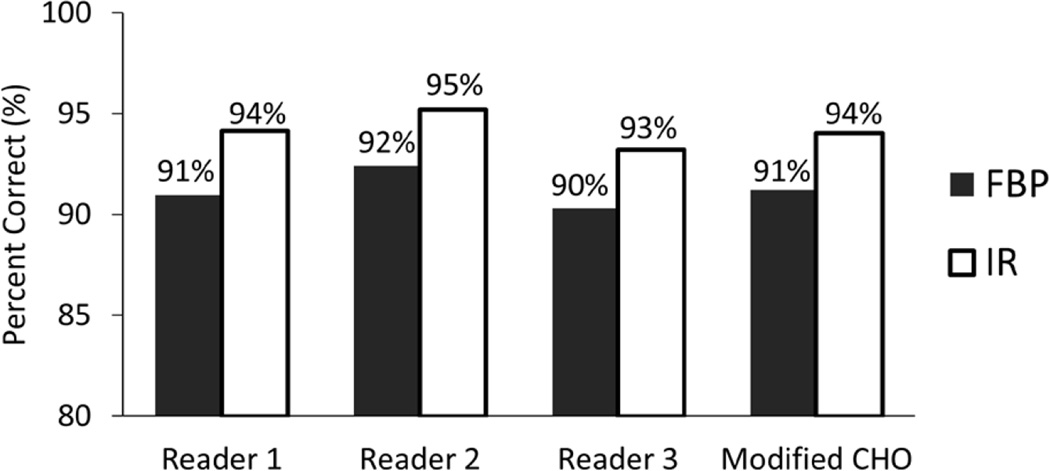
Compared with FBP, IR improved the overall performance of human observers in this shape discrimination task (figure 9). The amount of improvement by IR depended on lesion size, contrast and dose level, with greater improvement achieved for smaller lesion size, lower contrast and lower dose levels. There was substantial improvement at each dose level for the 70 HU contrast, 7/16” lesion. For the 90 HU contrast, 1/2” lesion, the performance with FBP and IR were almost identical, likely because both were close to saturation (Pc = 100%). For the 70 HU contrast, 1/2” lesion and 90 HU contrast, 7/16” lesion, IR improved performance only at lower dose levels. For each human observer, IR significantly improved the overall performance compared to FBP (figure 10), with an absolute increase in Pc values of 3.2%, 2.8% and 2.9% (Wilcoxon’s signed rank test, p < 0.05 for all human observers). This improvement was correctly matched by CHO, which had an absolute increase in Pc values of 2.8% (Wilcoxon’s signed rank test, p < 0.05).
Figure 9.
Percent correct obtained by human observers for images reconstructed with FBP (filled squares) and with IR (filled triangles) for each of the 20 2AFC tasks.
Figure 10.
Mean percent correct values for each of the 3 human observers and the modified CHO for images reconstructed with FBP (filled bars) or IR (empty bars), averaged across all trials.
4. Discussion
Validation of a model observer with human observer performance is necessary before using it for evaluations of imaging systems. Here we examined the correlation between human observers and a modified CHO with an edge mask on a shape discrimination task using real CT images.
Detection and discrimination are two basic forms of the classification task, in which an observer uses images of the object to decide which class the underlying object belongs to (Myers, 2000). Previous studies have all indicated that discrimination tasks involve more complex psychophysical process than detection tasks. Burgess et al (Burgess et al., 2003) reported that the amplitude thresholds were 1.5–2 times larger for discrimination between masses than detection masses with hybrid mammogram images. Similarly, in a study investigating the correlation between human and model observer performances in dual-energy radiography using simulated images, Richard and Siewerdsen (Richard and Siewerdsen, 2008) reported greater discrepancies between human and model observers for the discrimination task than for the detection task. In a shape discrimination task using simulated microcalcification lesions with white noise or mammographic backgrounds, Reiser and Nishikawa (Reiser and Nishikawa, 2006) also reported that an NPWE model was not able to predict human observer performance. We also observed that the existing CHO model failed to predict human observer performance in our shape discrimination study.
The majority of information used to make a discrimination decision comes from the differences between objects, which in this study was the lesion margin. In order to simulate such psychophysical process, we introduced a simple yet novel edge mask at the front end of CHO. This edge mask is binary, with 1 around the edge and 0 otherwise, which preserved the edge information while eliminating the influences from the lesion internal structure. As demonstrated in figure 5, CHO modified with the edge mask utilized the available information better and in a manner closer to that of the human observers than CHO without the edge mask, although it over-performed because no internal noise had been added. The size of the non-zero area in the edge mask was set empirically so that it was proportional to the lesion area. This allows the non-zero area in the edge mask to change with the lesion size.
One potential important application of model observers is to evaluate IR and other nonlinear noise-reduction algorithms, for which traditional physical metrics may not be adequate. This study showed a high performance correlation between human observers and the modified CHO with edge mask for images reconstructed with IR. In addition, IR improved the overall performance over FBP for all human observers, a trend that was correctly matched by the modified CHO. A previous study with a low-contrast (15 HU) lesion detection task did not show that IR improved observer performance significantly (Yu et al., 2013). In addition, a recent study has demonstrated that the noise magnitude of SAFIRE IR algorithm depends highly on background texture, with the largest amount of noise reduction achieved in uniform phantom background (Solomon and Samei, 2013). Those findings indicate the performance of IR can be task-specific. The amount of performance improvement and thus dose reduction that can be achieved by IR will require further investigation for a variety of diagnostic tasks and more realistic lesions and backgrounds.
Although the images used in this study were obtained from actual CT scans, the simplicity of both lesion and background is a potential limitation of this work. Real CT lesions do not have well defined geometry (Megibow et al., 1985). Compared with a background of uniform noise, an anatomical background may improve, degrade or not affect human observer performance for different tasks (Reiser and Nishikawa, 2006; Samei et al., 2000). How much real lesions and anatomical backgrounds affect both human and model observer performances remains an active area of research. Pc values for both human and model observers for 1/2” lesions at high doses were close to one; this ceiling effect limited the sensitivity of those image sets and generalizability of their results. Another limitation is that we used the same sets of images for both human and model observer studies. To assess this inherent performance correlation, we reported the cluster-adjusted confidence interval for human observers and bootstrap confidence interval for CHO. These statistical methodologies took into account the correlations in this multireader, multicase study. Our study is also limited by the fact that we calculated Pc from a simple 2AFC study design instead of performing a full receiver operating characteristic (ROC) analysis. The advantage of Pc is that it makes no assumption about the decision variable distribution (e.g., Gaussian or non-Gaussian), but it does not provide a complete description of performance, as an ROC curve would (Metz, 2000). Finally, only three human observers participated in this study, but the relatively tight CI from the human observer results indicated a low degree of inter-observer variability, and thus the general conclusion of this study should still be valid.
5. Conclusion
In summary, we demonstrated a strong correlation between human observers and a modified CHO with an edge mask on a lesion shape discrimination task using real CT images with both FBP and IR reconstruction methods. Our results suggest the potential ability of CHO to assess CT image quality for optimizing scanning techniques and reducing radiation dose, as a favourable alternative to laborious human observer studies. The improved performance by IR compared to FBP for both human and model observers may also be used to reduce dose while maintaining a similar level of performance, with the amount of dose reduction dependent on lesion contrast and size, and dose level.
Acknowledgements
The authors thank Dr. Matthew Kupinski for his helpful discussions on model observers, Mr. Tom Vrieze for his assistance with phantom preparation and Ms. Amy Nordstrom for her assistance with manuscript preparation. The project described was supported by NIH Grant Number R01 EB017095 from the National Institute of Biomedical Imaging and Bioengineering. The content is solely the responsibility of the authors and does not necessarily represent the official views of the National Institute of Biomedical Imaging and Bioengineering or the National Institutes of Health.”
References
- Abbey CK, Eckstein MP. Classification image analysis: estimation and statistical inference for two-alternative forced-choice experiments. J Vis. 2002;2:66–78. doi: 10.1167/2.1.5. [DOI] [PubMed] [Google Scholar]
- Abbey CK, Zemp RJ, Liu J, Lindfors KK, Insana MF. Observer efficiency in discrimination tasks simulating malignant and benign breast lesions imaged with ultrasound. IEEE Trans Med Imaging. 2006;25:198–209. doi: 10.1109/TMI.2005.862205. [DOI] [PMC free article] [PubMed] [Google Scholar]
- Barrett HH, Yao J, Rolland JP, Myers KJ. Model observers for assessment of image quality. Proc Natl Acad Sci U S A. 1993;90:9758–9765. doi: 10.1073/pnas.90.21.9758. [DOI] [PMC free article] [PubMed] [Google Scholar]
- Brunner CC, Abboud SF, Hoeschen C, Kyprianou IS. Signal detection and location-dependent noise in cone-beam computed tomography using the spatial definition of the Hotelling SNR. Med Phys. 2012;39:3214–3228. doi: 10.1118/1.4718572. [DOI] [PubMed] [Google Scholar]
- Burgess A, Jacobson F, Judy P. Mass discrimination in mammography: experiments using hybrid images. Acad Radiol. 2003;10:1247–1256. doi: 10.1016/s1076-6332(03)00383-0. [DOI] [PubMed] [Google Scholar]
- Burgess AE. Statistically defined backgrounds: performance of a modified nonprewhitening observer model. J Opt Soc Am A Opt Image Sci Vis. 1994;11:1237–1242. doi: 10.1364/josaa.11.001237. [DOI] [PubMed] [Google Scholar]
- Burgess AE, Colborne B. Visual signal detection. IV. Observer inconsistency. J Opt Soc Am A. 1988;5:617–627. doi: 10.1364/josaa.5.000617. [DOI] [PubMed] [Google Scholar]
- Campbell FW, Maffei L. Electrophysiological evidence for the existence of orientation and size detectors in the human visual system. J Physiol. 1970;207:635–652. doi: 10.1113/jphysiol.1970.sp009085. [DOI] [PMC free article] [PubMed] [Google Scholar]
- Chawla AS, Lo JY, Baker JA, Samei E. Optimized image acquisition for breast tomosynthesis in projection and reconstruction space. Med Phys. 2009;36:4859–4869. doi: 10.1118/1.3231814. [DOI] [PMC free article] [PubMed] [Google Scholar]
- Chawla AS, Samei E, Saunders R, Abbey C, Delong D. Effect of dose reduction on the detection of mammographic lesions: a mathematical observer model analysis. Med Phys. 2007;34:3385–3398. doi: 10.1118/1.2756607. [DOI] [PubMed] [Google Scholar]
- Eckstein MP, Abbey CK, Bochud FO. In: Handbook of Medical Imaging, Volume 1: Physics and Psychophysics. Beutel J, et al., editors. Bellingham, WA: Society of Photo-Optical Instrumentation Engineers; 2000. pp. 593–623. [Google Scholar]
- Evans JD, Politte DG, Whiting BR, O'Sullivan JA, Williamson JF. Noise-resolution tradeoffs in x-ray CT imaging: a comparison of penalized alternating minimization and filtered backprojection algorithms. Med Phys. 2011;38:1444–1458. doi: 10.1118/1.3549757. [DOI] [PMC free article] [PubMed] [Google Scholar]
- Gabor D. Theory of communication. Part 1: The analysis of information. Electrical Engineers-Part III: Radio and Communication Engineering, Journal of the Institution of. 1946;93:429–441. [Google Scholar]
- Gifford HC, King MA, Pretorius PH, Wells RG. A comparison of human and model observers in multislice LROC studies. IEEE Trans Med Imaging. 2005;24:160–169. doi: 10.1109/tmi.2004.839362. [DOI] [PubMed] [Google Scholar]
- Landy MS, Kojima H. Ideal cue combination for localizing texture-defined edges. J Opt Soc Am A Opt Image Sci Vis. 2001;18:2307–2320. doi: 10.1364/josaa.18.002307. [DOI] [PubMed] [Google Scholar]
- Leng S, Yu L, Zhang Y, Carter R, Toledano AY, McCollough CH. Correlation between model observer and human observer performance in CT imaging when lesion location is uncertain. Med Phys. 2013;40:081908. doi: 10.1118/1.4812430. [DOI] [PMC free article] [PubMed] [Google Scholar]
- Marcelja S. Mathematical description of the responses of simple cortical cells. J Opt Soc Am. 1980;70:1297–1300. doi: 10.1364/josa.70.001297. [DOI] [PubMed] [Google Scholar]
- Megibow AJ, Balthazar EJ, Hulnick DH, Naidich DP, Bosniak MA. CT evaluation of gastrointestinal leiomyomas and leiomyosarcomas. AJR Am J Roentgenol. 1985;144:727–731. doi: 10.2214/ajr.144.4.727. [DOI] [PubMed] [Google Scholar]
- Metz CE. In: Handbook of Medical Imaging, Volume 1: Physics and Psychophysics. Beutel J, et al., editors. Bellingham, WA: Society of Photo-Optical Instrumentation Engineers; 2000. pp. 752–764. [Google Scholar]
- Myers KJ. In: Handbook of Medical Imaging, Volume 1: Physics and Psychophysics. Beutel J, et al., editors. Bellingham, WA: Society of Photo-Optical Instrumentation Engineers; 2000. pp. 561–587. [Google Scholar]
- Myers KJ, Rolland JP, Barrett HH, Wagner RF. Aperture optimization for emission imaging: effect of a spatially varying background. J Opt Soc Am A. 1990;7:1279–1293. doi: 10.1364/josaa.7.001279. [DOI] [PubMed] [Google Scholar]
- Norweck JT, Seibert JA, Andriole KP, Clunie DA, Curran BH, Flynn MJ, Krupinski E, Lieto RP, Peck DJ, Mian TA. ACR-AAPM-SIIM technical standard for electronic practice of medical imaging. J Digit Imaging. 2013;26:38–52. doi: 10.1007/s10278-012-9522-2. [DOI] [PMC free article] [PubMed] [Google Scholar]
- Petschke A, La Riviere PJ. Comparison of photoacoustic image reconstruction algorithms using the channelized Hotelling observer. J Biomed Opt. 2013;18:26009. doi: 10.1117/1.JBO.18.2.026009. [DOI] [PMC free article] [PubMed] [Google Scholar]
- Reiser I, Nishikawa RM. Identification of simulated microcalcifications in white noise and mammographic backgrounds. Med Phys. 2006;33:2905–2911. doi: 10.1118/1.2210566. [DOI] [PubMed] [Google Scholar]
- Richard S, Siewerdsen JH. Comparison of model and human observer performance for detection and discrimination tasks using dual-energy x-ray images. Med Phys. 2008;35:5043–5053. doi: 10.1118/1.2988161. [DOI] [PMC free article] [PubMed] [Google Scholar]
- Sachs MB, Nachmias J, Robson JG. Spatial-frequency channels in human vision. J Opt Soc Am. 1971;61:1176–1186. doi: 10.1364/josa.61.001176. [DOI] [PubMed] [Google Scholar]
- Samei E, Eyler W, Baron L. In: Handbook of Medical Imaging, Volume 1 : Physics and Psychophysics. Beutel J, et al., editors. Bellingham, WA: Society of Photo-Optical Instrumentation Engineers; 2000. pp. 656–678. [Google Scholar]
- Solomon J, Samei E. Are uniform phantoms sufficient to characterize the performance of iterative reconstruction in CT? Proc. SPIE. 2013;8668 [Google Scholar]
- Takashima S, Sone S, Li F, Maruyama Y, Hasegawa M, Matsushita T, Takayama F, Kadoya M. Small solitary pulmonary nodules (< or =1 cm) detected at population-based CT screening for lung cancer: Reliable high-resolution CT features of benign lesions. AJR Am J Roentgenol. 2003;180:955–964. doi: 10.2214/ajr.180.4.1800955. [DOI] [PubMed] [Google Scholar]
- Thibault JB, Sauer KD, Bouman CA, Hsieh J. A three-dimensional statistical approach to improved image quality for multislice helical CT. Med Phys. 2007;34:4526–4544. doi: 10.1118/1.2789499. [DOI] [PubMed] [Google Scholar]
- Wagner RF, Brown DG, Pastel MS. Application of information theory to the assessment of computed tomography. Med Phys. 1979;6:83–94. doi: 10.1118/1.594559. [DOI] [PubMed] [Google Scholar]
- Watson AB. Detection and recognition of simple spatial forms. Moffett Field, CA: National Aeronautics and Space Administration, Ames Research Center; 1983. [Google Scholar]
- Willemink MJ, de Jong PA, Leiner T, de Heer LM, Nievelstein RA, Budde RP, Schilham AM. Iterative reconstruction techniques for computed tomography Part 1: technical principles. Eur Radiol. 2013;23:1623–1631. doi: 10.1007/s00330-012-2765-y. [DOI] [PubMed] [Google Scholar]
- Wunderlich A, Noo F. Image covariance and lesion detectability in direct fan-beam x-ray computed tomography. Phys Med Biol. 2008;53:2471–2493. doi: 10.1088/0031-9155/53/10/002. [DOI] [PMC free article] [PubMed] [Google Scholar]
- Wunderlich A, Noo F. Estimation of channelized hotelling observer performance with known class means or known difference of class means. IEEE Trans Med Imaging. 2009;28:1198–1207. doi: 10.1109/TMI.2009.2012705. [DOI] [PMC free article] [PubMed] [Google Scholar]
- Yu L, Leng S, Chen L, Kofler JM, Carter RE, McCollough CH. Prediction of human observer performance in a 2-alternative forced choice low-contrast detection task using channelized Hotelling observer: impact of radiation dose and reconstruction algorithms. Med Phys. 2013;40:041908. doi: 10.1118/1.4794498. [DOI] [PMC free article] [PubMed] [Google Scholar]
- Zhang Y, Pham B, Eckstein MP. Evaluation of JPEG 2000 encoder options: human and model observer detection of variable signals in X-ray coronary angiograms. IEEE Trans Med Imaging. 2004;23:613–632. doi: 10.1109/tmi.2004.826359. [DOI] [PubMed] [Google Scholar]
- Zhang Y, Pham BT, Eckstein MP. Evaluation of internal noise methods for Hotelling observer models. Med Phys. 2007;34:3312–3322. doi: 10.1118/1.2756603. [DOI] [PubMed] [Google Scholar]


