

Abstract
Quantitative real time PCR (RT-qPCR) has emerged as an accurate and sensitive method to measure the gene expression. However, obtaining reliable result depends on the selection of reference genes which normalize differences among samples. In this study, we assessed the expression stability of seven reference genes, namely, ubiquitin-protein ligase UBC9 (UBC), tubulin alpha-5 (TUBLIN), eukaryotic translation initiation factor (EIF-5A), translation elongation factor EF1A (EF1α), translation elongation factor EF1B (EF1b), actin11 (ACTIN), and histone H3 (HIS), in Iris. lactea var. chinensis (I. lactea var. chinensis) root when the plants were subjected to cadmium (Cd), lead (Pb), and salt stress conditions. All seven reference genes showed a relatively wide range of threshold cycles (C t) values in different samples. GeNorm and NormFinder algorithms were used to assess the suitable reference genes. The results from the two software units showed that EIF-5A and UBC were the most stable reference genes across all of the tested samples, while TUBLIN was unsuitable as internal controls. I. lactea var. chinensis is tolerant to Cd, Pb, and salt. Our results will benefit future research on gene expression in response to the three abiotic stresses.
1. Introduction
Quantitative real time PCR (RT-qPCR) is a powerful technique to evaluate the quantification of target gene expression. It has advantages of high sensitivity, outstanding accuracy, and broad dynamic range compared with Northern blotting and reverse transcription PCR (RT-PCR) [1]. Nevertheless, it is necessary to use reliable reference gene(s) to normalize the relative expression of target genes. However, the expression of reference gene(s) was not stable under many conditions, which may lead to erroneous normalization [2–4]. As far as is known, many studies have been carried out to select stable reference genes in plants [5, 6].
Cd and Pb are two important heavy metal pollutants which have high toxicity to living beings [7, 8], and salinity is one of the major abiotic stresses which limit the yield of major crops [9]. A number of attempts for reference gene validation have been reported under heavy metal stress in Arabidopsis thaliana [10], soybean [11], cucumber [12], citus [2], and poplar [13] and under salt stress in potato [4], rice [14], tobacco [15], cucumber [16], and Brachypodium distachyon [17]. I. lactea var. chinensis is a perennial ornamental plant, having potential application in phytoremediation of Cd and Pb [7, 18]. Moreover it is a promising halophyte for the improvement of saline land [9]. To further elucidate the excellent characteristic, more studies are needed to analyze the expression of functional genes and transcription factors under these three abiotic stresses. However, previously studies showed that no single reference gene can be used under various experiment stresses [4, 19, 20]. Thus, it is necessary to identify a set of stable reference genes in I. lactea var. chinensis under these three stress conditions.
In this study, we used RT-qPCR to examine expression variations of seven candidate reference genes. Then, we compared their stabilities across a large set of I. lactea var. chinensis samples representing Cd, Pb, and salt stress treatments using GeNorm and NormFinder software units. This work will benefit future gene expression analysis in I. lactea var. chinensis.
2. Materials and Methods
2.1. Plant Materials and Treatments
10 cm height I. lactea var. chinensis plants grown in the 1/2 Hoagland nutrient solution at Iris Resource Collection Garden of Institute of Botany, Nanjing Sun Yat-Sen Memorial Botanical Garden, were selected and transferred into 500 mL plastic pots for hydroponic cultivation [7]. After two weeks, the uniform and healthy seedings were used to examine the gene expression patterns under different treatments. For Cd, Pb, or salt treatment, the plants were transferred to pots containing nutrient solution added with 80 mg/L CdCl2 [18], or 10 mM Pb(NO3)2 [7], or 100 mM NaCl stress [9], kept in the same growth pots for designated time (0, 1, 3, 6, 12, and 24 h). The roots were harvested after three treatments. After harvesting, the roots were frozen immediately in liquid nitrogen and stored at −80°C until use for RNA extraction.
2.2. RNA Extraction and cDNA Synthesis
Frozen roots were ground in liquid nitrogen using a mortar and a pestle. Total RNA was extracted using the RNAiso reagent (TaKaRa) according to the manufacturer's instructions. Potentially contaminating DNA was eliminated from total RNA with RNase-free DNaseI (TaKaRa). Only RNA samples with an optical density absorption ratio A260/A280 of 1.8–2.0 and an A260/A230 ratio >2.0 were used for subsequent analysis [21]. RNA purity was assessed on a BioPhotometer D30 (Eppendorf) [22]. First-strand cDNA was synthesized with the M-MLV (RNase H−) (TaKaRa, Japan) and oligo-dT primers.
2.3. Primer Design
The first important step in RT-qPCR reference gene selection is to select an initial set of candidate reference genes. Seven genes that were commonly used as stable reference genes in abiotic stresses were chosen [2, 19, 23] (Table 1). Primers were designed using Primer Premier v5.0 software (Premier Biosoft International) with melting temperatures (T m) of 83.3–90.5°C, primer lengths of 20–22 bp, and amplicon lengths of approximately 110–224 bp (Table 2). Specificity of the amplification product was tested by qPCR. The expected size of the primer amplicons was further verified by agarose gel electrophoresis. Amplicon purity was assumed where a single melting peak was produced.
Table 1.
Description of Iris. lactea var. chinensis reference genes for RT-qPCR.
| Genea | NCBI accession number | Arabidopsis ortholog locusb | Arabidopsis locus description |
|---|---|---|---|
| UBC | EX953716 | AT4g27960 | Ubiquitin-protein ligase UBC9 |
| TUBLIN | EX954248 | AT5G19780 | Tubulin alpha-5 |
| EIF-5A | EX954588 | AT1G69410 | Eukaryotic translation initiation factor |
| EF1α | EX950257 | AT5G60390 | Translation elongation factor EF1A |
| EF1b | AB907790 | AT2G18110 | Translation elongation factor EF1B |
| ACTIN | EX952640 | AT3G12110 | ACT11 |
| HIS | FD387291 | AT4G40040 | Histone H3 |
aAll genes were named on the basis of similarity to Arabidopsis proteins determined via BLASTX.
bClosest Arabidopsis homolog identified using TAIR BLAST (http://www.arabidopsis.org/Blast/index.jsp).
Table 2.
Primer sequences and amplicon characteristics for each of the seven reference genes.
| Name | Primer sequence (forward/reverse primer) | Size (bp) | T m (°C) | E (%) | R 2 |
|---|---|---|---|---|---|
| UBC | 5′-TCTCGCTTGTCCGGTTTGTG-3′ | 224 | 88.0 | 1.965 | 0.9993 |
| 5′-ACCTTGGGTGGCTTGAATGG-3′ | |||||
| TUBLIN | 5′-TTACCGTCAACTATTCCACCCA-3′ | 214 | 87 | 1.905 | 0.9991 |
| 5′-CAGCAACGAACCCAAACCAGAT-3′ | |||||
| EIF-5A | 5′-GGATGAGGAGCACCACTTCG-3′ | 110 | 90.5 | 1.912 | 0.9997 |
| 5′-GGCGGTTCTTGATGACGATG-3′ | |||||
| EF1α | 5′-CCATTTCTGGATTTGAGGGTGA-3′ | 133 | 86.5 | 2.016 | 0.9958 |
| 5′-AGTCGAAGAGGCTTGTCGGTAG-3′ | |||||
| EF1b | 5′-ATCTTCTGACCAGGAGTTACAT-3′ | 115 | 83.3 | 2.006 | 0.9997 |
| 5′-TACCACCTAGCAACATTGAC-3′ | |||||
| ACTIN | 5′-CTCAACCCGAAGGCAAACAGAG-3′ | 216 | 87.0 | 1.966 | 0.9994 |
| 5′-CGCAAGGTCCAGACGGAGAATA-3′ | |||||
| HIS | 5′-GGCTCGTACCAAGCAAACTG-3′ | 134 | 89.4 | 1.929 | 0.9993 |
| 5′-TTCCAGGACGGTAACGATGA-3′ |
2.4. RT-qPCR
The RT-qPCR reactions were run on a Mastercycler ep realplex real-time PCR system (Eppendorf, http://www.eppendorf.com/) with SYBR Premix Ex Taq II (Perfect Real Time) (TAKARA). Each reaction was performed in 20 μL mix containing 50 ng of each cDNA, 200 nM of each primer, and 10 μL SYBR Premix. The following amplification program was used: initial denaturation 95°C for 120 s, then 40 cycles of 95°C at 15 seconds, 55°C at 15 seconds, and 72°C at 20 seconds. Melting curves were recorded after cycle 40 by heating from 60 to 95°C at a rate of 0.5°C s−1. Each RT-qPCR was run in triplicate, and mean C t values were calculated. Reverse transcription negative control was also included for each primer pair.
2.5. Statistical Analysis
PCR efficiency was calculated from amplification plots using the LinRegPCR program [24]. The quantification cycle values were converted into relative quantities via the delta-Cq method [25]. Two statistical approaches were used to determine the stability of the candidate samples: GeNorm software [26] and NormFinder software[27].
3. Results
3.1. Performance of the Primers and C t Value Analysis
A total of seven genes, including UBC, TUBLIN, EIF-5A, EF1α, EF1b, ACTIN, and HIS, were selected as reference gene candidates. A single band in gel electrophoresis and a single peak in melt curve indicated the expected amplicons. As shown in Table 2, the correlation coefficients (R 2) ranged in value between 0.9958 and 0.9997, and PCR amplification efficiencies between 1.905 and 2.016. The two results were from the LinRegPCR program [24].
In our study, C t values of the seven reference genes showed a relatively wide range from 18.01 to 28.67 in tested samples (Figure 1). The least abundant transcripts were HIS and EF1b with C t values of 28.67 and 27.46, respectively. However, EIF-5A presented the highest transcriptional level and the lowest C t value of 18.01. The average C t value of the selected genes was about 23.82. The coefficient of variation of EF1α was smallest (6.24), while the coefficient of variation of TUBLIN was the largest (7.64).
Figure 1.
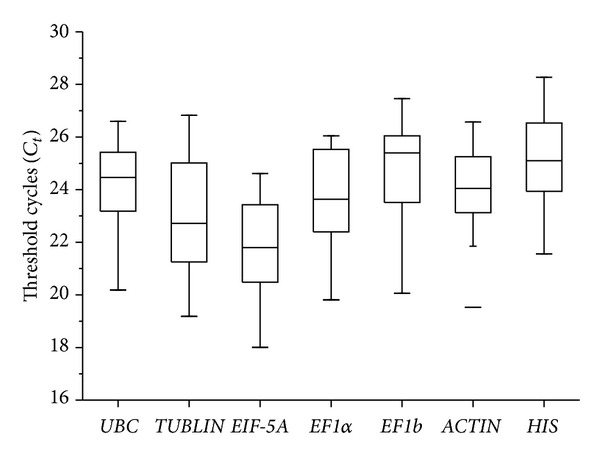
Absolute cycle threshold values (C t) for seven reference genes. Boxes indicate the 25th/75th percentiles, the line marks the median, squares represent the means, and whiskers indicate the ranges for total samples.
3.2. The Stability of Reference Genes
In our study, two methods were selected to analyze the stability of seven reference genes. GeNorm calculates M (average expression stability) for the identification of the most suitable reference gene(s) and V (average pairwise variation) to define the optimal number of genes that should be used. On the basis of M, a lower M value indicates more stable genes. Genes which had M values more than 1.5 indicated the need for additional reference gene(s) [22]. The ranking order according to the M value was showed in Figure 2. The M values for all genes were below 1.5. For total samples, UBC and HIS were the most stably expressed genes with an M value of 0.524. ACTIN and TUBLIN were the least stable genes (Figure 2(a)). In different samples across Cd treatment, UBC and EF1b performed well with an M value of 0.149, while EF1α and TUBLIN have relative high M value (Figure 2(b)). For NaCl treatment, UBC and HIS were the most highly ranked with an M value of 0.278. EF1α and TUBLIN were the least stable genes like under NaCl treatment (Figure 2(c)). For Pb treatment, UBC and HIS showed the lowest M value of 0.506 and ACTIN was the highest with an M value of 0.894 (Figure 2(d)). Vandesompele defined V (the pairwise variation V n/V n+1) to choose the optimal number of reference genes [26]. As showed in Figure 3, three groups of samples, that is, total samples, Cd stress treatment samples, and Pb stress treatment samples, showed higher V2/3 value more than 0.15 (Figure 3). Thus, three reference genes in Cd stress and four reference genes in total and Pb stress were necessary to obtain accurate results in gene expression normalization.
Figure 2.
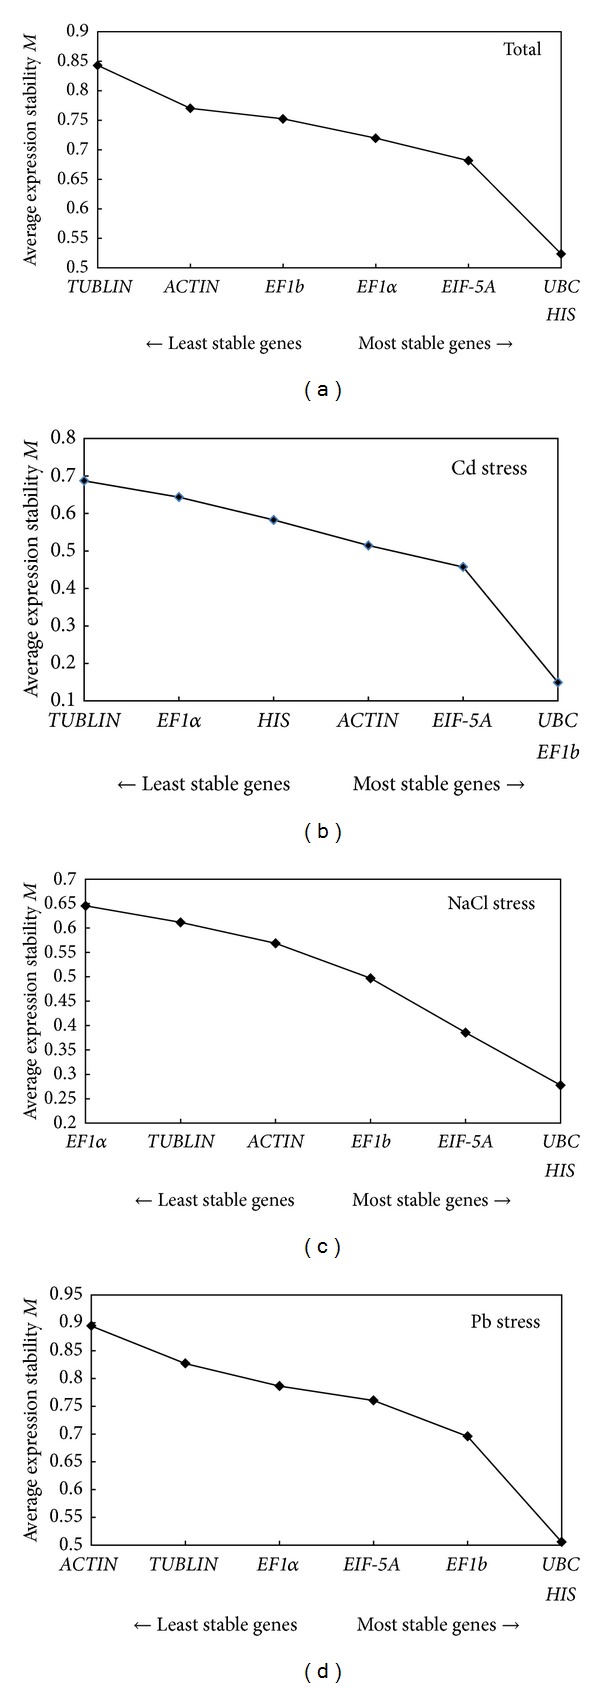
Average expression stability values of control genes by GeNorm analysis: (a) all stresses combined; (b) Cd stress exposure; (c) NaCl stress exposure; (d) Pb sress exposure. The least stable genes are on the left, and the most stable on the right.
Figure 3.
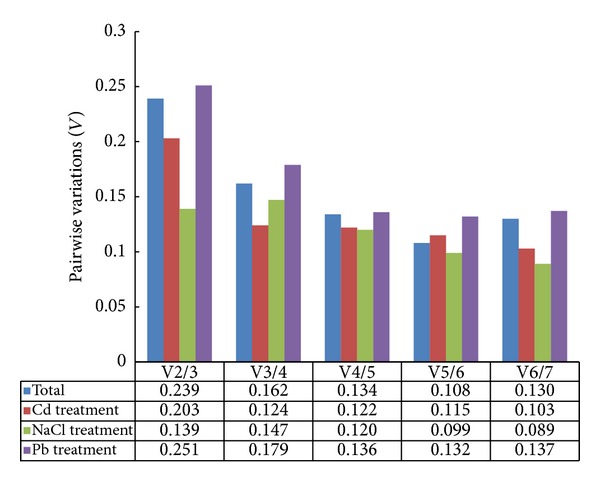
Determination of the optimal number of reference genes by GeNorm analysis.
GeNorm and NormFinder were developed based on a different strategy. Each one has its own advantages and disadvantages [19]. To further confirm the result obtained by the GeNorm software, we further analyzed using NormFinder software, an algorithm which depends on a statistical and mathematical model that estimates the overall expression variation of a set of candidates to identify the optimal normalization gene [21, 27]. Results indicated that the most unstable gene in total, Cd stress, NaCl stress, and Pb stress, was consistent with the GeNorm analysis (Table 3). EIF-5A ranked as the most stable gene in total (stability value = 0.295) and Cd stress (stability value = 0.084). His was optimal with a stability value of 0.194 the NaCl treatment. During the Pb stress, UBC ranked in the top in NormFinder analysis.
Table 3.
Ranking of seven reference genes in order of their expression stability calculated by NormFinder.
| Ranking order | Total | Cd | NaCl | Pb | ||||
|---|---|---|---|---|---|---|---|---|
| Gene | Stability | Gene | Stability | Gene | Stability | Gene | Stability | |
| 1 | EIF-5A | 0.295 | EIF-5A | 0.084 | HIS | 0.194 | UBC | 0.263 |
| 2 | UBC | 0.308 | ACTIN | 0.296 | UBC | 0.225 | EIF-5A | 0.332 |
| 3 | EF1α | 0.374 | UBC | 0.310 | ACTIN | 0.308 | EF1b | 0.364 |
| 4 | EF1b | 0.379 | EF1α | 0.366 | EIF-5A | 0.342 | HIS | 0.396 |
| 5 | ACTIN | 0.448 | EF1b | 0.367 | TUBLIN | 0.367 | EF1α | 0.446 |
| 6 | HIS | 0.450 | HIS | 0.442 | EF1b | 0.371 | TUBLIN | 0.599 |
| 7 | TUBLIN | 0.613 | TUBLIN | 0.480 | EF1α | 0.411 | ACTIN | 0.643 |
4. Discussion
Many studies have been performed to evaluate and select reliable reference genes in a number of plants, such as in cotton subjected to salt and drought stress [19], in Lycium barbarum L. under different development stages [28], in chrysanthemum during aphid infestation, heat stress, or waterlogging stress [22], in spathe tissue of Anthurium andraeanum [29], and in Coffea arabica during nitrogen starvation, salt, and heat stress [30]. Here, we have found that seven candidate reference genes performed differently upon three stresses to which I. lactea var. chinensis plants were subjected.
Two commonly used algorithms (GeNorm and NormFinder) were used to evaluate and identify reference genes. The GeNorm analysis may be biased by the coregulation, since they will show a lower level of pairwise variation than independently regulated genes and occupy closed positions in the ranking coregulated genes [15, 26]. However, NormFinder could be more effective in avoiding behavior of gene coregulation because it ranks reference genes according to the intra- and intergroup variation [31, 32]. Our study showed that different gene stability ranking orders were generated by two analysis algorithms. In previous studies, different conclusions were also generated by the two methods such as in Cineraria [33], C. lavandulifolium [34], radish [32], cucumber [16], and flax [35]. Based on our study, EIF-5A and UBC exhibited stable expression patterns for accurate normalization when looking at the expression data in all four series. On the other hand, TUBLIN performed poorly which indicated that it was not consistently expressed and should not be used as reference genes in our experimental setups. In addition, GeNorm results showed that the choice of the reference gene number depends on the experiment conditions (Figure 3).
EIF-5A and UBC were abundantly and constantly transcribed in all of the samples. Indeed, EIF-5A is thought to function in protein synthesis by promoting synthesis of the first peptide bond [36]. UBC is known to be ubiquitin conjugating enzyme [37]. So they remained continuously expressed over the different conditions and showed minimal changes in RNA transcription. The most commonly used reference gene, ACTIN, was not among the more stable genes in our tests. Previously, ACTIN was commonly used as endogenous internal controls to normalize gene expression studies [38]. However, the poor stability of ACTIN was found in potato [4], peach [31], and in cucumber [16]. It may be that the total actin content can vary with development, cell culture conditions, and potentially between cells within tissues [38]. EF1α and EF1b belong to elongation factor-1 gene family. However, EF1α was ranked above EF1b except for NaCl and Pb stress (Table 3). They were not among the best reference genes in our test just as the earlier analyses [10, 32]. This may be that the expression of EF1 can be modulated in situations involving growth restriction, transformation, ageing, and cell death [39]. Compared with EF1α and EF1b, TUBLIN was the least stably expressed gene found. Surprisingly, TUBLIN showed highly stable expression in longan tree [40] and in cucumber [16]. HIS was the most stably expressed gene under NaCl stress, but it was not suitable as the best under three analyses (Table 3). These results suggest that we should choose suitable reference genes according to different species and conditions.
5. Conclusion
To our knowledge, this study is the first systematic analysis for the selection of superior reference genes for qPCR in I. lactea var. chinensis roots under different abiotic (Cd, NaCl, and Pb) stress conditions. Analysis using GeNorm and NormFinder algorithms revealed that EIF-5A and UBC could be considered to be appropriate reference genes for gene expression analysis under different abiotic experiment stress, whereas TUBLIN showed relatively low expression stability. This work will enable accurate and reliable gene expression experiments under different abiotic stress conditions in I. lactea var. chinensis root.
Acknowledgments
The study was supported by the JiangSu Provincial Key LAB Foundation for Plant EX SITU Conservation (no. 201201), the National Natural Science Foundation of China (31301807), and the Science Foundation of JiangSu (BK20130734).
Conflict of Interests
The authors declare that there is no conflict of interests regarding the publication of this paper.
References
- 1.Bustin SA. Absolute quantification of mrna using real-time reverse transcription polymerase chain reaction assays. Journal of Molecular Endocrinology. 2000;25(2):169–193. doi: 10.1677/jme.0.0250169. [DOI] [PubMed] [Google Scholar]
- 2.Mafra V, Kubo KS, Alves-Ferreira M, et al. Reference genes for accurate transcript normalization in citrus genotypes under different experimental conditions. PLoS ONE. 2012;7(2) doi: 10.1371/journal.pone.0031263.e31263 [DOI] [PMC free article] [PubMed] [Google Scholar]
- 3.Matta BP, Bitner-Mathé BC, Alves-Ferreira M. Getting real with real-time qPCR: a case study of reference gene selection for morphological variation in Drosophila melanogaster wings. Development Genes and Evolution. 2011;221(1):49–57. doi: 10.1007/s00427-011-0356-6. [DOI] [PubMed] [Google Scholar]
- 4.Nicot N, Hausman J-F, Hoffmann L, Evers D. Housekeeping gene selection for real-time RT-PCR normalization in potato during biotic and abiotic stress. Journal of Experimental Botany. 2005;56(421):2907–2914. doi: 10.1093/jxb/eri285. [DOI] [PubMed] [Google Scholar]
- 5.Condori J, Nopo-Olazabal C, Medrano G, Medina-Bolivar F. Selection of reference genes for qPCR in hairy root cultures of peanut. BMC Research Notes. 2011;4, article 392 doi: 10.1186/1756-0500-4-392. [DOI] [PMC free article] [PubMed] [Google Scholar]
- 6.Lopez-Pardo R, Ruiz de Galarreta JI, Ritter E. Selection of housekeeping genes for qRT-PCR analysis in potato tubers under cold stress. Molecular Breeding. 2013;31(1):39–45. [Google Scholar]
- 7.Han Y-L, Huang S-Z, Gu J-G, Qiu S, Chen J-M. Tolerance and accumulation of lead by species of Iris L. Ecotoxicology. 2008;17(8):853–859. doi: 10.1007/s10646-008-0248-3. [DOI] [PubMed] [Google Scholar]
- 8.Liu Z, Gu C, Chen F, et al. Heterologous expression of a Nelumbo nucifera phytochelatin synthase gene enhances cadmium tolerance in Arabidopsis thaliana . Applied Biochemistry and Biotechnology. 2012;166(3):722–734. doi: 10.1007/s12010-011-9461-2. [DOI] [PubMed] [Google Scholar]
- 9.Tong H, Gu C, Yuan H, Huang C. Effects of salt stress on the growth, photosynthetic pigments and structure of two halophytes, Iris halophila and I. lactea var. chinensis . Fresenius Environmental Bulletin. 2014;23(1):p. 1. [Google Scholar]
- 10.Remans T, Smeets K, Opdenakker K, Mathijsen D, Vangronsveld J, Cuypers A. Normalisation of real-time RT-PCR gene expression measurements in Arabidopsis thaliana exposed to increased metal concentrations. Planta. 2008;227(6):1343–1349. doi: 10.1007/s00425-008-0706-4. [DOI] [PubMed] [Google Scholar]
- 11.Hu R, Fan C, Li H, Zhang Q, Fu Y-F. Evaluation of putative reference genes for gene expression normalization in soybean by quantitative real-time RT-PCR. BMC Molecular Biology. 2009;10, article 1471:p. 93. doi: 10.1186/1471-2199-10-93. [DOI] [PMC free article] [PubMed] [Google Scholar]
- 12.Migocka M, Papierniak A. Identification of suitable reference genes for studying gene expression in cucumber plants subjected to abiotic stress and growth regulators. Molecular Breeding. 2011;28(3):343–357. [Google Scholar]
- 13.Basa B, Solti Á, Sárvári É, Tamás L. Housekeeping gene selection in poplar plants under Cd-stress: comparative study for real-time PCR normalisation. Functional Plant Biology. 2009;36(12):1079–1087. doi: 10.1071/FP09073. [DOI] [PubMed] [Google Scholar]
- 14.Jain M, Nijhawan A, Tyagi AK, Khurana JP. Validation of housekeeping genes as internal control for studying gene expression in rice by quantitative real-time PCR. Biochemical and Biophysical Research Communications. 2006;345(2):646–651. doi: 10.1016/j.bbrc.2006.04.140. [DOI] [PubMed] [Google Scholar]
- 15.Schmidt GW, Delaney SK. Stable internal reference genes for normalization of real-time RT-PCR in tobacco (Nicotiana tabacum) during development and abiotic stress. Molecular Genetics and Genomics. 2010;283(3):233–241. doi: 10.1007/s00438-010-0511-1. [DOI] [PubMed] [Google Scholar]
- 16.Wan H, Zhao Z, Qian C, Sui Y, Malik AA, Chen J. Selection of appropriate reference genes for gene expression studies by quantitative real-time polymerase chain reaction in cucumber. Analytical Biochemistry. 2010;399(2):257–261. doi: 10.1016/j.ab.2009.12.008. [DOI] [PubMed] [Google Scholar]
- 17.Hong S-Y, Seo PJ, Yang M-S, Xiang F, Park C-M. Exploring valid reference genes for gene expression studies in Brachypodium distachyon by real-time PCR. BMC Plant Biology. 2008;8, article 112 doi: 10.1186/1471-2229-8-112. [DOI] [PMC free article] [PubMed] [Google Scholar]
- 18.Han Y-L, Yuan H-Y, Huang S-Z, Guo Z, Xia B, Gu J. Cadmium tolerance and accumulation by two species of Iris. Ecotoxicology. 2007;16(8):557–563. doi: 10.1007/s10646-007-0162-0. [DOI] [PubMed] [Google Scholar]
- 19.Wang M, Wang Q, Zhang B. Evaluation and selection of reliable reference genes for gene expression under abiotic stress in cotton (Gossypium hirsutum L.) Gene. 2013;530(1):44–50. doi: 10.1016/j.gene.2013.07.084. [DOI] [PubMed] [Google Scholar]
- 20.Chang E, Shi S, Liu J, et al. Selection of reference genes for quantitative gene expression studies in Platycladus orientalis (cupressaceae) using real-time PCR. PLoS ONE. 2012;7(3) doi: 10.1371/journal.pone.0033278.e33278 [DOI] [PMC free article] [PubMed] [Google Scholar]
- 21.Chi X, Hu R, Yang Q, et al. Validation of reference genes for gene expression studies in peanut by quantitative real-time RT-PCR. Molecular Genetics and Genomics. 2012;287(2):167–176. doi: 10.1007/s00438-011-0665-5. [DOI] [PubMed] [Google Scholar]
- 22.Gu C, Chen S, Liu Z, et al. Reference gene selection for quantitative real-time PCR in chrysanthemum subjected to biotic and abiotic stress. Molecular Biotechnology. 2011;49(2):192–197. doi: 10.1007/s12033-011-9394-6. [DOI] [PubMed] [Google Scholar]
- 23.Chen L, Zhong H-Y, Kuang J-F, Li J-G, Lu W-J, Chen J-Y. Validation of reference genes for RT-qPCR studies of gene expression in banana fruit under different experimental conditions. Planta. 2011;234(2):377–390. doi: 10.1007/s00425-011-1410-3. [DOI] [PubMed] [Google Scholar]
- 24.Ramakers C, Ruijter JM, Lekanne Deprez RH, Moorman AFM. Assumption-free analysis of quantitative real-time polymerase chain reaction (PCR) data. Neuroscience Letters. 2003;339(1):62–66. doi: 10.1016/s0304-3940(02)01423-4. [DOI] [PubMed] [Google Scholar]
- 25.Livak KJ, Schmittgen TD. Analysis of relative gene expression data using real-time quantitative PCR and the 2−∆∆CT method. Methods. 2001;25(4):402–408. doi: 10.1006/meth.2001.1262. [DOI] [PubMed] [Google Scholar]
- 26.Vandesompele J, de Preter K, Pattyn F, et al. Accurate normalization of real-time quantitative RT-PCR data by geometric averaging of multiple internal control genes. Genome Biology. 2002;3(7) doi: 10.1186/gb-2002-3-7-research0034.RESEARCH0034 [DOI] [PMC free article] [PubMed] [Google Scholar]
- 27.Andersen CL, Jensen JL, Ørntoft TF. Normalization of real-time quantitative reverse transcription-PCR data: a model-based variance estimation approach to identify genes suited for normalization, applied to bladder and colon cancer data sets. Cancer Research. 2004;64(15):5245–5250. doi: 10.1158/0008-5472.CAN-04-0496. [DOI] [PubMed] [Google Scholar]
- 28.Wang L, Wang Y, Zhou P. Validation of reference genes for quantitative real-time PCR during Chinese wolfberry fruit development. Plant Physiology and Biochemistry. 2013;70:304–310. doi: 10.1016/j.plaphy.2013.05.038. [DOI] [PubMed] [Google Scholar]
- 29.Gopaulchan D, Lennon AM, Umaharan P. Identification of reference genes for expression studies using quantitative RT-PCR in spathe tissue of Anthurium andraeanum (Hort.) Scientia Horticulturae. 2013;153:1–7. [Google Scholar]
- 30.de Carvalho K, Bespalhok Filho JC, dos Santos TB, et al. Nitrogen starvation, salt and heat stress in coffee (Coffea arabica L.): identification and validation of new genes for qPCR normalization. Molecular Biotechnology. 2013;53(3):315–325. doi: 10.1007/s12033-012-9529-4. [DOI] [PubMed] [Google Scholar]
- 31.Tong Z, Gao Z, Wang F, Zhou J, Zhang Z. Selection of reliable reference genes for gene expression studies in peach using real-time PCR. BMC Molecular Biology. 2009;10, article 71 doi: 10.1186/1471-2199-10-71. [DOI] [PMC free article] [PubMed] [Google Scholar]
- 32.Xu Y, Zhu X, Gong Y, Xu L, Wang Y, Liu L. Evaluation of reference genes for gene expression studies in radish (Raphanus sativus L.) using quantitative real-time PCR. Biochemical and Biophysical Research Communications. 2012;424(3):398–403. doi: 10.1016/j.bbrc.2012.06.119. [DOI] [PubMed] [Google Scholar]
- 33.Jin X, Fu J, Dai S, Sun Y, Hong Y. Reference gene selection for qPCR analysis in cineraria developing flowers. Scientia Horticulturae. 2013;153:64–70. [Google Scholar]
- 34.Fu J, Wang Y, Huang H, Zhang C, Dai S. Reference gene selection for RT-qPCR analysis of Chrysanthemum lavandulifolium during its flowering stages. Molecular Breeding. 2013;31(1):205–215. [Google Scholar]
- 35.Huis R, Hawkins S, Neutelings G. Selection of reference genes for quantitative gene expression normalization in flax (Linum usitatissimum L.) BMC Plant Biology. 2010;10(1, article 71) doi: 10.1186/1471-2229-10-71. [DOI] [PMC free article] [PubMed] [Google Scholar]
- 36.Kang HA, Hershey JWB. Effect of initiation factor eIF-5A depletion on protein synthesis and proliferation of Saccharomyces cerevisiae . Journal of Biological Chemistry. 1994;269(6):3934–3940. [PubMed] [Google Scholar]
- 37.Yasugi T, Howley PM. Identification of the structural and functional human homolog of the yeast ubiquitin conjugating enzyme UBC9. Nucleic Acids Research. 1996;24(11):2005–2010. doi: 10.1093/nar/24.11.2005. [DOI] [PMC free article] [PubMed] [Google Scholar]
- 38.Stürzenbaum SR, Kille P. Control genes in quantitative molecular biological techniques: the variability of invariance. Comparative Biochemistry and Physiology B: Biochemistry and Molecular Biology. 2001;130(3):281–289. doi: 10.1016/s1096-4959(01)00440-7. [DOI] [PubMed] [Google Scholar]
- 39.Duttaroy A, Bourbeau D, Wang X-L, Wang E. Apoptosis rate can be accelerated or decelerated by overexpression or reduction of the level of elongation factor-1α . Experimental Cell Research. 1998;238(1):168–176. doi: 10.1006/excr.1997.3819. [DOI] [PubMed] [Google Scholar]
- 40.Lin YL, Lai ZX. Reference gene selection for qPCR analysis during somatic embryogenesis in longan tree. Plant Science. 2010;178(4):359–365. [Google Scholar]