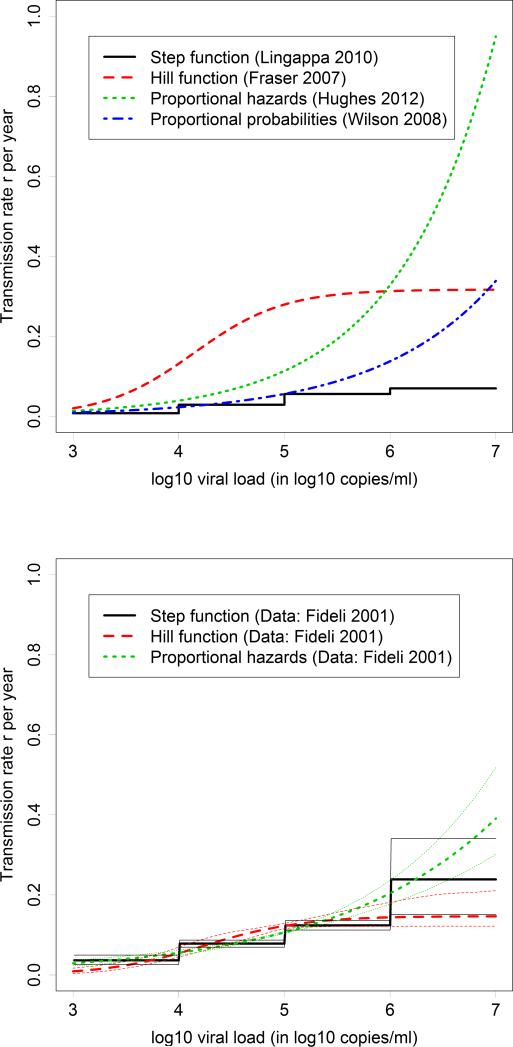
Figure 2. Examples of the four assumed relationships between viral load and transmission rates.
Top panel: The most recent study of each example is presented. Bottom panel: Re-analysis of the data by Fideli et al, which shows that the heterogeneity in transmission risk for lower viral load values is mostly due to different data sources, but for high viral load values the heterogeneity is also due to different assumptions.

