Abstract
Magnetoacoustic tomography with Magnetic Induction (MAT-MI) is a noninvasive electrical conductivity imaging approach that measures ultrasound wave induced by magnetic stimulation, for reconstructing the distribution of electrical impedance in biological tissue. Existing reconstruction algorithms for MAT-MI are based on the assumption that the acoustic properties in the tissue are homogeneous. However, the tissue in most parts of human body, has heterogeneous acoustic properties, which leads to potential distortion and blurring of small buried objects in the impedance images. In the present study, we proposed a new algorithm for MAT-MI to image the impedance distribution in tissues with inhomogeneous acoustic speed distributions. With a computer head model constructed from MR images of a human subject, a series of numerical simulation experiments were conducted. The present results indicate that the inhomogeneous acoustic properties of tissues in terms of speed variation can be incorporated in MAT-MI imaging.
Index Terms: MAT-MI, magnetoacoustic imaging, electrical impedance imaging, bioimpedance, acoustic inhomogeneity
I. Introduction
IMAGING tissue’s electrical properties including conductivity and permittivity have been appreciated in various clinical applications and continue to attract considerable interests in the area of biomedical imaging. It has been reported that electrical properties of biological tissue are sensitive to physiological and pathological conditions.
During the past several decades, a number of noninvasive impedance imaging methods have been developed or under active investigation to estimate the electric conductivity of biological tissues. These include electrical impedance tomography (EIT) [1]–[4], magnetic induction tomography (MIT) [5] and magnetic resonance electrical impedance tomography (MREIT) [6]–[10]. Among these approaches, EIT needs to inject current into the tissue with multiple surface electrodes. The measurements of surface voltages due to injected current are used to reconstruct the impedance distribution of biological tissues. Compared to other tomography methods, EIT has the advantages of low cost, safety and high speed, but is limited in its low spatial resolution and the “shielding effect” [11] caused by low conductive tissue layers. In MIT, an exciting coil is applied to generate a dynamic magnetic field and induce eddy current in the tissue. With the detected magnetic field perturbed by the eddy current, the electromagnetic properties can be reconstructed. This modality addressed the problem of the “shielding effect” but still faced the limitation of low spatial resolution. MREIT was developed by combining EIT and magnetic resonance current density imaging which also requires current injection. In MREIT, a MRI scanner is employed to measure the magnetic flux density induced by injected current. A high spatial resolution electrical conductivity imaging was suggested for brain imaging in simulation [7] [8] and achieved in in vivo experiments [10]. However, the need of high amplitude current injection within a MRI scanner currently limits the clinical applications of MREIT. Besides these electromagnetic imaging methods, alternative modalities such as magnetoacoustic tomography (MAT) [12] [13] and Hall effect imaging (HEI) [11] [14] have also been introduced. These two methods benefit with improved spatial resolution, but still suffer from the “shielding effects” due to the use of surface electrodes for current injection or surface voltage measurements.
In order to avoid this “shielding effect” and achieve high resolution results, magnetoacoustic tomography with magnetic induction (MAT-MI) [15] was proposed, and investigated [16–26] for imaging electrical impedance of biological tissues with using ultrasound measurements. In MAT-MI, a sample is located in a static field and eddy currents are induced in the sample by a time-varying magnetic field. Acoustic vibration is generated due to the Lorentz force. MAT-MI utilizes the measurements of the acoustic pressure around the sample to reconstruct the conductivity distribution.
In the previous work, several MAT-MI algorithms were developed to reconstruct the distribution of acoustic source without considering acoustic speed variations in tissue [15]–[25]. However, this assumption is not tenable in some applications, such as brain imaging, where the acoustic speed variation can be greater than 100%. In these cases, the reconstruction results will be deteriorated by blurring and displacement.
In the present study, we first use ultrasonic transmission tomography (UTT) [27] [28] [29] to quantitatively measure the distribution of acoustic speed in the tissue. A new approach is introduced to reconstruct the distribution of acoustic source and the electrical impedance is then estimated in tissue with inhomogeneous acoustic speed distribution. Numerical simulations, with a human head model, are conducted to evaluate the effectiveness and performance of the proposed method.
II. THEORY
A. Reconstruction of the acoustic speed distribution
In order to solve the acoustic speed distribution problem, we need to measure the arrival time of ultrasonic wave to calculate acoustic speed distribution in the tissue. The travel time from transmitter to transducer can be calculated by Eq. (1) along a ray path [27] [28] [29].
| (1) |
where c(r) is the acoustic speed in the tissue, l(r) is the travel path of ultrasonic wave, and r is the location. This equation is not yet in a form that can be solved by the UTT method, as we also need to measure the flight time T0 of the ultrasonic wave in homogeneous background. Here, we define travel time perturbation δT as:
| (2) |
where c0 is the acoustic speed in homogeneous background, and .
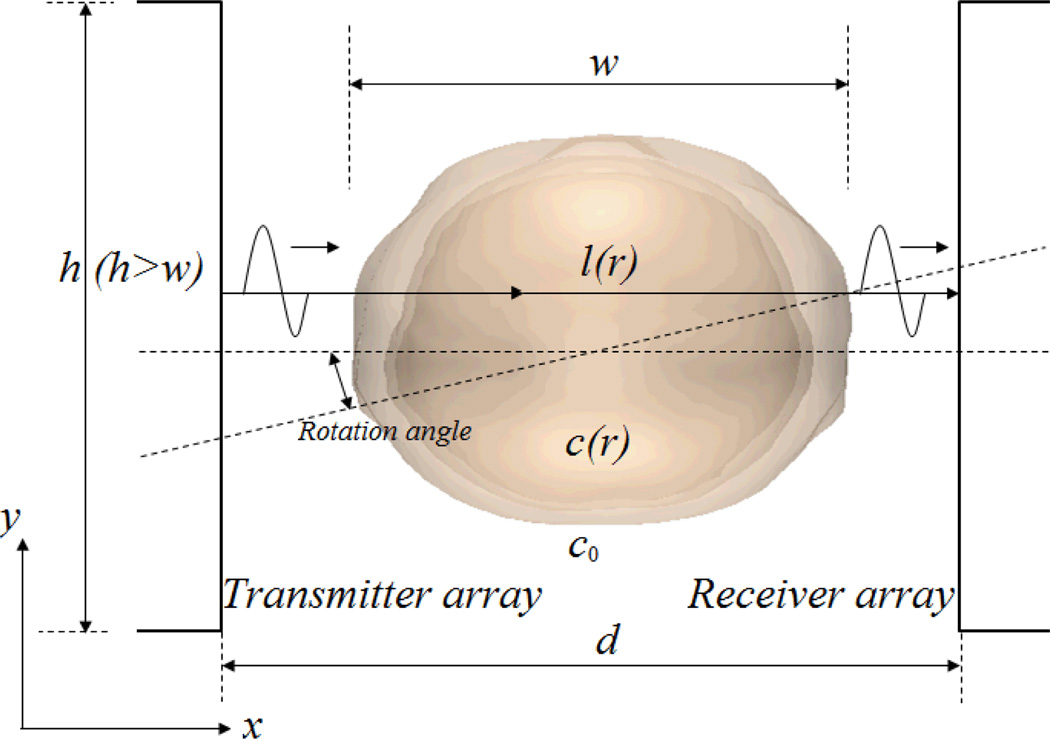
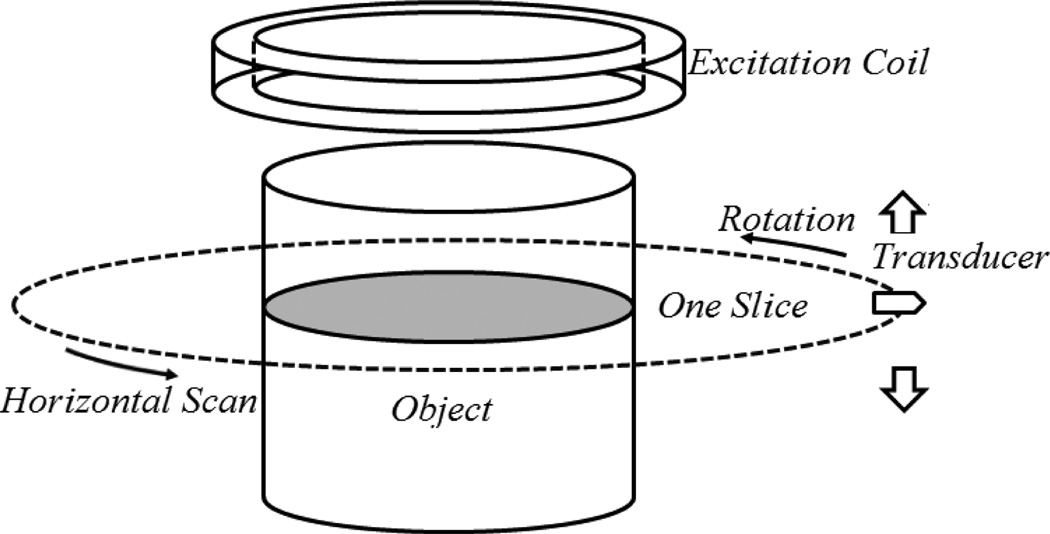
In UTT transmission mode, two transducers are required, one to transmit the ultrasonic pulses and the other on the opposite side of the target to receive them. Fig. 1 shows one possible arrangement which can be rotated horizontally around the z-axis in a water bath. Measurements on the transmitted pulses are made at multiple positions with respect to the tissue, and at multiple angles around it. After measuring the time-of-flight (TOF), we can reconstruct the image of the speed of sound distribution within the target using UTT.
Fig. 1.
The transmission mode of ultrasonic transmission tomography. The transmitter and receiver can be rotated horizontally around the z-axis.
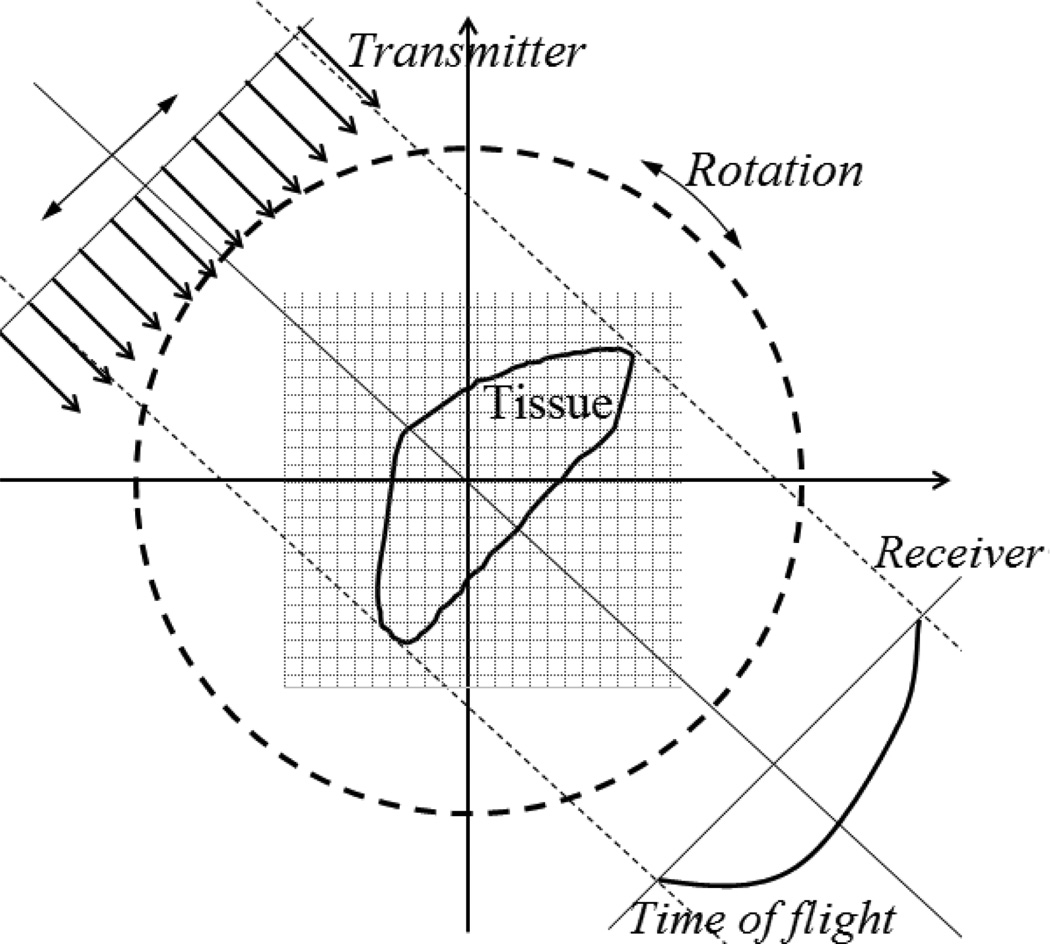
We divided the region of interest (ROI) into n cells as shown in figure 2, and assumed that c(r) in each cell remains constant. For viewing angle i, lij is the length of the path that the acoustic wave transverses though cell j. So the travel time perturbation from transmitter to receiver can be given by:
| (3) |
where cj denotes the acoustic speed in cell j.
Fig. 2.
The region of interest after meshed. Each grid has same size.
Eq. (3) meets requirements of the UTT reconstruction algorithm. By measuring multiple parallel rays across the tissue, and rotating the pairs of transducers, TOF projection data are formed. Using a filtered back-projection method, the reconstruction of acoustic speed distribution can be obtained.
B. Effects of acoustic speed variation on MAT-MI
In regions where changes in density are negligible, the wave equation governing the acoustic pressure in the object is given as:
| (4) |
where Q is the acoustic source in the tissue due to induced Lorentz force and equals to −∇ · (J⃑ (r,t) × B⃑0 (r,t)). J⃑ (r,t) in the source term can further be written as the product of a purely spatial and a purely temporal component, J⃑ (r,t) = J⃑ (r) · η(t), where J⃑ (r) describes the spatial distribution of the eddy current density and η (t) describes the shape of the stimulating pulse. In MAT-MI experiment, we consider only the case that the stimulating pulse is very short η (t) = δ (t) with δ (t) being the Dirac delta function. B⃑0 (r) is the magnetic field in the tissue. c(r) is the velocity of wave propagation and p denotes the acoustic pressure in ROI.
Performing a Fourier transform with respect to t on both hand sides of Eq. (4), we have:
| (5) |
where . Using Green’s function, the solution of Eq. (5) can be written as:
| (6) |
Here p(r,w) is the acoustic pressure, G0 is homogeneous Green’s function. The second term on the right hand side of Eq. (6) is the scattered field, where:
| (7) |
In a lossless propagation medium, f (r0, w) is the scattering function which can be calculated by UTT in one step.
The Green’s function is defined as the response to a point source, hence satisfies a wave equation of the form:
We define the scattering problem as the problem of solving Eq. (6) for acoustic pressure p. By discretizing Eq. (6), we have:
| (8) |
Here N denotes the number of elements in the ROI, Gmn is Green’s function for cell m and cell n. dv is the volume of each cell. P is the acoustic pressure and is an N × 1 vector, which is unknown. In order to derive the vector P, we developed an iterative method as follows:
Step 1. Let P=0, and assume there is no scattered field at the beginning;
Step 2. Solve Eq. (8) in the region of interest with the latest P;
Step 3. Compute P(Step=n+1) from step 2, and replace P(Step=n) by P(Step=n+1);
Step 4. If the relative error between P(Step=n) and P(Step=n+1) is larger than the given tolerance ε, go back to step 2. Otherwise finish the procedure and use the P(Step=n+1) as the final solution.
Also Eq. (8) can be used to calculate the acoustic pressure at observation points, with the size of matrix GN×N and fNGN×N reduced to M × N (M denotes the number of observation points).
C. Inverse Problem
In the inverse problem, the goal is to solve for the vector Q in Eq. 9 which represents the Lorentz force from measurements of the acoustic field at points outside the scattering region.
Assuming there are M receivers around the object, the acoustic pressure signal in observation points can be written as:
| (9) |
Here Pr is the acoustic pressure collected by receivers, Q is the acoustic source caused by Lorentz force and P is the acoustic pressure in ROI. The subscript here denotes the size of the matrix. As we know, Pr is an M × 1 vector. M is the number of receivers and usually is less than the number of the elements. The condition that M < N makes the equation underdetermined and ill-posed. Here we utilized Tikhonov regularization method to obtain an appropriately regularized minimum-norm least-squares solution for the acoustic source Q. If the size of matrix GM×N is not too large, we can solve the inverse problem and compute the result without iteration.
From Eq. (8) we know that P can be written as:
| (10) |
Combining Eq. (9) with Eq. (10), we have:
| (11) |
From Eq. (11), we can define the scattering inverse problem as:
| (12) |
where AN×M = GN×Mdv + fGN×M ((I − fGdv)−1 Gdv) · dv.
This inverse problem is underdetermined, thus we use a solution satisfying the minimum-norm least-squares criterion:
| (13) |
where ()H is the Hermitian transpose, and ()† the pseudoinverse.
In most instances, to maintain a reasonable pixel dimension, the number of pixels in the ROI must be large enough, and it is not easy to compute the inverse matrix of G due to the limitation of computational resources. Here we propose another iterative algorithm:
Step 1. Let Ps = 0 in Eq. (9), and assume there is no acoustic pressure in ROI at the beginning;
- Step 2. Solve
- Step 3. Using Eq. (14) to compute P(Step=n+1) with P(Step=n) computed from step 2, and replacing P with the new one;
(14) Step 4. If the relative error between acoustic source Q(Step=n) and Q(Step=n+1) is larger than the given tolerance ε, go back to step 2. Otherwise finish the procedure and use the Q as the final solution.
Using the multiple excitation method of MAT-MI [20] [23], the distribution of the eddy current can be calculated using Eq. (15). Three groups of permanent magnets are utilized to sequentially send three different magnetic fields with same amplitude. The static magnetic fields are pointing to z, y, x directions, respectively.
| (15) |
After using multi-excitation algorithm [20] or ‘Potato-peeling method’ [23], we can finally reconstruct the electrical impedance.
III. Numerical Simulation
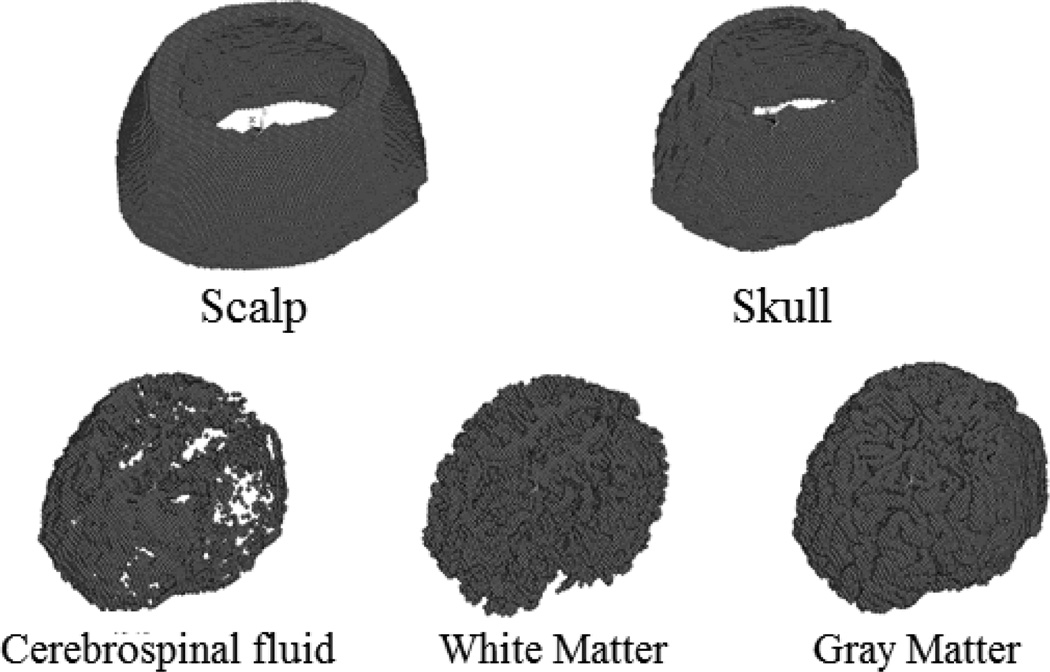
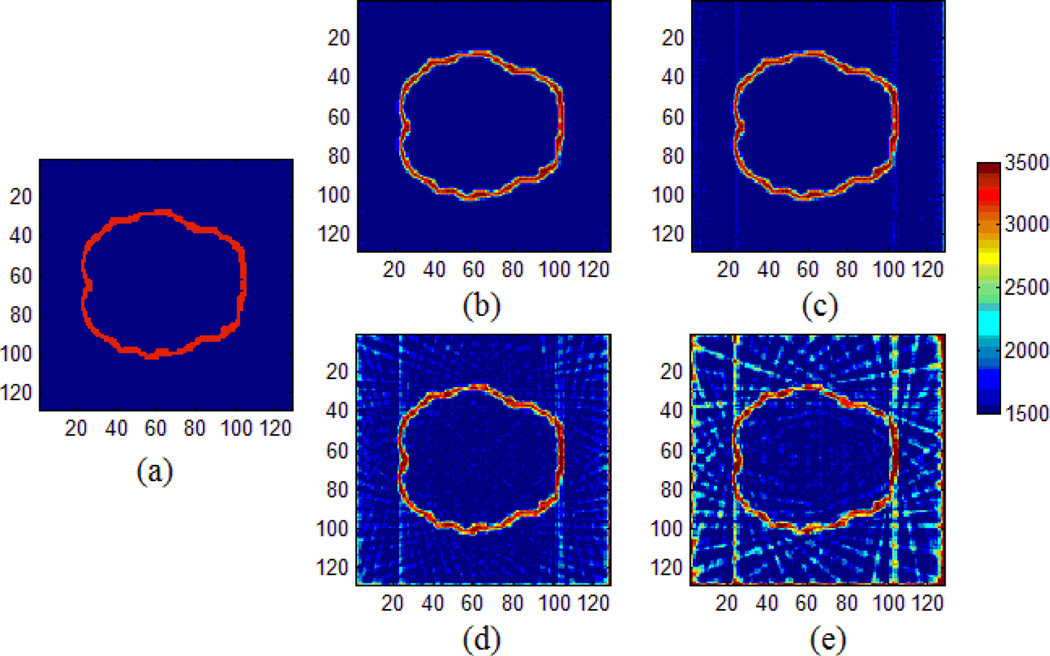
We have tested the feasibility of applying the proposed MAT-MI method for impedance reconstruction on a human head model, as shown in Fig. 3. The head model was constructed from MR images of a human subject [32] [33], and contains five tissues: scalp, skull, cerebrospinal fluid, white matter and gray matter. The parameters of conductivity and sound speed of this model are listed in table 1. We first used a pair of transmitter and receiver to reconstruct the acoustic speed distribution. With different rotation angles, the acoustic speed reconstruction results are shown in Fig. 4. The smaller rotation angle leads to better acoustic speed estimation. When the rotation angle 2 degrees or smaller, the reconstructed acoustic speed map agrees well with the target speed distribution.
Fig. 3.
Five different tissues of a human head model. All of these tissues are meshed into hexahedrons with same size.
TABLE I.
PARAMETERS OF THE HEAD MODEL
| Conductivity | Acoustic speed | |
|---|---|---|
| Scalp layer | 0.35S/m | 1500m/s |
| Skull layer | 0.0042S/m | 3500m/s |
| CSF | 1.79S/m | 1500m/s |
| WM | 0.14S/m | 1500m/ |
| GM | 0.33S/m | 1500m/s |
| Water | 0S/m | 1500m/s |
Fig. 4.
Reconstruction of acoustic speed distribution with different rotation angle. (a) is the acoustic speed distribution. (b), (c), (d) and (e) are the reconstruction results with 1°, 2°, 5°, 10° rotation angle in each step, respectively.
Also, we have conducted the MAT-MI computer simulation. The simulated experiment system setup is shown in Fig. 5. It contains an excitation coil, the head model and the surrounding water and air media. We meshed the solid models with tetrahedrons, pentahedrons and hexahedrons. The tissues that need high accuracy are meshed with hexahedrons and the rest are the combinations of tetrahedrons and pentaedrons with bigger sizes. The reconstructed image has voxel size of 2 × 2 × 2mm3.
Fig. 5.
The 3D MAT-MI system model used in computer simulation study
The focused transducer is used to scan around the object to collect ultrasound signals, and the horizontal scans at different vertical locations to get the 3D multi-slice volume data.
The 10mm excitation coil is placed 60mm above the head model and its inner and outer radii are 85mm and 100mm, respectively. A current pulse with 5 µs pulse width is injected into the coil. The current density of the pulse is 3 × 10⁶ A / m2. The transducers have a sampling frequency of 5MHz and are recorded for 7.5 milliseconds.
We utilized the finite element method to compute the induced eddy current in the forward problem of MAT-MI. Each element is considered as a point source and the center position of the element is considered as where it is located.
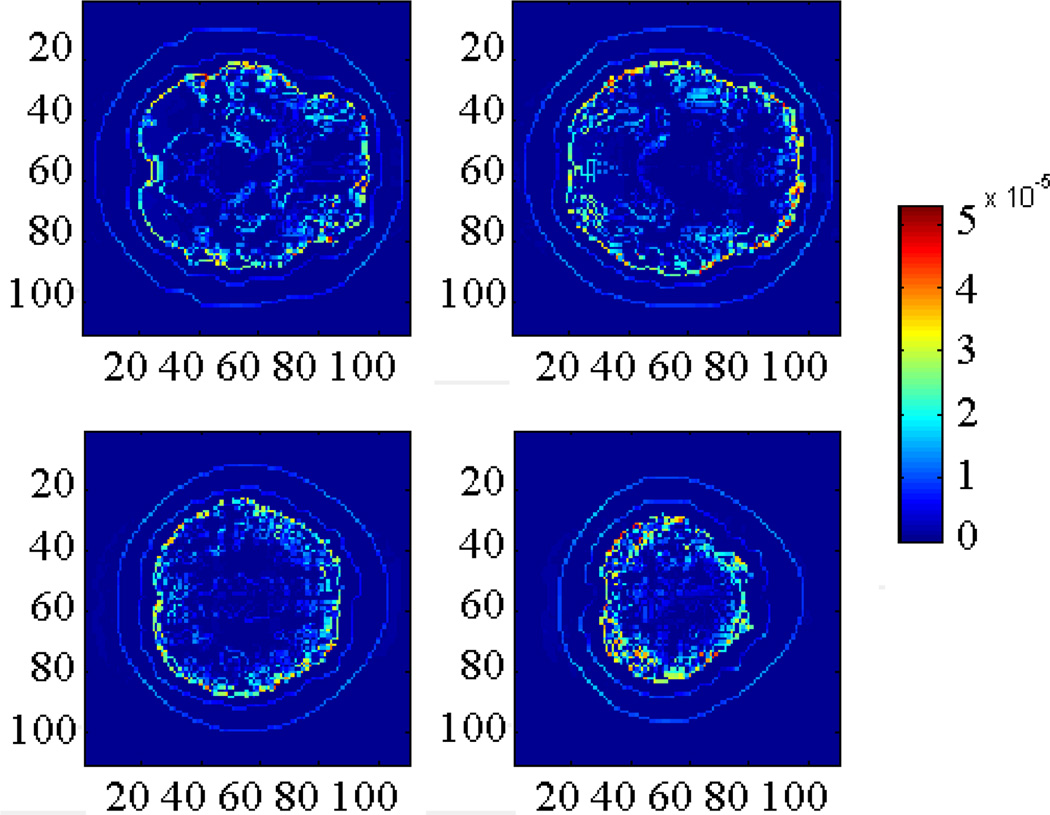
As shown in Fig. 6, the larger amplitude of acoustic source can be observed in conductivity boundaries such as between white matter and grey matter. In addition, according to Eq.(6), there is a “secondary acoustic source” existing in the space due to the acoustic inhomogeneous tissue (f (ri) ≠ 0).
Fig. 6.
The acoustic source distribution in 4 different slices. We observed that the acoustic source in conductivity boundaries has larger amplitude (Unit: Pa).
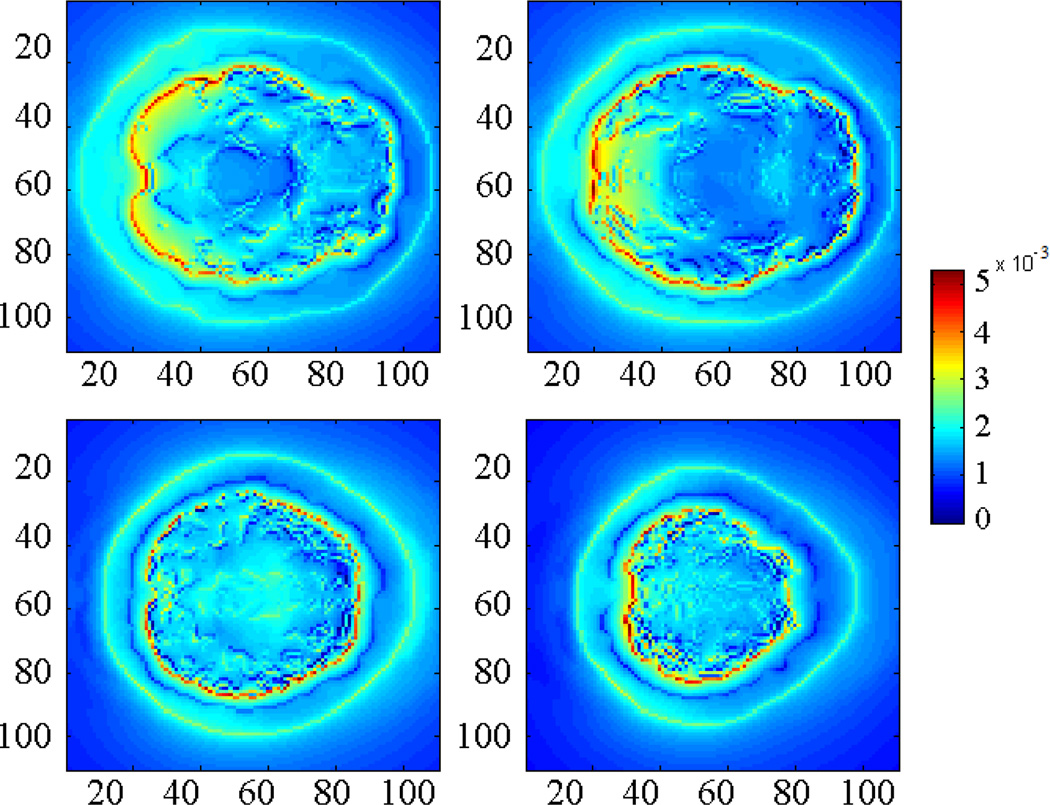
Fig. 7 shows the distribution of the “acoustic pressure” in the space. Using the algorithms described in section 2, the results converged after 10 iterations. As expected, the inhomogeneity occurs in those tissues whose acoustic properties are different from the background. Compared with the original acoustic source in Fig. 6, it is blurred in the skull layer due to acoustic speed variation.
Fig. 7.
Acoustic pressure distribution in 4 different slices (Unit: Pa).
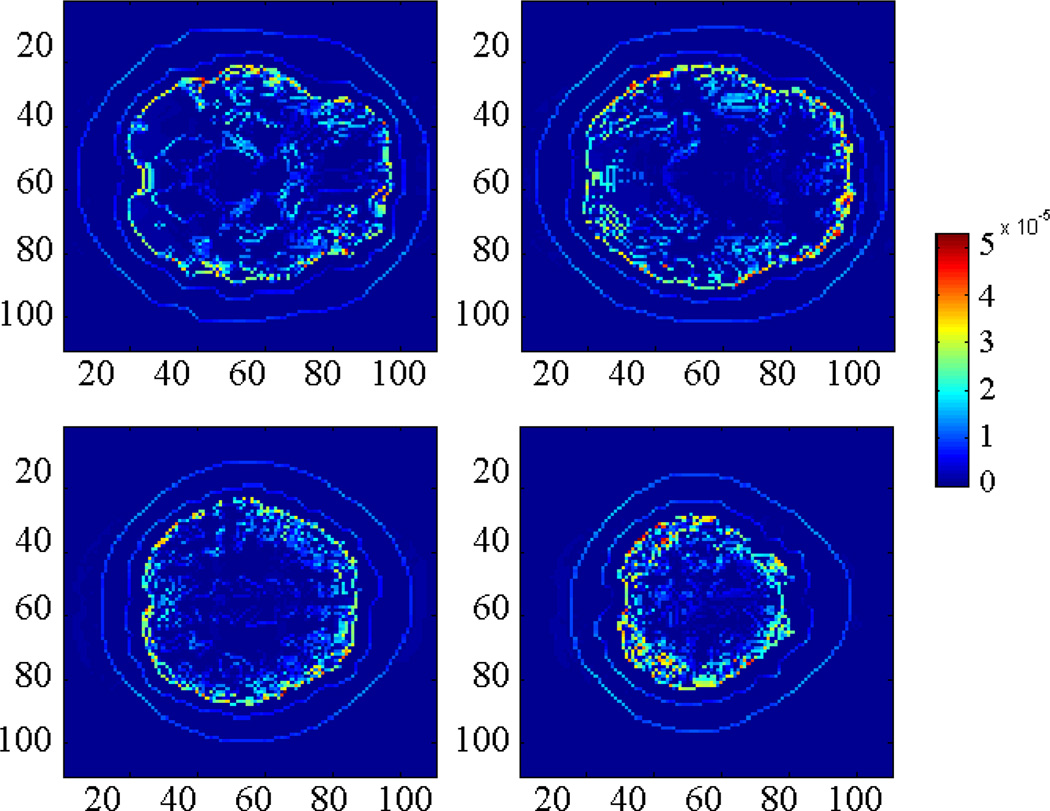
An ideal simulation under noise free condition and assuming unlimited bandwidth acoustic measurement is given in Fig. 8. In this case, the acoustic source results converged after 10 iterations. Compared with the target acoustic source distribution, relative error (RE) of the entire brain is 4.88%, and in each slice shown in Fig. 8, RE are 3.75%, 4,52%, 4.83%, 6.31%, respectively. The relative error is defined as:
where ASr is the reconstructed acoustic source in each element; AS0 is the target acoustic source and M is the total number of elements in the region of interest.
Fig. 8.
Acoustic source reconstruction results in 4 different slices. The signal used in the calculation is noise free (Unit: Pa).
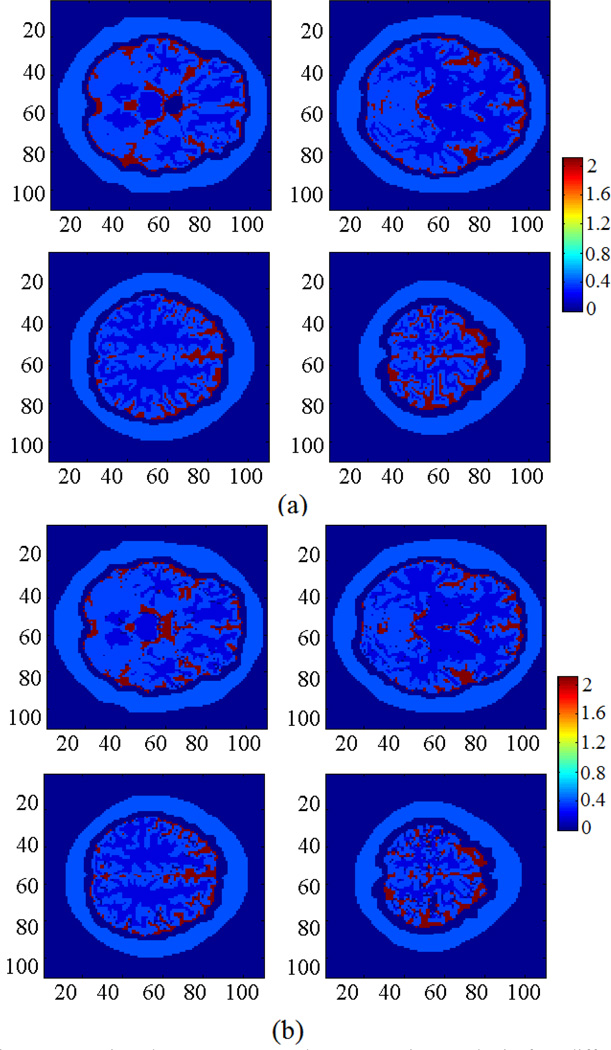
Using the impedance reconstruction algorithm based on the “Potato-Peeling method” [23], the distribution of the electrical impedance can be calculated. Fig. 9 shows the comparison between target and reconstruction results in four different slices. The correlation coefficients (CCs) between the reconstructed 3D conductivity multiple slice data and the target conductivity multiple slice data are 99.7%, 99.8%, 98.9%, and 99.0%, respectively. Fig. 10 shows three profile comparisons between the target and reconstructed conductivity distribution at Z=0 plane.
Fig. 9.
Comparison between target and reconstruction results in four different slices. (a) Conductivity distribution used in computer simulation. (b) Multiple conductivity reconstruction results at different locations along the Z direction (Unit: S/m).
Fig. 10.
Conductivity profile comparisons between the target and the reconstructed conductivity distribution at Z=0 plane (y=25,y=50,y=80, respectively).
Fig. 11 shows comparison results when different number of receivers were used. These results indicate that the present algorithm will be in favor of a large number of acoustic measurements.
Fig. 11.
The reconstruction results of acoustic source with different quantity of receivers. Number of measurements in (a) (b) (c) and (d) are 10000, 8500, 7000, 5500, respectively (Unit: Pa).
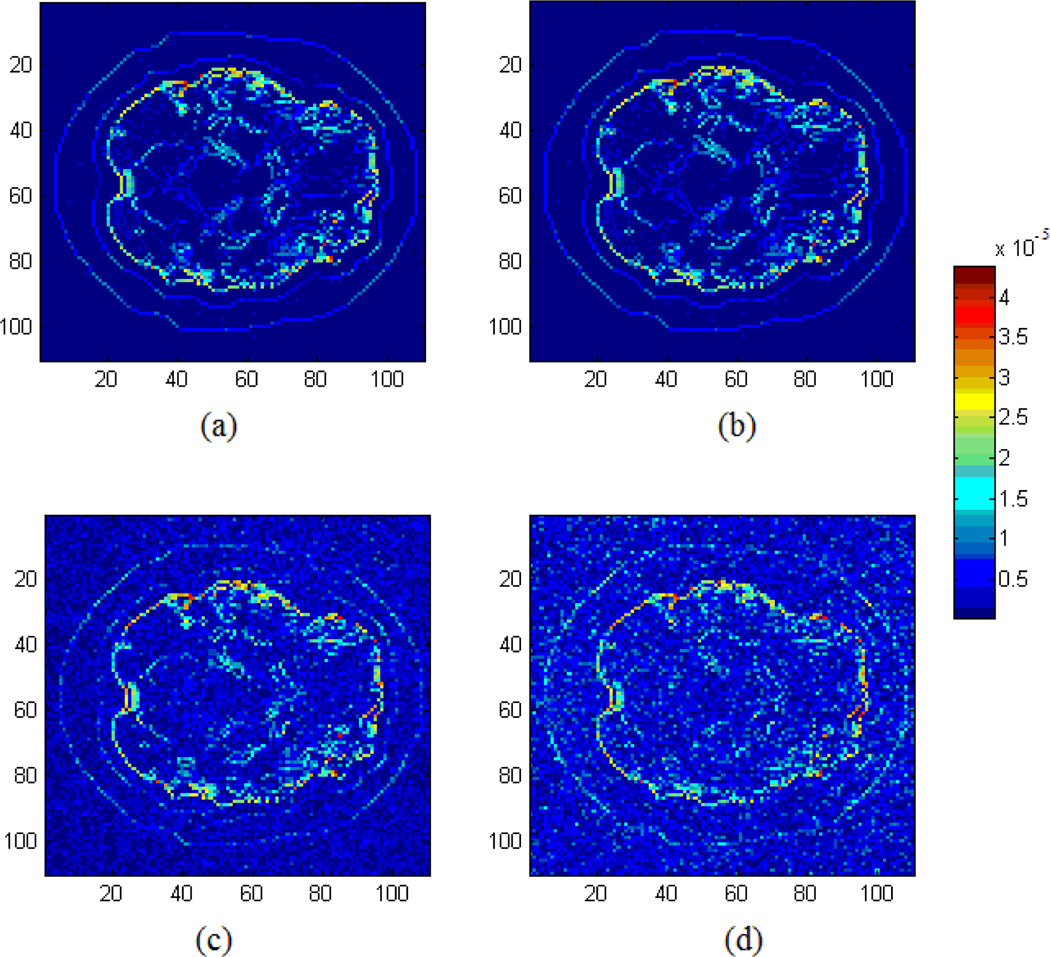
Fig. 12 shows effects of signal to noise ratio to the proposed MAT-MI reconstruction algorithm in an acoustically inhomogeneous tissue.
Fig. 12.
The reconstructed acoustic source image slices at Z=0 m with SNR of (a) (b) (c) and (d) to be infinite, 100dB, 80dB and 60dB, respectively (Unit:
IV. Discussion and Conclusion
It is of importance to image electrical properties of biological tissues and various electrical impedance imaging approaches have been pursued [1–26, 34–40]. MAT-MI is a non-invasive impedance imaging approach with high spatial resolution and does not suffer from the “shielding effect”. The existing reconstruction methods of MAT-MI have been tested only in soft tissues, which are acoustically homogeneous. However, most biological tissues contain components with different acoustic properties. The acoustic speed variation causes both blurring and displacement in the reconstructed image and reduces the contrast. To the best of our knowledge, no study has been reported on acoustic source reconstruction with MAT-MI for an acoustically inhomogeneous tissue.
In our study, we first used the ultrasonic transmission tomography (UTT) method to reconstruct the distribution of acoustic speed in the tissues. UTT [27] [28] [29] is a common way to calculate the acoustic properties, and is based on the assumption that the ultrasound wave travels in a straight line. In some applications, the assumption may become invalid when acoustic speed variations are big. In that case, we need to take special measures to improve the accuracy of acoustic speed distribution in the tissue. The quality of sound speed imaging would affect the impedance result directly.
To solve the inverse problem, the conditioned matrix A is related to the number of observer points. Therefore, a limitation of the present algorithm is that a large number of measurements are needed in order to obtain good imaging results. This could be implemented by using an acoustic transducer array which can be further rotated on space. Also, with a large number of measurements, the ill-conditioned inverse problem needs to be solved. Using Tikhonov regularization method, we have tested the performance of this algorithm under different SNR levels as shown in Figure 12. Fig. 12 suggests a reasonable image reconstruction could be obtained using the present algorithm considering SNR=60dB. Further research is needed to improve the inverse algorithm to obtain enhanced imaging results.
The speed of sound and the acoustic impedance are two important parameters in ultrasound imaging. In the present study, our imaging method is still based on the assumption ignoring the density variations, but is able to take acoustic speed variations due to acoustic inhomogeneity of tissues into consideration. When deriving Eq. (6), the density variation is ignored, which would lead to numerical errors around boundaries between the skull and soft tissue due to substantial change in density. The effect of the density variations should be further investigated in future studies.
In addition, we assumed the ultrasound signal is collected by ideal point detectors in the computer simulation. In practice, over hundreds of sensing locations can be easily obtained by mechanically scanning an ultrasound transducer or by using a transducer array. However, ultrasound transducers with acceptable sensitivity generally have finite aperture size, which may introduce certain blurring in the reconstructed MAT-MI acoustic source images. The effects of finite size of transducers should be taken into consideration in future investigations.
In summary, we have developed a new approach for MAT-MI to reconstruct electrical impedance in an acoustically inhomogeneous medium in terms of acoustic speed variation. This method represents a major advancement in MAT-MI to consider acoustic speed variation. Computer simulation studies have been conducted to evaluate the feasibility and performance of this proposed method for mapping electrical conductivity in the brain. The present results indicate that our proposed method offers a potential solution to perform MAT-MI high resolution imaging in acoustically inhomogeneous tissue, especially for brain imaging.
Acknowledgments
This work was supported in part by NIH EB014353, EB017069, EB006433, HL117664, and NSF CBET-1264782.
Biographies
Lian Zhou was born in Shaoxing, China, in 1985. He received the B.S. degree in electrical engineering in 2008, and the Ph.D. degree in control theory and control engineering in 2013 from Zhejiang University, Hangzhou, China.
His current research activities are related to signal processing, electrical impedance tomography, and magnetoacoustic tomography with magnetic induction.
Shanan Zhu was born in Wenzhou, China, in 1952. He received the B.S. degrees in electrical engineering from Zhejiang University, in 1984 and the Ph.D. degree in mechanical engineering from Zhejiang University, Hangzhou, in 1987.
From 1990 to 1992, he was a Research Assistant with the Oxford University. Since 1998, he has been a Professor with the College of Electrical Engineering, Zhejiang University, China. He has published more than 150 articles. His research interests include biomedical engineering, control theory and engineering.

Bin He (M’88, F’04) received his B.S. in Electrical Engineering from Zhejiang University in 1982, and Ph.D. in Bioelectrical Engineering from Tokyo Institute of Technology, Japan in 1988. He completed a postdoctoral fellowship in Biomedical Engineering at Harvard University - M.I.T. After working as a Research Scientist at M.I.T., he was on the faculty of Electrical Engineering and Bioengineering at the University of Illinois at Chicago. From January 2004, he has been on faculty at the University of Minnesota, where he is a Distinguished McKnight University Professor of Biomedical Engineering, Medtronic-Bakken Endowed Chair for Engineering in Medicine, and Director of Institute for Engineering in Medicine.
His research interests include functional biomedical imaging, neuroengineering, cardiovascular engineering, and biomedical instrumentation. He has published over 200 articles in peer-reviewed international journals, and delivered over 300 plenary, keynote and invited talks in various international conferences and in a number of institutions world-wide. Dr. He is a Fellow of IEEE, International Academy of Medical and Biological Engineering, American Institute of Medical and Biological Engineering, and Institute of Physics.
Contributor Information
Lian Zhou, College of Electrical Engineering Zhejiang University, Hangzhou, Zhejiang 310027 China.
Shanan Zhu, College of Electrical Engineering Zhejiang University, Hangzhou, Zhejiang 310027 China.
Bin He, Email: binhe@umn.edu, Department of Biomedical Engineering and Institute for Engineering in Medicine, University of Minnesota, Minneapolis, 55455, USA.
References
- 1.Paulson K, Lionheart W, Pidcock M. Optimal Experiments in Electrical-Impedance Tomography. IEEE Trans. Med. Imag. 1993;12:681–686. doi: 10.1109/42.251118. [DOI] [PubMed] [Google Scholar]
- 2.Metheral P, Barber DC, Smallwood RH, Brown BH. Three-dimensional electrical impedance tomography. Nature. 1996;380:509–512. doi: 10.1038/380509a0. [DOI] [PubMed] [Google Scholar]
- 3.Mueller JL, Isaacson D, Newell JC. A Reconstruction Algorithm for Electrical Impedance Tomography Data Collected on Rectangular Electrode Arrays. IEEE Trans. Biomed. Eng. 1999;46:1379–1386. doi: 10.1109/10.797998. [DOI] [PubMed] [Google Scholar]
- 4.Cheney M, Isaacson D, Newell JC. Electrical Impedance Tomography. SIAM Review. 1999;45:85–101. [Google Scholar]
- 5.Griffiths H. Magnetic induction tomography. Meas. Sci. Technol. 2001;12:1126–1131. [Google Scholar]
- 6.Kwon O, Woo E, Yoon J, Seo JK. Magnetic Resonance Electrical Impedance Tomography (MREIT): Simulation Study of J-Substitution Algorithm. IEEE Trans. Biomed. Eng. 2002;49:160–167. doi: 10.1109/10.979355. [DOI] [PubMed] [Google Scholar]
- 7.Gao N, Zhu S, He B. Estimation of electrical conductivity distribution within the human head from magnetic flux density measurement. Physics in Medicine and Biology. 2005;50:2675–2687. doi: 10.1088/0031-9155/50/11/016. [DOI] [PubMed] [Google Scholar]
- 8.Gao N, Zhu S, He B. A New Magnetic Resonance Electrical Impedance Tomography (MREIT) Algorithm: RSM-MREIT Algorithm with Applications to Estimation of Human Head Conductivity. Physics in Medicine and Biology. 2006;51(no.12):3067–3083. doi: 10.1088/0031-9155/51/12/005. [DOI] [PMC free article] [PubMed] [Google Scholar]
- 9.Lee S, Seo J, Park C, Lee B, Woo J, Lee S, Kwon O, Hahn J. Conductivity Image Reconstruction From Defective Data in MREIT: Numerical Simulation and Animal Experiment. IEEE Trans. Med. Imag. 2006;25:168–176. doi: 10.1109/TMI.2005.862150. [DOI] [PubMed] [Google Scholar]
- 10.Woo EJ, Seo JK. Magnetic resonance electrical impedance tomography (MREIT) for high-resolution conductivity imaging. Physiol. Meas. 2008;29:R1–R26. doi: 10.1088/0967-3334/29/10/R01. [DOI] [PubMed] [Google Scholar]
- 11.Wen H. Feasibility of biomedical application of Hall effect imaging Ultrason. Imaging. 2000;22:123–136. doi: 10.1177/016173460002200204. [DOI] [PubMed] [Google Scholar]
- 12.Towe BC, Islam MR. A Magneto-Acoustic Method for the Noninvasive Measurement of Bioelectric Currents. IEEE Trans. Biomed. Eng. 1988;35:892–894. doi: 10.1109/10.7300. [DOI] [PubMed] [Google Scholar]
- 13.Roth BJ, Basser PJ, Wikswo JP., Jr A theoretical model for magneto-acoustic imaging of bioelectric currents. IEEE Trans. Biomed. Eng. 1994;41:723–728. doi: 10.1109/10.310087. [DOI] [PubMed] [Google Scholar]
- 14.Wen H, Shah J, Balaban RS. Hall Effect Imaging. IEEE Trans. Biomed. Eng. 1998;45:119–124. doi: 10.1109/10.650364. [DOI] [PMC free article] [PubMed] [Google Scholar]
- 15.Xu Y, He B. Magnetoacoustic tomography with magnetic induction. Phys. Med. Biol. 2005;50:5175–5187. doi: 10.1088/0031-9155/50/21/015. [DOI] [PMC free article] [PubMed] [Google Scholar]
- 16.Li X, Xu Y, He B. A Phantom Study of Magnetoacoustic Tomography with Magnetic Induction (MAT-MI) for Imaging Electrical Impedance of Biological Tissue. Journal of Applied Physics. 2006;99(no.6) doi: 10.1063/1.2186371. Art. No. 066112. [DOI] [PMC free article] [PubMed] [Google Scholar]
- 17.Xia R, Li X, He B. magnetoacoustic tomographic imaging of electrical impedance with magnetic induction. Appl. Phys. Lett. 2007;91:083903-1–083903-3. doi: 10.1063/1.2772763. [DOI] [PMC free article] [PubMed] [Google Scholar]
- 18.Xia R, Li X, He B. Reconstruction of Vectorial acoustic Source in Time-Domain tomography. IEEE Trans. Med. Imag. 2009;28:669–675. doi: 10.1109/TMI.2008.2008972. [DOI] [PMC free article] [PubMed] [Google Scholar]
- 19.Ma Q, He B. Magnetoacoustic Tomography with Magnetic Induction: A Rigorous Theory. IEEE Transactions on Biomedical Engineering. 2008;55:813–816. doi: 10.1109/TBME.2007.912674. [DOI] [PMC free article] [PubMed] [Google Scholar]
- 20.Li X, Mariappan L, He B. Three-dimensional multi-excitation magnetoacoustic tomography with magnetic induction. Journal of Applied Physics. 2010;108:124702-1–124702-11. doi: 10.1063/1.3526001. [DOI] [PMC free article] [PubMed] [Google Scholar]
- 21.Mariappan L, Li X, He B. B-Scan Based Acoustic Source Reconstruction for Magnetoacoustic Tomography With Magnetic Induction (MAT-MI) IEEE Transaction on Biomedical Engineering. 2011;58:713–720. doi: 10.1109/TBME.2010.2094618. [DOI] [PMC free article] [PubMed] [Google Scholar]
- 22.Zhou L, Li X, Zhu S, He B. Magnetoacoustic tomography with magnetic induction (MAT-MI) for breast tumor imaging: numerical modeling and simulation. Phys. Med. Biol. 2011;56:1967–1983. doi: 10.1088/0031-9155/56/7/004. [DOI] [PMC free article] [PubMed] [Google Scholar]
- 23.Zhou L, Zhu S, He B. Three-Dimensional Bioimpedance Imaging Method of Magnetoacoustic Tomography with Magnetic Induction. Proc ICMIP. 2011:65–73. 2011. [Google Scholar]
- 24.Sun X, Zhang F, Ma Q, Tu J, Zhang D. Acoustic dipole radiation based conductivity image reconstruction for magnetoacoustic tomography with magnetic induction. Appl. Phys. Lett. 2012;100:024105. [Google Scholar]
- 25.Sun X, Fang D, Zhang D, Ma Q. Acoustic dipole radiation based electrical impedance contrast imaging approach of magnetoacoustic tomography with magnetic induction. Med. Phy. 2013;40:052902. doi: 10.1118/1.4800639. [DOI] [PubMed] [Google Scholar]
- 26.Brinker K, Roth BJ. The effect of electrical anisotropy during magnetoacousitc tomography with magnetic induction. IEEE Trans. Biomed. Eng. 2008;55:1637–1639. doi: 10.1109/TBME.2007.914001. [DOI] [PubMed] [Google Scholar]
- 27.Kim JH, Park SB, Johnson SA. Tomographic imaging of ultrasonic reflectivity with correction for acoustic speed variations. Ultrasonic Imaging. 1984;6:304–312. doi: 10.1177/016173468400600305. [DOI] [PubMed] [Google Scholar]
- 28.Jago JR, Whittingham TA. Experimental studies in transmission ultrasound computed tomography. Phys. Med. Biol. 1991;36:1515–1527. doi: 10.1088/0031-9155/36/11/011. [DOI] [PubMed] [Google Scholar]
- 29.Jin X, Wang LV. Thermoacoustic tomography with correction for acoustic speed variations. Phys. Med. Biol. 2006;51:6437–6448. doi: 10.1088/0031-9155/51/24/010. [DOI] [PubMed] [Google Scholar]
- 30.Haddadin OS, Ebbini ES. Imaging Strongly Scattering Media Using a Multiple Frequency Distorted Born Iterative Method. IEEE Trans. Ultrasonics, Ferroelectrics, and Frequency Control. 1998;45:1485–1496. doi: 10.1109/58.738288. [DOI] [PubMed] [Google Scholar]
- 31.Roberto L, Michael O. A Study on the Reconstruction of Moderate Contrast Targets Using the Distorted Born Iterative Method. IEEE Transactions on Ultrasonics, Ferroelectrics, and Frequency Control. 2008;55(No. 1) doi: 10.1109/TUFFC.2008.621. [DOI] [PubMed] [Google Scholar]
- 32.Lee WH, Liu ZM, Mueller BA, Lim K, He B. Influence of white matter anisotropic conductivity on EEG source localization: Comparison to fMRI in human primary visual cortex. Clinical Neurophysiology. 2009;120:2071–2081. doi: 10.1016/j.clinph.2009.09.007. [DOI] [PMC free article] [PubMed] [Google Scholar]
- 33.Zhang X, Zhu S, He B. Imaging Electrical Properties of Biological Tissues by RF Field Mapping in MRI. IEEE Trans. Medical Imaging. 2010;29:474–481. doi: 10.1109/TMI.2009.2036843. [DOI] [PMC free article] [PubMed] [Google Scholar]
- 34.He B, Coleman T, Genin GM, Glover G, Hu X, Johnson N, Liu T, Makeig S, Sajda P, Ye K. Grand Challenges in Mapping the Human Brain: NSF Workshop Report. IEEE Trans. Biomed. Eng. 2013;60(no. 11):2983. doi: 10.1109/TBME.2013.2283970. [DOI] [PubMed] [Google Scholar]
- 35.Yusupov B, Zlochiver S. Biopsy Needle Localization Using Magnetic Induction Imaging Principles: A Feasibility Study. IEEE Transactions on Biomedical Engineering. 2012;Vol. 59(No. 8):2330–2337. doi: 10.1109/TBME.2012.2203132. [DOI] [PubMed] [Google Scholar]
- 36.De Marco T, Ries F, Guermandi M, Guerrieri R. EIT Forward Problem Parallel Simulation Environment with Anisotropic Tissue and Realistic Electrode Models. IEEE Transactions on Biomedical Engineering. 2012;Vol. 59(No. 5):1229–1239. doi: 10.1109/TBME.2011.2175731. [DOI] [PubMed] [Google Scholar]
- 37.de Castro Martins T, de Camargo EDLB, Gonzalez Lima R, Amato MBP, de Sales Guerra Tsuzuki M. Image Reconstruction Using Interval Simulated Annealing in Electrical Impedance Tomography. IEEE Transactions on Biomedical Engineering. 2012;Vol. 59(No. 7):1861–1870. doi: 10.1109/TBME.2012.2188398. [DOI] [PubMed] [Google Scholar]
- 38.Sperandio M, Guermandi M, Guerrieri R. A Four-Shell Diffusion Phantom of the Head for Electrical Impedance Tomography. IEEE Transactions on Biomedical Engineering. 2012;Vol. 59(No. 2):383–389. doi: 10.1109/TBME.2011.2173197. [DOI] [PubMed] [Google Scholar]
- 39.Gracia J, Seppa VP, Viik J, Hyttinen J. Multilead Measurement System for the Time-Domain Analysis of Bioimpedance Magnitude. IEEE Transactions on Biomedical Engineering. 2012;Vol. 59(No. 8):2273–2280. doi: 10.1109/TBME.2012.2202318. [DOI] [PubMed] [Google Scholar]
- 40.Yang R, Li X, Song A, He B, Yan R. A 3-D reconstruction solution to current density imaging based on acoustoelectric effect by deconvolution: A simulation study. IEEE Transactions on Biomedical Engineering. 2013;Vol. 60(No. 5):1181–1190. doi: 10.1109/TBME.2012.2228641. [DOI] [PubMed] [Google Scholar]


