

Abstract
Gastric cancers (GC) have the high morbidity and mortality rates worldwide and there is a need to identify sufficiently sensitive biomarkers for GC. MicroRNAs (miRNAs) could be promising potential biomarkers for GC diagnosis. We employed a systematic and integrative bioinformatics framework to identify GC-related microRNAs from the public microRNA and mRNA expression dataset generated by RNA-seq technology. The performance of the 17 candidate miRNAs was evaluated by hierarchal clustering, ROC analysis, and literature mining. Fourteen have been found to be associated with GC and three microRNAs (miR-211, let-7b, and miR-708) were for the first time reported to associate with GC and may be used for diagnostic biomarkers for GC.
1. Introduction
Gastric cancer (GC) or stomach cancer (SC), the fourth leading cancer worldwide, is a biologically heterogeneous disease. It is the second major contributor to mortality caused by cancer [1, 2]. GC is most common in the Asian and Pacific Islanders and the incidence and death rate are more than twice those in Whites [3]. The occurrence and development of GC is multiple step and multiple factorial processes. The risk factors for gastric cancer include Helicobacter pylori infection, advanced age, diet low in fruits and vegetables or high in salted, smoked, preserved foods, chronic atrophic gastritis, and family history of gastric cancer [4–7].
MicroRNAs are small, single-stranded, and noncoding RNAs that negatively regulate gene expression at the posttranscriptional level [8]. Multiple studies have shown differential expression of microRNAs between cancer and normal tissues. Aberrant changes in microRNAs expression have been shown to be associated with lung cancers [9], breast cancers [10], prostate cancers [11], and others. MicroRNAs are therefore the promising candidates as diagnostic, prognostic, and predictive biomarkers in cancers. Various studies have investigated important role of the microRNAs in gastric cancers [12–17].
However, gastric cancers are systems biology diseases and the heterogeneity and complexity of carcinogenesis complicate the marker identification process. Herein we employed an integrated systems biology approach to identifying candidate miRNAs as biomarkers that could differentiate patient with gastric cancer from healthy controls. The analysis pipeline of this paper is shown in Figure 1.
Figure 1.

Analysis pipeline in this study.
2. Methods
2.1. Dataset Collection and Outlier Differential Expressed Genes Detection
We explored expression profiles (GSE36968 from NCBI GEO) for gastric cancer (GC) and noncancerous gastric tissue samples [18]. The dataset was generated by the AB SOLiD System 3.0 (Homo sapiens). The dataset includes 30 transcriptomic profiles, 6 from noncancerous gastric tissues and 24 from gastric tumor samples. Among the 30 samples, 25 of them have paired miRNA and mRNA expression profiles. These 25 samples, which contain 6 noncancerous gastric tissue samples and 19 gastric tumor samples, were selected for further analysis. The clinical information of the samples was summarized in Table 1 and the detailed information was listed in Additional file 1 in Supplementary Material available online at http://dx.doi.org/10.1155/2014/901428. We directly downloaded the processed expression data and used log transformation of the expression values for the following analysis.
Table 1.
Clinical information of 25 samples.
| Characteristic | Sample (n = 25) | |
|---|---|---|
| Age | Median | 66 |
| Range | 32–83 | |
|
| ||
| Sex | Male | 20 |
| Female | 5 | |
|
| ||
| Stage | Stage I | 5 |
| Stage II | 5 | |
| Stage III | 5 | |
| Stage IV | 4 | |
| Normal | 6 | |
|
| ||
| Histology | Mixed | 2 |
| Diffuse | 9 | |
| Intestine | 5 | |
| Unknown | 3 | |
| Normal | 6 | |
Outlier microRNAs and genes were detected with least sum of ordered subset square t-statistic (LSOSS) [19] and implemented in R scripts by Karrila et al. [20]. We used the spearman correlation method to detect negative correlations between outlier miRNAs and outlier genes. The cutoff for correlation coefficient was chosen to be −0.6 and P value < 0.05. Thus we got the significant inverse expression pattern specific for the gastric cancer.
2.2. Refinement of Candidate Gastric Cancer MicroRNAs with the Pipeline of Outlier MicroRNA Analysis (POMA)
We employed an in-house prediction model POMA to identify the candidate GC miRNAs from the outlier miRNAs detected by LSOSS. POMA is an integrative method to identify candidate cancer miRNA biomarkers from the miRNA regulatory network by linking paired miRNA and gene expression data and highly reliable miRNA-mRNA interaction data [21]. The main hypothesis of POMA is that if the deregulated genes are targeted exclusively by certain miRNA, this very miRNA is more likely to show regulatory activity. Based on the in-depth exploration of miRNA regulatory network, we conclude that miRNAs with greater independent regulatory power were more likely to be potential biomarkers in human. POMA has successfully identified miRNAs as potential biomarkers in prostate cancer [21], clear cell renal cell carcinoma [22], and sepsis [23].
Using POMA, we mapped the inverse expression pattern of miRNAs and targets to a human miRNA-mRNA interaction network to construct a GC-specific miRNA-mRNA interaction subnetwork. The human miRNA-mRNA interaction network was reconstructed by a comprehensive search of experimentally validated interactions extracted from 4 databases (miRecords, miRTarbase, miR2Disease, and TarBase) and computational prediction from HOCTAR, starBase, and ExprTargetDB.
Then the Z-score was calculated to measure the probability of miRNA having regulatory role in cancer. Z-score was the ratio of number of genes targeted exclusively by a specific miRNA (α) and number of all the genes targeted by that miRNA (β). The Z-score was calculated for each miRNA in the GC-specific miRNA-mRNA interaction subnetwork. Using thresholds 0.3 of Z-score and significantly larger α (α > 1, P value < 0.05), we identified candidate miRNAs with potential regulatory role in GC.
2.3. Evaluation of the Performance of MicroRNAs
We employed the heat map and ROC analysis to evaluate the quality of candidate miRNA as GC biomarkers. Heat map and hierarchical clustering were performed by the R package “gplots” [24]. Receiver-operating characteristic (ROC) curves were constructed and the area under ROC curves (AUC) was calculated to evaluate the performance of each candidate miRNA. The parameters sensitivity, specificity, and accuracy were also provided for the miRNAs.
2.4. Functional Enrichment of MicroRNA Targets
The target genes of candidate miRNAs were mapped to different databases, including gene ontology (GO), KEGG, and MetaCore pathway maps and diseases (by Biomarkers) ontology for functional enrichment analysis. GO and KEGG pathway enrichment were performed using Database for Annotation, Visualization and Integrated Discovery (DAVID) [25, 26]. MetaCore pathway maps and diseases (by Biomarkers) ontology enrichment analysis were performed by MetaCore from Thomson Reuters. MetaCore calculates the P value by hypergeometric distribution to evaluate the statistical significance of the enriched pathways and diseases (by Biomarkers) and uses false discovery rate adjustment for multiple test correction.
3. Results
3.1. Detection of Gastric Cancer Specific miRNA-mRNA Subnetwork
Using POMA, we mapped the significant inverse expression pattern from the gastric cancer data to the human miRNA-mRNA interaction network to get the GC specific miRNA-mRNA subnetwork as illustrated in Figure 2 and the edge list of the network was shown in Additional file 2. The subnetwork contains 161 nodes, 46 miRNAs (red nodes), 115 target genes (green nodes), and 142 interactions.
Figure 2.
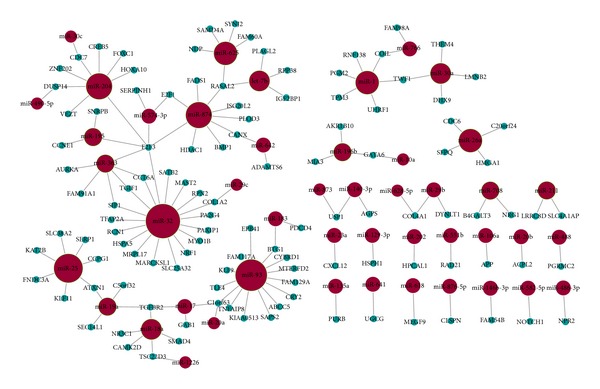
Gastric cancer specific miRNA-mRNA subnetwork. Red nodes and blue nodes denote miRNAs and target genes, respectively. miRNAs nodes with green border are candidate miRNAs as biomarkers.
3.2. Identifying Candidate miRNA as Biomarkers for GC
We retrieved a set of seventeen candidate miRNAs (Table 2) through POMA and evaluated their performance as biomarkers in three aspects. First, using hierarchical clustering based on the candidate miRNAs expression, we successfully separated the 19 samples of cancer tissue and 6 normal samples into discrete groups (Figure 3). The ROC curves for the 17 candidate miRNAs are presented in Figure 4. The areas under the ROC curve (AUC) for the 17 miRNAs are 0.833–0.986, and overall accuracy is 73.2%–94.3%. The identified miRNAs are able to effectively differentiate patients with the GC from controls.
Table 2.
Aberrantly expressed miRNAs in gastric cancer detected by low-throughput methods.
| miRNA | Expression in GC | Detection technology | Study design | PMID |
|---|---|---|---|---|
| miR-204 | Down | RT-PCR/QRT-PCR RT-PCR QRT-PCR |
Cell lines Tissue Tissue |
23768087 23152059 21416062 |
| miR-211 | — | — | — | — |
| miR-196b | Up | QRT-PCR | Tissue | 21416062 24222951 |
| let-7b | — | — | — | — |
| miR-18a | Up | QRT-PCR | Tissue | 21671476 |
| miR-19a | Up | QRT-PCR | Tissue Cell lines |
23621248 |
| miR-25 | Up | Northern blotting | Tissue | 19153141 |
| miR-874 | Down | QRT-PCR | Cell lines | 23800944 |
| miR-625 | Down | QRT-PCR | Tissue | 22677169 |
| miR-30a | — | — | — | — |
| miR-363 | Up | QRT-PCR | Cell lines | 23975832 |
| miR-93 | Up | QRT-PCR | Tissue | 18328430 |
| miR-32 | Up | QRT-PCR | Tissue | 21874264 |
| miR-26a | Down | QRT-PCR | Tissues Cell lines |
24015269 |
| miR-195 | Down | RT-PCR | Tissue | 21987613 |
| miR-708 | — | — | — | — |
| miR-1 | Up | QRT-PCR | Serum | 21112772 |
Figure 3.

Hierarchical clustering of 19 cancer samples and 6 normal samples with the 17 candidate miRNAs. Every row represents individual miRNA, and each column represents individual sample.
Figure 4.

ROC curve of candidate GC miRNAs. AUC: area under the curve.
Furthermore, we also performed the literature search of the seventeen miRNAs to validate their role in the regulation of GC; see Table 2. Fourteen of them have been reported for their roles in gastric cancer by the low-throughput experiment, such as miR-204 targets Bcl-2 [27] and SIRT1 [28] with downregulation in gastric cancer. Although the remaining four miRNAs were not proved in low-throughput experiment, they have their role in gastric cancer or other cancers. miRNA-30a is ensembled with other six miRNAs as a seven-miRNA signature which is closely associated with relapse-free and overall survival among patients with gastric cancer [29]. miRNA-211 has contribution to colorectal cancer cell growth [30], melanoma cell invasion [31], and head and neck carcinomas [32]. The expression level of miR-708 reflects differences between colorectal carcinogenesis and normal samples [33] and it may play an important role as a tumor suppressor in human glioblastoma cells [34]. let-7b was upregulated in the acute myeloid leukemia when compared to healthy controls [35]. let-7b in GC patients with low HMGA2 (high mobility group A2) expression was significantly higher than in those with high HMGA2 expression and high expression of HMGA2 in GC correlates was an independent prognostic factor [36]. Therefore, the four miRNAs may be the potential biomarkers for gastric cancer.
3.3. Function Enrichment of Candidate miRNAs Target Genes
The candidate miRNAs, along with their regulated genes, provide potential miRNA-mRNA target pairs in gastric cancer. The targets of these miRNAs were mapped to functional databases, including GO, KEGG, and MetaCore (Figure 5 and Additional file 3). The significantly enriched GO terms (P value < 0.05 and FDR < 0.05) include regulation of RNA metabolic process, regulation of transcription from RNA polymerase II promoter, regulation of transcription, DNA-templated and regulation of transcription. KEGG pathways that are significantly enriched with the candidate miRNAs targets are associated with cancer, for example, cell cycle, pancreatic cancer, pathways in cancer, and prostate cancer.
Figure 5.

Functional enrichment analysis of target genes. (a) is the significantly enriched MetaCore pathway map. (b) is the significantly enriched disease (biomarkers) ontology.
The enriched (P value < 0.05 and FDR < 0.05) MetaCore pathway maps converge on cell cycle, development, and transcription, as shown in Figure 5 and Table 3. Then we searched the PubMed for published papers describing their constituent network objects in GC to evaluate the relevance of these pathway maps in gastric cancer. All of the enriched pathways have at least ten objects related to gastric cancer; see Additional file 4.
Table 3.
The significant GeneGo pathway maps enriched with candidate miRNAs target genes.
| Pathway maps | Pathway map category | Ration of mapped targets | P value | PubMed citation number |
|---|---|---|---|---|
| Start of DNA replication in early S phase | Cell cycle | 4/32 | 1.650E − 05 | 37 |
| Cell cycle (generic schema) | Cell cycle | 3/21 | 1.387E − 04 | 75 |
| Glucocorticoid receptor signaling | Development | 3/24 | 2.089E − 04 | 76 |
| Ligand-dependent activation of the ESR1/SP pathway | Transcription | 3/30 | 4.105E − 04 | 319 |
| TGF-beta-dependent induction of EMT via SMADs | Development | 3/35 | 6.505E − 04 | 292 |
| Regulation of G1/S transition (part 1) | Cell cycle | 3/38 | 8.298E − 04 | 238 |
| Notch signaling pathway | Development | 3/43 | 1.193E − 03 | 29 |
Disease (biomarkers) ontology in MetaCore is created based on the classification in Medical Subject Headings (MeSH), a controlled vocabulary of medical terms created by the National Library of Medicine (http://www.nlm.nih.gov). Each disease in diseases ontology has its corresponding biomarker gene or a set of genes. The stomach neoplasms disease term ranked top three among the enriched diseases. There are 41 objects in the stomach neoplasms that were mapped by the candidate miRNAs target genes. All these results further confirmed the correlation between these target genes and GC and, hence, testified the reliability of our predicted miRNAs as gastric cancer biomarkers.
4. Discussion
In this study, we identified 17 miRNAs using a systematic and integrative method POMA from RNA-seq based expression profile. We first applied LSOSS to detect differentially expressed microRNAs and genes from the RNA-seq data. LSOSS generally outperforms the t-statistics and is more competent for cancer data analysis, as our previous studies indicated [22, 37]. Then the inverse expression pattern of miRNAs and genes was predicted by the spearman correlation.
Using POMA, we got gastric cancer specific miRNA-mRNA subnetwork and 17 candidate GC miRNAs for biomarkers with regulatory roles. The performance of the identified miRNAs was evaluated by hierarchical clustering and ROC curve. Moreover, literature mining confirmed that 14 out of the 17 candidate miRNAs have been reported to have aberrant expression in GC, which lends credibility to our finding. The remaining three miRNAs, miR-211, miR-708, and let-7b, have no previous annotation in GC, but their role in other digestive systems cancers has been reported. miR-211 expression promotes colorectal cancer cell growth [30] and could be a prognostic factor in resected pancreatic ductal adenocarcinoma [38]. miR-708 undergoes aberrant expression in colorectal carcinogenesis samples [33] and pancreatic intraepithelial neoplasias samples [39]. In colorectal liver metastases, invasion front-specific downregulation of let-7b plays a pivotal role in tumor progression [40]. let-7 (let-7b and let-7c) expression has relationship with response to chemotherapy in patients with esophageal cancer and can be potentially used to predict the response to cisplatin-based chemotherapy in esophageal cancer [41]. To our best knowledge, this is the first report that the three microRNAs (miR-211, miR-708, and let-7b) could be the candidate biomarkers for human gastric cancers.
Functional enrichment analysis of the candidate miRNAs target genes revealed some important biological process and pathway maps. Most GO biological process terms are about the regulation processes, for example, the regulation of RNA metabolic process and regulation of transcription. The enriched GO terms in molecular function were also associated with transcription activity such as microRNA regulation activity. The GO enrichment results agree well with the regulatory concepts of microRNAs. MicroRNAs repress their target genes to fine-tune distinct gene regulatory programs. In cancer, microRNAs play either oncogenic or tumor suppressive role. Oncogenic microRNAs downregulate tumor suppressor genes directly, whereas tumor suppressor microRNAs might lead to the upregulation of oncogenes. In this way, microRNAs regulate cancer progression and dictate specific disease phenotypes. It is also observed that microRNAs are tightly related to other families of regulators, such as transcription factors in gene regulatory networks. They work synergistically to regulate gene expression. So it is not surprising that the targets of GC-related microRNAs converge in gene regulatory processes.
KEGG pathways that are significantly enriched with candidate miRNA targets were all associated with cancers, for example, chronic myeloid leukemia, pancreatic cancer, pathways in cancer, and prostate cancer. It is worth noting that the enriched pathways from both KEGG and MetaCore are involved in cell cycle. For example, in the MetaCore, the top two significantly enriched pathways: the start of DNA replication in early S phase and cell cycle (generic schema) belong to the cell cycle category. The remaining pathways also have important roles in gastric cancer, such as the famous TGF-beta signaling pathway [42–44]. We further evaluated the relevance of the enriched MetaCore pathway maps to gastric cancer by performing the text mining at the objects levels in each pathway and found that all these pathways contain at least ten critical genes in gastric cancers.
According to the disease ontology enrichment analysis, the stomach neoplasm was the second most enriched disease ontology in MetaCore pathways, colorectal neoplasm being the top enriched one. The reason may be that the colorectal neoplasms category incorporates more genes (8014 genes) than stomach neoplasms (3101 genes) in MetaCore database. Thus genes are more likely to be enriched in the colorectal neoplasms. Additionally, colorectal neoplasms and stomach neoplasms share some genes.
The experimental validation is a necessary task to be done after the identification of putative gastric cancer related miRNAs. This is our research plan for the future. Since we did not verify the miRNAs directly in this study, we provided some “indirect evidences” to validate our result by text mining. Although not perfect, text mining helps us to mine previously discovered differential miRNAs and pathways from large volumes of literature, which can help reduce the number of our predicted cancer associated pathways, and to expedite the biological validation of the pathways of interest.
Because the main goal of this research is to identify viable biomarkers of GC diagnosis, we only grouped the samples into 2 major categories: cancer versus noncancerous. Such a binary classification has not fully considered the clinical aspects of each sample. As a future perspective, patients could be subdivided into well-defined small groups according to their unique clinical features, for example, stage, histologic, and therapeutic response. In this manner, the individual difference of cancer mechanism is accounted. This kind of investigation will help to find population-specific biomarkers and facilitate personalized diagnosis, prognosis, or treatment of gastric cancer.
In conclusion, we identified 17 microRNAs that are associated with gastric cancers and 3 of them (miR-211, let-7b, and miR-708) could be potential novel biomarkers for gastric cancer diagnosis and treatment. The candidates predicted herein need further wet-lab validation.
Supplementary Material
Additional File 1: Clinical information for 25 samples, including sex, age, GC type and histologic type.
Additional File 2: GC Specific miRNA-mRNA Network.
Additional File 3: Enriched Functional Themes for Target Genes of Candidate miRNAs.
Additional File 4: Enriched MetaCore Pathways and Constituent GC-Related Objects.
Acknowledgments
This work was supported by the Natural Science Foundation for Colleges and Universities in Jiangsu Province (13KJB180021) and Natural Science Foundation of USTS (XKQ201315), National Natural Science Foundation of China (Grant nos. 31170795 and 91230117), International S&T Cooperation Program of Suzhou (SH201120), and the National High Technology Research and Development Program of China (863 Program, Grant no. 2012AA02A601).
Conflict of Interests
The authors declare that there is no conflict of interests.
Authors' Contribution
Wenying Yan and Shouli Wang contributed equally to this work.
References
- 1.Hamilton JP, Meltzer SJ. A review of the genomics of gastric cancer. Clinical Gastroenterology and Hepatology. 2006;4(4):416–425. doi: 10.1016/j.cgh.2006.01.019. [DOI] [PubMed] [Google Scholar]
- 2.Ferlay J, Shin H-R, Bray F, Forman D, Mathers C, Parkin DM. Estimates of worldwide burden of cancer in 2008: GLOBOCAN 2008. International Journal of Cancer. 2010;127(12):2893–2917. doi: 10.1002/ijc.25516. [DOI] [PubMed] [Google Scholar]
- 3.Jemal A, Siegel R, Ward E, et al. Cancer statistics, 2006. Ca-A Cancer Journal for Clinicians. 2006;56(2):106–130. doi: 10.3322/canjclin.56.2.106. [DOI] [PubMed] [Google Scholar]
- 4.Kurtz RC, Sherlock P. The diagnosis of gastric cancer. Seminars in Oncology. 1985;12(1):11–18. [PubMed] [Google Scholar]
- 5.Scheiman JM, Cutler AF. Helicobacter pylori and gastric cancer. The American Journal of Medicine. 1999;106(2):222–226. doi: 10.1016/s0002-9343(98)00393-3. [DOI] [PubMed] [Google Scholar]
- 6.Fenoglio-Preiser CM, Noffsinger AE, Belli J, Stemmermann GN. Pathologic and phenotypic features of gastric cancer. Seminars in Oncology. 1996;23(3):292–306. [PubMed] [Google Scholar]
- 7.Navarro Silvera SA, Mayne ST, Risch HA, et al. Principal component analysis of dietary and lifestyle patterns in relation to risk of subtypes of esophageal and gastric cancer. Annals of Epidemiology. 2011;21(7):543–550. doi: 10.1016/j.annepidem.2010.11.019. [DOI] [PMC free article] [PubMed] [Google Scholar]
- 8.Bartel DP. MicroRNAs: genomics, biogenesis, mechanism, and function. Cell. 2004;116(2):281–297. doi: 10.1016/s0092-8674(04)00045-5. [DOI] [PubMed] [Google Scholar]
- 9.Yanaihara N, Caplen N, Bowman E, et al. Unique microRNA molecular profiles in lung cancer diagnosis and prognosis. Cancer Cell. 2006;9(3):189–198. doi: 10.1016/j.ccr.2006.01.025. [DOI] [PubMed] [Google Scholar]
- 10.Iorio MV, Ferracin M, Liu C-G, et al. MicroRNA gene expression deregulation in human breast cancer. Cancer Research. 2005;65(16):7065–7070. doi: 10.1158/0008-5472.CAN-05-1783. [DOI] [PubMed] [Google Scholar]
- 11.Ozen M, Creighton CJ, Ozdemir M, Ittmann M. Widespread deregulation of microRNA expression in human prostate cancer. Oncogene. 2008;27(12):1788–1793. doi: 10.1038/sj.onc.1210809. [DOI] [PubMed] [Google Scholar]
- 12.Wang JL, Hu Y, Kong X, et al. Candidate microRNA biomarkers in human gastric cancer: a systematic review and validation study. PLoS ONE. 2013;8(9) doi: 10.1371/journal.pone.0073683.e73683 [DOI] [PMC free article] [PubMed] [Google Scholar]
- 13.Wu WKK, Lee CW, Cho CH, et al. MicroRNA dysregulation in gastric cancer: a new player enters the game. Oncogene. 2010;29(43):5761–5771. doi: 10.1038/onc.2010.352. [DOI] [PubMed] [Google Scholar]
- 14.Madhavan D, Cuk K, Burwinkel B, Yang R. Cancer diagnosis and prognosis decoded by blood-based circulating microRNA signatures. Frontiers in Genetics. 2013;4, article 116 doi: 10.3389/fgene.2013.00116. [DOI] [PMC free article] [PubMed] [Google Scholar]
- 15.Gong J, Li J, Wang Y, et al. Characterization of microRNA-29 family expression and investigation of their mechanistic roles in gastric cancer. Carcinogenesis. 2014;35(2):497–506. doi: 10.1093/carcin/bgt337. [DOI] [PubMed] [Google Scholar]
- 16.Pan HW, Li SC, Tsai KW. MicroRNA dysregulation in gastric cancer. Current Pharmaceutical Design. 2013;19(7):1273–1284. doi: 10.2174/138161213804805621. [DOI] [PubMed] [Google Scholar]
- 17.Wang J, Wang Q, Liu H, Hu B, Zhou W, Cheng Y. MicroRNA expression and its implication for the diagnosis and therapeutic strategies of gastric cancer. Cancer Letters. 2010;297(2):137–143. doi: 10.1016/j.canlet.2010.07.018. [DOI] [PubMed] [Google Scholar]
- 18.Kim YH, Liang H, Liu X, et al. AMPKalpha modulation in cancer progression: multilayer integrative analysis of the whole transcriptome in Asian gastric cancer. Cancer Research. 2012;72(10):2512–2521. doi: 10.1158/0008-5472.CAN-11-3870. [DOI] [PMC free article] [PubMed] [Google Scholar]
- 19.Wang Y, Rekaya R. LSOSS: detection of cancer outlier differential gene expression. Biomarker Insights. 2010;2010(5):69–78. doi: 10.4137/bmi.s5175. [DOI] [PMC free article] [PubMed] [Google Scholar]
- 20.Karrila S, Lee JHE, Tucker-Kellogg G. A comparison of methods for data-driven cancer outlier discovery, and an application scheme to semisupervised predictive biomarker discovery. Cancer Informatics. 2011;10:109–120. doi: 10.4137/CIN.S6868. [DOI] [PMC free article] [PubMed] [Google Scholar]
- 21.Zhang W, Zang J, Jing X, et al. Identification of candidate miRNA biomarkers from miRNA regulatory network with application to prostate cancer. Journal of Translational Medicine. 2014;12, article 66 doi: 10.1186/1479-5876-12-66. [DOI] [PMC free article] [PubMed] [Google Scholar]
- 22.Chen J, Zhang D, Zhang W, et al. Clear cell renal cell carcinoma associated microRNA expression signatures identified by an integrated bioinformatics analysis. Journal of Translational Medicine. 2013;11, article 169 doi: 10.1186/1479-5876-11-169. [DOI] [PMC free article] [PubMed] [Google Scholar]
- 23.Huang J, Sun Z, Yan W, et al. Identification of microRNA as sepsis biomarker based on miRNAs regulatory network analysis. BioMed Research International. 2014;2014:12 pages. doi: 10.1155/2014/594350.594350 [DOI] [PMC free article] [PubMed] [Google Scholar]
- 24.Warnes GR, Bolker B, Bonebakker L, et al. gplots: various R 12 programming tools for plotting data. The Comprehensive R Archive Network. R Package Version 2.6.0, http://cran.r-project.org/package=gplots.
- 25.Huang DW, Sherman BT, Lempicki RA. Systematic and integrative analysis of large gene lists using DAVID bioinformatics resources. Nature Protocols. 2009;4(1):44–57. doi: 10.1038/nprot.2008.211. [DOI] [PubMed] [Google Scholar]
- 26.Huang DW, Sherman BT, Lempicki RA. Bioinformatics enrichment tools: paths toward the comprehensive functional analysis of large gene lists. Nucleic Acids Research. 2009;37(1):1–13. doi: 10.1093/nar/gkn923. [DOI] [PMC free article] [PubMed] [Google Scholar]
- 27.Sacconi A, Biagioni F, Canu V, et al. miR-204 targets Bcl-2 expression and enhances responsiveness of gastric cancer. Cell Death & Disease. 2012;3, aticle e423 doi: 10.1038/cddis.2012.160. [DOI] [PMC free article] [PubMed] [Google Scholar]
- 28.Zhang L, Wang X, Chen P. MiR-204 down regulates SIRT1 and reverts SIRT1-induced epithelial-mesenchymal transition, anoikis resistance and invasion in gastric cancer cells. BMC Cancer. 2013;13, article 290 doi: 10.1186/1471-2407-13-290. [DOI] [PMC free article] [PubMed] [Google Scholar]
- 29.Li X, Zhang Y, Zhang Y, Ding J, Wu K, Fan D. Survival prediction of gastric cancer by a seven-microRNA signature. Gut. 2010;59(5):579–585. doi: 10.1136/gut.2008.175497. [DOI] [PubMed] [Google Scholar]
- 30.Cai C, Ashktorab H, Pang X, et al. MicroRNA-211 expression promotes colorectal cancer cell growth in vitro and in vivo by targeting tumor suppressor CHD5. PLoS ONE. 2012;7(1) doi: 10.1371/journal.pone.0029750.e29750 [DOI] [PMC free article] [PubMed] [Google Scholar]
- 31.Margue C, Philippidou D, Reinsbach SE, Schmitt M, Behrmann I, Kreis S. New target genes of MITF-induced microRNA-211 contribute to melanoma cell invasion. PLoS ONE. 2013;8(9) doi: 10.1371/journal.pone.0073473.e73473 [DOI] [PMC free article] [PubMed] [Google Scholar]
- 32.Chu TH, Yang CC, Liu CJ, Lui MT, Lin SC, Chang KW. miR-211 promotes the progression of head and neck carcinomas by targeting TGFbetaRII. Cancer Letters. 2013;337(1):115–124. doi: 10.1016/j.canlet.2013.05.032. [DOI] [PubMed] [Google Scholar]
- 33.Pizzini S, Bisognin A, Mandruzzato S, et al. Impact of microRNAs on regulatory networks and pathways in human colorectal carcinogenesis and development of metastasis. BMC Genomics. 2013;14, article 589 doi: 10.1186/1471-2164-14-589. [DOI] [PMC free article] [PubMed] [Google Scholar]
- 34.Guo P, Lan J, Ge J, Nie Q, Mao Q, Qiu Y. miR-708 acts as a tumor suppressor in human glioblastoma cells. Oncology Reports. 2013;30(2):870–876. doi: 10.3892/or.2013.2526. [DOI] [PubMed] [Google Scholar]
- 35.Fayyad-Kazan H, Bitar N, Najar M, et al. Circulating miR-150 and miR-342 in plasma are novel potential biomarkers for acute myeloid leukemia. Journal of Translational Medicine. 2013;11, article 31 doi: 10.1186/1479-5876-11-31. [DOI] [PMC free article] [PubMed] [Google Scholar]
- 36.Motoyama K, Inoue H, Nakamura Y, Uetake H, Sugihara K, Mori M. Clinical significance of high mobility group A2 in human gastric cancer and its relationship to let-7 MicroRNA family. Clinical Cancer Research. 2008;14(8):2334–2340. doi: 10.1158/1078-0432.CCR-07-4667. [DOI] [PubMed] [Google Scholar]
- 37.Tang Y, Yan W, Chen J, Luo C, Kaipia A, Shen B. Identification of novel microRNA regulatory pathways associated with heterogeneous prostate cancer. BMC Systems Biology. 2013;7(3):1–9. doi: 10.1186/1752-0509-7-S3-S6. [DOI] [PMC free article] [PubMed] [Google Scholar]
- 38.Giovannetti E, van der Velde A, Funel N, et al. High-throughput microRNA (miRNAs) arrays unravel the prognostic role of MiR-211 in pancreatic cancer. PLoS ONE. 2012;7(11) doi: 10.1371/journal.pone.0049145.e49145 [DOI] [PMC free article] [PubMed] [Google Scholar]
- 39.Yu J, Li A, Hong SM, Hruban RH, Goggins M. MicroRNA alterations of pancreatic intraepithelial neoplasias. Clinical Cancer Research. 2012;18(4):981–992. doi: 10.1158/1078-0432.CCR-11-2347. [DOI] [PMC free article] [PubMed] [Google Scholar]
- 40.Kahlert C, Klupp F, Brand K, et al. Invasion front-specific expression and prognostic significance of microRNA in colorectal liver metastases. Cancer Science. 2011;102(10):1799–1807. doi: 10.1111/j.1349-7006.2011.02023.x. [DOI] [PubMed] [Google Scholar]
- 41.Sugimura K, Miyata H, Tanaka K, et al. Let-7 expression is a significant determinant of response to chemotherapy through the regulation of IL-6/STAT3 pathway in esophageal squamous cell carcinoma. Clinical Cancer Research. 2012;18(18):5144–5153. doi: 10.1158/1078-0432.CCR-12-0701. [DOI] [PubMed] [Google Scholar]
- 42.Shinto O, Yashiro M, Toyokawa T, et al. Phosphorylated Smad2 in advanced stage gastric carcinoma. BMC Cancer. 2010;10, article 652 doi: 10.1186/1471-2407-10-652. [DOI] [PMC free article] [PubMed] [Google Scholar]
- 43.Kano MR, Bae Y, Iwata C, et al. Improvement of cancer-targeting therapy, using nanocarriers for intractable solid tumors by inhibition of TGF-β signaling. Proceedings of the National Academy of Sciences of the United States of America. 2007;104(9):3460–3465. doi: 10.1073/pnas.0611660104. [DOI] [PMC free article] [PubMed] [Google Scholar]
- 44.Mishra L, Katuri V, Evans S. The role of PRAJA and ELF in TGF-beta signaling and gastric cancer. Cancer Biology & Therapy. 2005;4(7):694–699. doi: 10.4161/cbt.4.7.2015. [DOI] [PubMed] [Google Scholar]
Associated Data
This section collects any data citations, data availability statements, or supplementary materials included in this article.
Supplementary Materials
Additional File 1: Clinical information for 25 samples, including sex, age, GC type and histologic type.
Additional File 2: GC Specific miRNA-mRNA Network.
Additional File 3: Enriched Functional Themes for Target Genes of Candidate miRNAs.
Additional File 4: Enriched MetaCore Pathways and Constituent GC-Related Objects.