
Fig. 3.
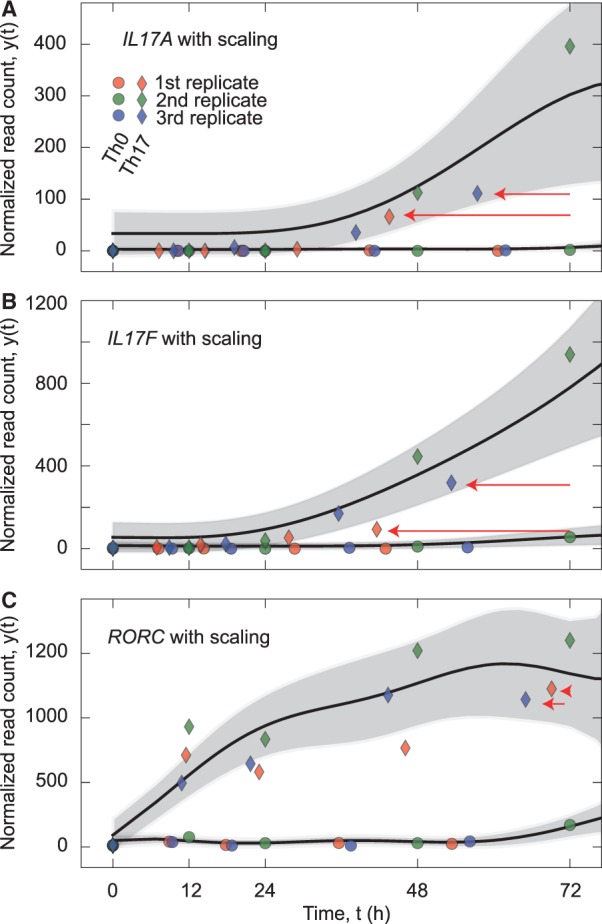
Perturbated differentiation dynamics. (A) The estimated smooth representation of IL17A dynamics with the time scaling. The red arrows illustrate how much the measurements are effectively moved due to the time scaling. (B and C) Same as (A), but the depicted results are for the IL17F and RORC genes