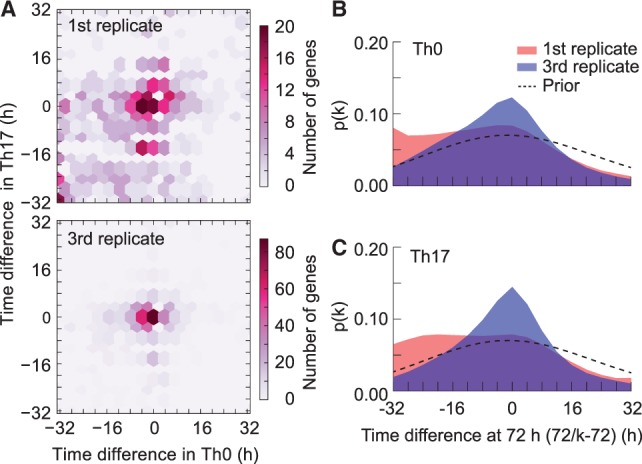
Fig. 5.

The replicate-specific differentiation efficiencies. (A) Density plots representing the distribution of estimated time differences in gene level in the Th0 and Th17 lineages. A gene is on diagonal if the estimated time differences in the Th0 and Th17 cells are the same. The results for the first and third replicate are depicted in top panel and bottom panel, respectively. (B) Presence of time scaling in Th0 lineage among the 698 differentially expressed genes. The dashed line represents the prior distribution of the amount of time scaling at 72 h. The red area shows the posterior distribution of the time scaling for the first replicate and the purple shows the posterior distribution for the third replicate. (C) Same as (B) but here the focus is on Th17 lineage. The focus is on the differentially expressed genes in (B and C)
