

Abstract
Motivation: Currently there are no curative anticancer drugs, and drug resistance is often acquired after drug treatment. One of the reasons is that cancers are complex diseases, regulated by multiple signaling pathways and cross talks among the pathways. It is expected that drug combinations can reduce drug resistance and improve patients’ outcomes. In clinical practice, the ideal and feasible drug combinations are combinations of existing Food and Drug Administration-approved drugs or bioactive compounds that are already used on patients or have entered clinical trials and passed safety tests. These drug combinations could directly be used on patients with less concern of toxic effects. However, there is so far no effective computational approach to search effective drug combinations from the enormous number of possibilities.
Results: In this study, we propose a novel systematic computational tool DrugComboRanker to prioritize synergistic drug combinations and uncover their mechanisms of action. We first build a drug functional network based on their genomic profiles, and partition the network into numerous drug network communities by using a Bayesian non-negative matrix factorization approach. As drugs within overlapping community share common mechanisms of action, we next uncover potential targets of drugs by applying a recommendation system on drug communities. We meanwhile build disease-specific signaling networks based on patients’ genomic profiles and interactome data. We then identify drug combinations by searching drugs whose targets are enriched in the complementary signaling modules of the disease signaling network. The novel method was evaluated on lung adenocarcinoma and endocrine receptor positive breast cancer, and compared with other drug combination approaches. These case studies discovered a set of effective drug combinations top ranked in our prediction list, and mapped the drug targets on the disease signaling network to highlight the mechanisms of action of the drug combinations.
Availability and implementation: The program is available on request.
Contact: stwong@tmhs.org
1 INTRODUCTION
Cancers are complex diseases regulated by interactions of multiple signaling pathways interacting with each other. Though there are some anticancer drugs, they are often not curative and associated with acquired drug resistance. It is believed that a single drug can target only one disease signaling module, whereas alternative signaling pathways will be activated to maintain tumor development. For example, in melanoma, the selective BRAF inhibitor, PLX4032, can induce tumor responses in the majority of patients with BRAF V600E mutant melanoma, but the duration of this response is limited owing to the development of acquired resistance, which may be due to alternative pathways parallel to the ‘BRAF-MEK-ERK’ signaling pathway (Johannsen et al., 2013; Nazarian et al., 2010). To reduce the drug resistance effect, and improve cancer treatment outcomes, drug combinations are considered as an optimal option.
The ideal drug combinations expected by clinicians are combinations of Food and Drug Administration (FDA)-approved drugs or existing bioactive compounds that have entered clinical trials and passed safety tests. These drug combinations could be used by patients without toxic side effects. Drug combination prediction has been a challenging task in computational biology, despite a few studies in the area. The genetic algorithm was, for example, proposed to find the optimal combinations of a small number of drugs based on the experimental results (Zinner et al., 2009). The method, however, is not able to identify optimal drug combinations from a large set of drugs, as it requires experimental validations in the prediction process. The machine learning-based approach was proposed to classify drugs into combinations based on molecular and pharmacological features of drugs (Zhao et al., 2011). However, the features of drugs are too general to be informative, and the method does not integrate the rich genomic profiles of drugs and disease into consideration. Combinatorial Drug Assembler (CDA) was developed to identify drug combinations based on enrichment analysis of genomic profile data. However, the enrichment analysis implemented in the method is based on differentially expressed genes, disease driver genes are not clearly defined, so that drugs targeting the causal dysfunctional signaling modules of disease maybe missed out (Lee et al., 2012). To overcome the aforementioned problems, we propose a novel computational tool, DrugComboRanker, for predicting drug combinations targeting multiple signaling modules of cancer-specific networks through integrative analysis of genomic profiles of both drugs and cancers.
2 MATERIALS AND METHODS
2.1 Overview of DrugComboRanker
This study seeks to answer a clinical question that which drugs can be combined with existing therapy to reduce drug resistance and improve patients’ outcomes. We have thus developed a novel tool, DrugComboRanker, to prioritize drug combinations and uncover the underlying mechanisms of action. The approach is designed based on the following two observations. First, dysfunctional signaling networks of diseases are complex and stable, and effective drug combinations can inhibit major modules of the networks simultaneously. Second, drugs often have multiple active target genes or proteins. Grouping targets of drugs with similar transcriptional responses profiles allows better recovery of their targeted signaling modules in disease than based on individual targets alone. Figure 1 is an overview of the proposed DrugComboRanker. The drug functional network is firstly reconstructed based on genomic profiling data of drugs that are available in the Connectivity Map (CMAP) database. The Bayesian non-negative matrix factorization with the β-divergence (BNMFβD; Tan and Fevotte, 2013) approach is conducted to partition the drug functional network into connected functional communities, whose targets indicate the inhibited signaling modules of diseases. On the other hand, the dysfunctional signaling modules of diseases are reconstructed by integrating disease genomics data and protein interactome data. Drug combinations are then ranked from different drug functional communities, which inhibit disease signaling network modules.
Fig. 1.
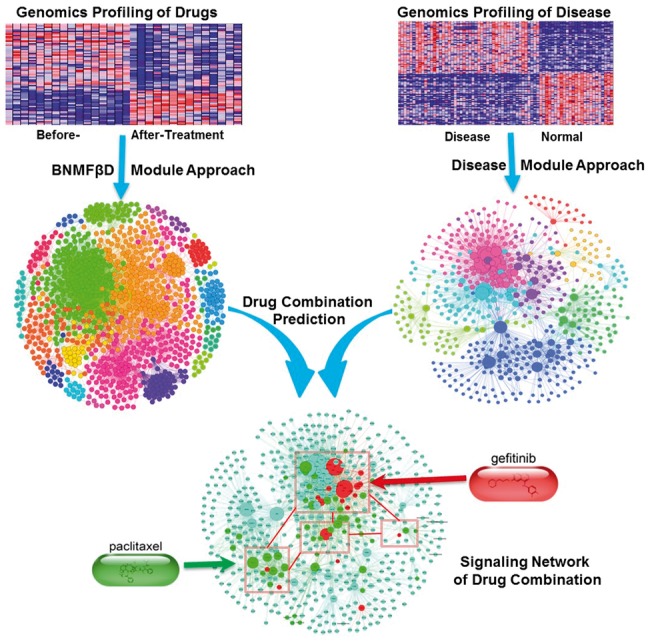
Overview of the DrugComboRanker for prioritizing disease-specific drug combinations
2.2 Drug functional network reconstruction
The aim of drug function network reconstruction is to identify drug communities that share common transcriptional responses to drug treatment. We reconstruct, the drug functional network based on the data of the CMAP (CMap, build 02; Lamb et al., 2006), which consists of 6100 gene expression profiles of four cancer cell lines (MCF7, PC3, HL60 and SKMEL5) treated by 1309 drugs at different doses. We first combine the similarity metric proposed in (Iorio et al., 2010) with the metric defined in the STITCH database (Kuhn et al., 2012) as a new drug similarity metric as follows. First, for each individual drug at each dose, genes are ranked based on their fold changes (drug treatment versus control). Then, gene rank lists at different doses are merged into one gene rank list by using a hierarchical majority voting scheme (Iorio et al., 2010). The merging procedure first compares gene rank lists using the Spearman’s Footrule similarity metric (Diaconis and Graham, 1977), and then the two most similar lists are merged repeatedly by using the Borda Merging strategy (Lin, 2010). Consequently, gene signatures for individual drugs are created by optimally selecting the top- and bottom-ranked 250 genes, respectively. This size of these signatures is heuristically determined as described in (Iorio et al., 2010). Finally, the gene set enrichment analysis (Subramanian et al., 2005) score, , is used as the dissimilarity metric between drug i and drug j. A threshold T = 0.7848 (the third quantile of the empirical probability distribution of the drug dissimilarity metric) is given to remove the non-significant dissimilarities as follows:
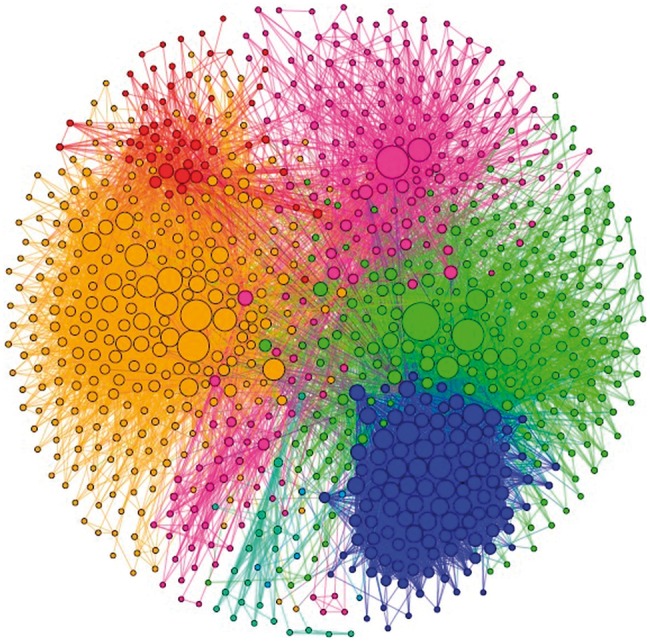
Then we convert the dissimilarity into the normalized similarity score, as and where denotes all the connection scores linking to the i-th node. Here, we empirically set . In addition to the similarity of transcriptional responses, a different similarity metric, , was defined in STITCH database (Kuhn et al., 2012) by integrating a combined score of structure similarity, experimental similarity and text mining similarity score. The structure similarity is defined by the Tanimoto 2D chemical similarity scores (Martin et al., 2002). The experimental similarity is calculated by the Pearson correlation of the activity patterns of the compounds based on NCI60 screens. The text mining similarity is computed by mining the curated database, such as OMIM and MEDLINE, using a co-occurrence scheme and a natural language processing approach (Jensen et al., 2006; Šarić et al., 2006). In this study, we combine the two similarity metrics as . The rational to use the combined similarity is to generate better drug community structure when applying the clustering algorithm on the drug functional network. Finally, a drug functional network is reconstructed with 1308 nodes and 51 164 edges. Figure 2 shows an example of the reconstructed drug functional network community.
Fig. 2.
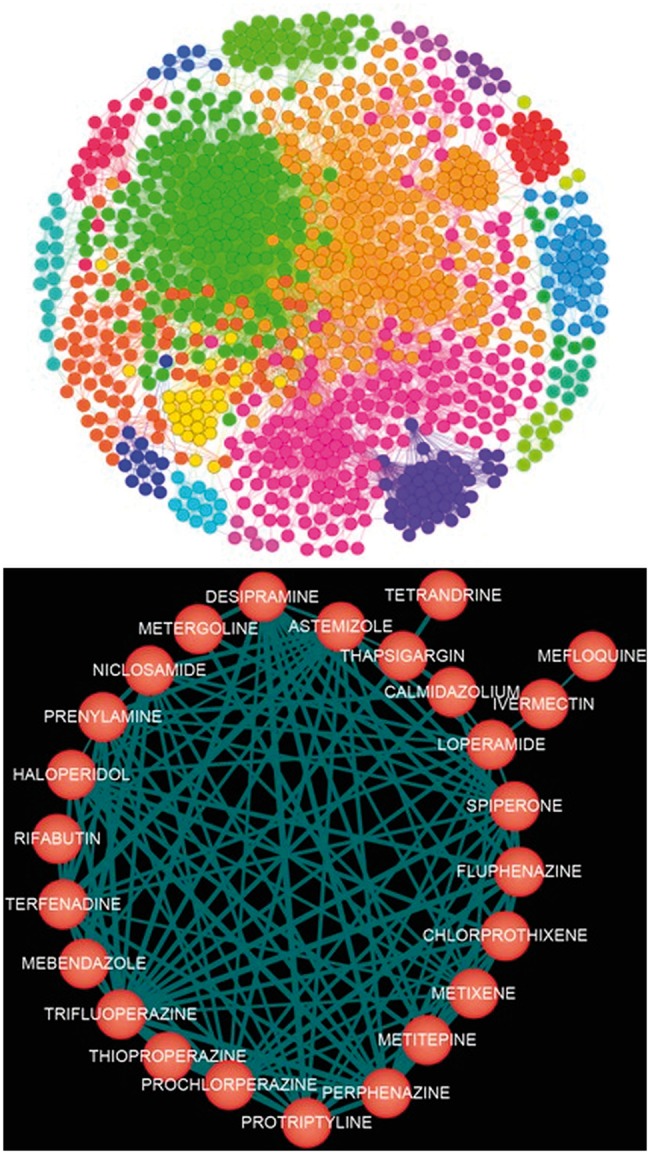
Snapshots of the drug functional network (top) and an example of the reconstructed drug network community (bottom)
2.3 Drug community discovery by using Bayesian non-negative matrix factorization with β-divergence
Next, we partition the reconstructed drug functional network into communities (modules) within which drugs share common mechanisms of action (targeting the same or related signaling modules), as illustrated in Figure 2. We use the BNMFβD (Tan and Fevotte, 2013) for the network partition. The algorithm has shown good partition results on various classes of real-world signals such as audio and images (Tan and Fevotte, 2013), Specifically, the algorithm can (i) enable soft partitioning (one drug can be partitioned into multiple communities with different membership scores); (ii) reduce noise influence (suppresses noise in the high dimensional space); and (iii) allow multi-scale partition. To the best of our knowledge, the algorithm is for the first time used in drug functional network partition.
Specifically, given a weighted undirected network with N nodes, let denote its adjacent matrix. BNMFβD factorizes the matrix V into two low-rank matrices:
| (1) |
where W and H are non-negative matrices with dimensions and , and the elements of V, , W and H are denoted by , , and , respectively. The k-th column of W is denoted by and the k-th row of H is denoted by . The W is normalized to , that is, each row of is subject to
| (2) |
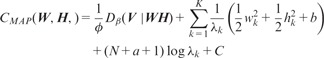
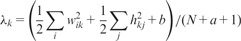
where is the element of and it quantifies the membership of node i with respect to community j. To infer the appropriate model order K, we use a Bayesian paradigm for non-negative matrix factorization by placing automatic relevance determination priors with scale hyper-parameters on the variables and . In this model, the distribution of is parameterized by fixed parameters a and b, and the fixed parameter β decides the distance measure between the observed interactions and the expected interactions . Under these assumptions, the posterior density function can be obtained as
| (3) |
Maximizing the posterior density is equivalent to minimizing the negative log posterior, which can be regarded as a loss function as
| (4) |
| (5) |
where is the log-likelihood.
The generalized β-divergence is defined by
| (6) |
The β-divergence can be regarded as a minus log-likelihood for the Tweedie distribution and its probability density function is given by
| (7) |
where is the base measure function, μ is the mean, ϕ is the dispersion parameter and β is the shape parameter. Assuming that is generated from the Tweedie distribution, the log-likelihood function can be given by
| (8) |
To insure W and H are non-negative, the Half-Normal priors are assigned on them,
| (9) |
| (10) |
| (11) |
and place an inverse Gamma priors on each ,
| (12) |
Then, according to Equation (5), the objective function can be given as
 |
(13) |
To minimize with respect to W, H and λ, we adopt the strategy in (Tan and Fevotte, 2013) by introducing a local majorization–minimization algorithm with efficient multiplicative updates. Finally, we give the overlapping community detection algorithm as follows:
Step 1: Initialize and to random non-negative values.
- Step 2: Update W, H and by
Step 3: Repeat Step 2 until
Step 4: Normalize W to , then the number of non-zero columns of is the number of clusters. Assign each node to the clusters according to . In the above algorithm, denotes element-by-element multiplication of X and Y; denotes element-by-element division of X and Y; and denotes raising each element of X to the power. In addition, denotes the matrix with each column being the vectorλ. Using the BNMFβD approach, we partition the drug functional network into a set of connected network modules (Fig. 2), within which drugs share common targets or related signaling mechanisms.
2.4 Drug combination discovery based on target network analysis
The novel drug combination approach consists of the following three major components.
(a) Disease specific signaling network reconstruction
Several approaches (Barrenäs et al., 2012; Chuang et al., 2007; Ideker et al., 2002) have been proposed to reconstruct signaling networks of diseases based on transcritpome and interactome data. In this study, the approach proposed in (Barrenäs et al., 2012) is used. The integrated protein–protein interactions from BioGRID (Stark et al., 2006) and the manually curated human cancer signaling from (Awan et al., 2007; Cui et al., 2007; Li et al., 2012; Newman et al., 2013) (available at http://www.bri.nrc.ca/wang/) are clustered into functional protein–protein modules, and each module is tested for enrichment (Fisher’s exact test, ) of the differentially expressed genes of the gene expression profile of a disease. The enriched modules are then considered as disease susceptibility modules, from which the highly interconnected genes are identified as the disease-specific signaling network. Figure 3 shows the reconstructed signaling network of lung adenocarcinoma.
Fig. 3.
The reconstructed signaling network of lung adenocarcinoma. Different node colors indicate different modules, and the node size indicates the degree of nodes
(b) Functional drug target prediction using network-based recommendation
Drugs often have multiple targets and affect distinct signaling modules, but only parts of them are known for given drugs. The drug communities embed targeting signaling modules (functional targets instead of physical targets) of drugs. To uncover the targeting signaling modules of drugs, we propose a network-based recommendation approach as follows. Let denote drugs in a given community, and be the known drug targets. The drug–target interaction network can be described as a bipartite graph . The E indicates the known drug and target associations. This drug–target network can be represented by an adjacent matrix , where is the weight that quantifies the association between and . Then the novel network-based algorithm is designed based on a bipartite network projection technique (Zhou et al., 2010) as follows.
| (14) |
where is the recommendation score (the functional association possibility between drug i and target j). The indicates the transition matrix from drug i to drug j and is defined as:
| (15) |
where and is the degree of the x node in the bipartite network. Targets with recommendation scores greater than given threshold, 0.1, are kept as the active functional targets of given drugs.
(c) Disease-specific drug combination discovery
With the constructed disease signaling network and the predicted drug targets, drug combinations are then prioritized by combining the following synergistic scores. Given two candidate drugs, and , from different clusters, suppose and , and denote the targets of in , and denote the targets of in . The first synergistic score is defined as follows.
| (16) |
where is the centrality score of target in the reconstructed disease signaling network, and it is an additive of betweenness , closeness (Brandes and Fleischer, 2005) and PageRank (Pr) score (Page et al., 1999) of protein , that is
| (17) |
These are three different but correlated centrality measurements, and the reason of combing them is to get a robust centrality score. The is the minimum shortest path from to . The first synergistic score, , prefers drug combinations, whose targets are in the center (hubs) of disease signaling network and closely connected.
The second synergistic score is defined as
| (18) |
where is the semantic similarity of gene ontology (GO) annotations of and (Couto et al., 2007), which is computed based on the overlap of the GO terms that are associated with and , and is defined as
| (19) |
Where is the GO term that associated with , and A is a GO term that is an ancestor of both and , and
| (20) |
is the frequency of GO term occurring in GO annotations, which are taken from GO database. is the maximum occurrences frequency of GO terms that are associated with all the targets and the predicted drug targets in the GO annotations. The second synergistic score, , prefers drug combinations that block genes with similar functions, e.g. cell proliferation.
Finally, the synergistic score of drug and is given by
| (21) |
where
| (22) |
where reflects the distance of their expression pattern. In summary, drug combinations targeting on the disease-specific signaling network, with similar functions, through alternative targets are prioritized.
3 RESULTS
We have applied the BNMFβD algorithm to cluster the drug–drug network into overlapping drug communities. Table 1 lists the parameters in the analysis. We set a as one of {10,50,100,150,200,250,300,350,400,450}, and b to be equal to a. When a and b are set to be 450, the BNMFβD algorithm will converge more quickly. Under this setting of a and b, we test the drug network community reconstruction results with different K and β, as K = {100,110,120,130,140,150,160,170} and . When K is 150 and β is 1, we get better drug community structures in terms of the following defined community quality measurements. We assign the number from 1 to 150 to each drug community, and obtain the drug–target networks by connecting the drugs in the same community through their targets. The connected drug–target networks provide us a useful way to drug discovery.
Table 1.
The values of parameters in BNMFβD algorithm
| Parameters | Values |
|---|---|
| K | 150 |
| β | 1 |
| a = b | 450 |
| ε | 10−5 |
3.1 Quality evaluation of predicted drug community
To evaluate the proposed approach, we compared it with three widely used network partition approaches: Markov cluster (MCL; Enright et al., 2002), affinity propagation (AP; Frey and Dueck, 2007) and CluterONE (Nepusz et al., 2012). To evaluate the quality of the predicted drug community, the following three metrics are defined. The average enrichment score, , is defined as where , Pi is the number of drug pairs sharing targets in the i-th drug community, is the number of drugs of that drug community and N is the number of drug community. Higher value indicates more drugs in the same community sharing common targets. The metric, , is defined as the relative number of well-connected drug communities , where |.| is the number of elements, and d is a given threshold. The geometric accuracy metric, , is defined as the balance of the two metrics: . The comparison result shown in Figure 4 shows that the proposed method outperforms the other three methods in terms of all three metrics with .
Fig. 4.
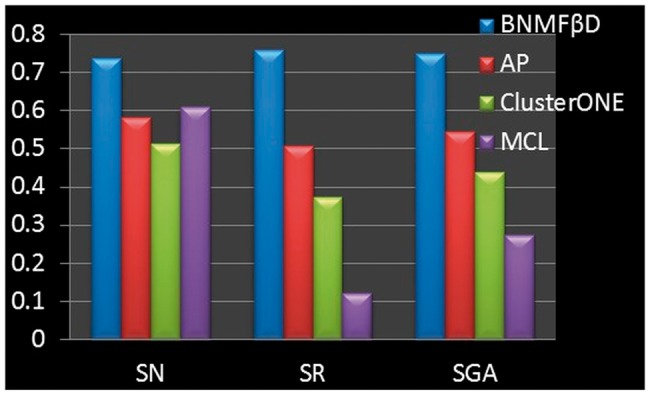
The comparison results of the proposed method (referred to as BNMF βD) with AP, ClusterONE and MCL according to the quality of the predicted drug communities in terms of SN, SR and SGA
3.2 Drug combination prediction evaluation
To evaluate the prediction capacity of DrugComboRanker, we apply it on the lung adenocarcinoma and endocrine receptor (ER) positive breast cancer. The 107 lung adenocarcinoma patient samples (58 lung tumor tissues and 49 normal lung tissues, GDS3257) were collected to reconstruct the lung adenocarcinoma-specific signaling network, as shown in Figure 3. This signaling network consists of 905 genes and 11 282 interactions. Based on the signaling network, we predict effective drugs that have synergistic effects combined with three drugs (Gefitinib, Paclitaxel and LY-294002) given by our clinicians. Level 3 gene expression data of 222 ER positive breast invasive carcinoma (BRCA) samples and 61 normal breast samples were collected from TCGA. The synergistic drug combination with two FDA-approved drugs, Tamoxifen and Letrozole, are further predicted for ER-positive BRCA based on the reconstructed ER-positive breast cancer signaling network.
To validate the prediction results, we searched the literature evidence of the top 50 ranked combinations. Tables 2–4 show the literature evidence of the effective drug combinations in our top 50 lists for lung adenocarcinoma. Surprisingly, 19 different drug combinations have been reported to be synergistic combining with Gefitinib, Paclitaxel and LY-294002 in non–small-cell lung cancer. Tables 5 and 6 show the literature evidence of effective drug combinations in the top 50 lists for ER-positive breast cancer. Also 14 different drug combinations have been reported to be synergistic combining with Tamoxifen and Letrozole. These results show the strong drug combination prediction capacity of DrugComboRanker.
Table 2.
Synergistic alternative drugs combining with Gefitinib
| Drug combination (Community number) | Synergistic score | Rank | Literature evidence |
|---|---|---|---|
| Gefitinib/Paclitaxel (63/55) | 2.905 | 2 | PMID:19596955 |
| PMID:14990633 | |||
| Gefitinib/Celecoxib (63/48) | 2.804 | 3 | PMID:18379355 |
| PMID:16914589 | |||
| Gefitinib/Genistein (63/102) | 2.765 | 4 | PMID:22160570 |
| Gefitinib/Fulvestrant (63/55) | 2.529 | 9 | PMID:24268810 |
| Gefitinib/Irinotecan (63/66) | 2.468 | 11 | PMID:21915126 |
| PMID:16713012 | |||
| Gefitinib/Vorinostat (63/102) | 2.464 | 12 | PMID:21271222 |
| Gefitinib/Lovastatin (63/34) | 2.102 | 27 | PMID:19760159 |
| Gefitinib/Rosiglitazome (63/13) | 2.023 | 32 | PMID:168386327 |
| Gefitinib/MS-275(63/102) | 2.007 | 34 | PMID:16424029 |
Table 3.
Synergistic alternative drugs combining with LY-294002
| Drug combination (Community number) | Synergistic score | Rank | Literature evidence |
|---|---|---|---|
| LY-294002/Quercetin (55/140) | 2.987 | 2 | PMID:14688022 |
| LY-294002/SB-202190(55/5) | 2.936 | 3 | PMID:16115952 |
| LY-294002/Rapamycin(55/54) | 2.448 | 33 | PMID:22355375 |
Table 4.
Synergistic alternative drugs combining with Paclitaxel
| Drug combination (Community number) | Synergistic score | Rank | Literature evidence |
|---|---|---|---|
| Paclitaxel/Irinotecan(55/66) | 3.096 | 2 | PMID:16251879 |
| Paclitaxel/Gefitinib(55/63) | 2.905 | 8 | PMID:19596955 |
| PMID:14990633 | |||
| Paclitaxel/Vorinostat(55/102) | 2.901 | 9 | PMID:19621389 |
| Paclitaxel/Rapamycin(55/54) | 2.888 | 11 | PMID:22896668 |
| Paclitaxel/Vinblastine(55/137) | 2.681 | 17 | PMID:16193638 |
| Paclitaxel/Ifosfamide(55/90) | 2.377 | 25 | PMID:8740798 |
| Paclitaxel/SuraminSodium (55/3) | 2.189 | 37 | PMID:11507065 |
| Paclitaxel/Resveratrol(55/48) | 2.060 | 49 | PMID:14666716 |
Table 5.
Synergistic alternative drugs combining with Tamoxifen
| Drug combination (Community number) | Synergistic score | Rank | Literature evidence |
|---|---|---|---|
| Tamoxifen/Tretinoin(49/55) | 2.913 | 8 | PMID:9533531 |
| Tamoxifen/Genistein(49/102) | 2.910 | 9 | PMID:17295235 |
| Tamoxifen/Quercetin(49/140) | 2.831 | 12 | PMID:20804812 |
| Tamoxifen/Verapamil(49/66) | 2.776 | 19 | PMID:8185686 |
| Tamoxifen/Mifepristone(49/66) | 2.721 | 21 | PMID:9879777 |
| Tamoxifen/Celecoxib(49/48) | 2.437 | 29 | PMID:23731702 |
| Tamoxifen/Resveratrol(49/48) | 2.416 | 31 | PMID:23896596 |
| Tamoxifen/Letrozole(49/92) | 2.299 | 36 | PMID:15026471 |
| Tamoxifen/Exemestane(49/51) | 2.136 | 42 | PMID:21247627 |
| Tamoxifen/LY-294002(49/55) | 2.035 | 46 | PMID:12479367 |
Table 6.
Synergistic alternative drugs combining with Letrozole
| Drug combination (Community number) | Synergistic score | Rank | Literature evidence |
|---|---|---|---|
| Letrozole/Fulvestrant(92/55) | 2.457 | 8 | PMID:15958593 |
| Letrozole/Tamoxifen(92/49) | 2.300 | 10 | PMID:15026471 |
| Letrozole/Metformin(92/56) | 2.148 | 15 | NCT01589367 |
| Letrozole/Celecoxib(92/48) | 2.128 | 16 | PMID:19254941 |
| Letrozole/Imatinib(92/55) | 1.765 | 40 | NCT00338728 |
To make the evaluation fair and sound, we further compared the predicted results with CDA, and a random combination method (RCM), which randomly picks up 50 drugs from the available drug lists to combine with the designated drugs. As for CDA, we picked the top 50 drug combinations with the designated drugs. Figures 5 and 6 show the comparison results on the lung adenocarcinoma and ER-positive breast cancer in terms of literature supports of those top-ranked 50 drug combinations, respectively (The numbers on the bars of RCM are standard deviations). For RCM, we repeated the random selection 100 times; for each simulation, we checked the literature evidence (In total, we checked all the 5000 random combinations). As can be seen, the proposed approach outperforms the CDA and random selection significantly.
Fig. 5.
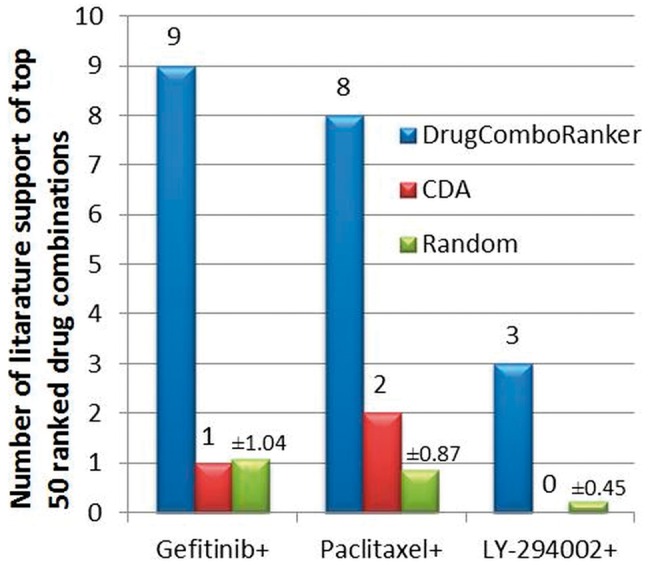
The comparison results of DrugComboRanker, CDA and RCM in terms of the number of literature supports of the top-ranked 50 drug combinations of lung adenocarcinoma with designated drugs, Gefitinib, Paclitaxel and LY-294002
Fig. 6.
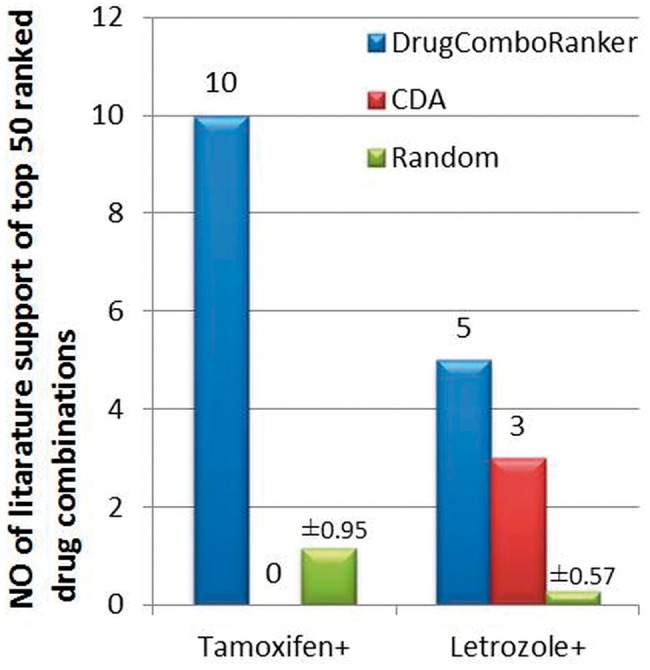
The comparison results of DrugComboRanker, CDA and RCM in terms of the number of literature supports of the top-ranked 50 drug combinations of ER-positive breast cancer with designated drugs, Tamoxifen and Letrozole
The predicted drug targets in the disease-specific network could indicate the molecular mechanism of synergistic drug combinations. Here, we map the responsive genes of Gefitinib, Paclitaxel, Vorinostat, LY-294002 and Quercetin to the lung adenocarcinoma-specific signaling network to capture the distinct synergistic responses induced by three agent combinations, Gefitinib and Paclitaxel, LY-294002 and Quercetin, Gefitinib and Vorinostat. As shown in Figure 7, Gefitinib and Paclitaxel combinations can affect the EGFR signaling pathway (endothelial cell proliferation), TP53 signaling pathways, as well as biological processes, such as cell cycle, apoptosis and the hub genes, i.e. EGFR, TP53, SRC, FOS, JUN. Distinctly the LY-294002 and Quercetin combination affects the alternative EGFR, PI3K-AKT and JAK-STAT3 pathways, as can be seen in Figure 8. In addition, the drug combination, Gefitinib and Celecoxib, targets the EGFR and COX-2 signaling pathways, respectively. The Gefitinib and Celecoxib have distinct transcriptional responses that indicate EGFR and COX-2 signaling pathways are complementary, and have cross talks. Another example is Gefitinib and Vorinostat combination. Vorinostat is a Histone deacetylases inhibitor, as shown in Figure 9, which interacts with CTNNB1, and CTNNB1 interacts with E-cadherin, ERBB2 and EGFR, whereas Gefitinib targets on EGFR. Thus, this combination forms a double inhibition on growth factors.
Fig. 7.

Drug targets mapped on the disease signaling network. Red and green are the drug targets of Gefitinib and Paclitaxel, respectively
Fig. 8.

Drug targets mapped on the disease signaling network. Red and green are the drug targets of LY-294002 and Quercetin, respectively; blue nodes are the weak effected targets of both drugs
Fig. 9.

Drug targets mapped on the disease signaling network. Red and green are the drug targets of Gefitinib and Vorinostat, respectively
4 DISCUSSION AND CONCLUSION
Drug combinations can provide an optimal cancer therapeutic treatment by overcoming acquired drug resistance. Clinicians usually choose drug combinations manually based on their experience and expertise. However, this expert-picking-based method cannot be scaled up for discovering drug combinations from a large set of drugs. The availability of genomic profiles of drugs and patients are informative for uncovering the regulatory signaling networks of cancers and the mechanisms of action of drugs. However, the computational tools are the bottleneck to interpret and convert the big genomics data into discovery of drug combinations. In this study, we propose a novel computational tool, DrugComboRanker, to prioritize drug combinations for specific cancers by selecting combinations targeting the alternative and complementary signaling modules of disease. We first predict the functional targets of drugs via the network community analysis of drug functional networks based on their genomic profiles. We then define the synergistic score of drug combinations that block key disease genes and their potential cross talks. The new method can also provide insights into mechanism of actions of drug combinations by mapping the predicted drug targets on the disease signaling network. In our case studies on lung adenocarcinoma and ER-positive breast cancer cases, a set of top-ranked drug combinations, with similar and distinct mechanisms of action, top-ranked in our prediction list have been reported to be effective in anticancer treatment. Moreover, a set of novel drug combinations are also identified with a better anticancer treatment outcome. In conclusion, the DrugComboRanker has the potential to be a widely used software package for predicting new disease-specific drug combinations.
ACKNOWLEDGEMENTS
The author would like to thank the helpful discussion with Drs Fredrik Barrenäs, Rui Zhu and Wen Bu.
Funding: CPRIT (RP110532) and NCI (U54 CA149196). Ting Tsung and Wei Fong Chao Foundation and John S Dunn Foundation
Conflict of Interest: none declared.
REFERENCES
- Awan A, et al. Regulatory network motifs and hotspots of cancer genes in a mammalian cellular signalling network. IET Syst. Biol. 2007;1:292–297. doi: 10.1049/iet-syb:20060068. [DOI] [PubMed] [Google Scholar]
- Barrenäs F, et al. Highly interconnected genes in disease-specific networks are enriched for disease-associated polymorphisms. Genome Biol. 2012;13:1–9. doi: 10.1186/gb-2012-13-6-r46. [DOI] [PMC free article] [PubMed] [Google Scholar]
- Brandes U, Fleischer D. centrality measures based on current flow. In: Diekert V, Durand B, editors. STACS 2005. Berlin, Heidelberg: Springer; 2005. pp. 533–544. [Google Scholar]
- Chuang HY, et al. Network-based classification of breast cancer metastasis. Mol. Syst. Biol. 2007;3:140. doi: 10.1038/msb4100180. [DOI] [PMC free article] [PubMed] [Google Scholar]
- Couto FM, et al. Measuring semantic similarity between Gene Ontology terms. Data Knowl. Eng. 2007;61:137–152. [Google Scholar]
- Cui Q, et al. A map of human cancer signaling. Mol. Syst. Biol. 2007;3:152. doi: 10.1038/msb4100200. [DOI] [PMC free article] [PubMed] [Google Scholar]
- Diaconis P, Graham RL. Spearman's Footrule as a measure of disarray. J. R. Stat. Soc. B Methodol. 1977;39:262–268. [Google Scholar]
- Enright AJ, et al. An efficient algorithm for large-scale detection of protein families. Nucleic Acids Res. 2002;30:1575–1584. doi: 10.1093/nar/30.7.1575. [DOI] [PMC free article] [PubMed] [Google Scholar]
- Frey BJ, Dueck D. Clustering by passing messages between data points. Science. 2007;315:972–976. doi: 10.1126/science.1136800. [DOI] [PubMed] [Google Scholar]
- Ideker T, et al. Discovering regulatory and signalling circuits in molecular interaction networks. Bioinformatics. 2002;18:S233–S240. doi: 10.1093/bioinformatics/18.suppl_1.s233. [DOI] [PubMed] [Google Scholar]
- Iorio F, et al. Discovery of drug mode of action and drug repositioning from transcriptional responses. Proc. Natl Acad. Sci. USA. 2010;107:14621–14626. doi: 10.1073/pnas.1000138107. [DOI] [PMC free article] [PubMed] [Google Scholar]
- Jensen LJ, et al. Literature mining for the biologist: from information retrieval to biological discovery. Nat. Rev. Genet. 2006;7:119–129. doi: 10.1038/nrg1768. [DOI] [PubMed] [Google Scholar]
- Johannsen S, et al. Sevoflurane is less sensitive than halothane for in vitro detection of malignant hyperthermia susceptibility. Acta Anaesthesiol. Scand. 2013;57:1161–1166. doi: 10.1111/aas.12171. [DOI] [PubMed] [Google Scholar]
- Kuhn M, et al. STITCH 3: zooming in on protein-chemical interactions. Nucleic Acids Res. 2012;40:D876–880. doi: 10.1093/nar/gkr1011. [DOI] [PMC free article] [PubMed] [Google Scholar]
- Lamb J, et al. The connectivity map: using gene-expression signatures to connect small molecules, genes, and disease. Science. 2006;313:1929–1935. doi: 10.1126/science.1132939. [DOI] [PubMed] [Google Scholar]
- Lee J-H, et al. CDA: combinatorial drug discovery using transcriptional response modules. PLoS One. 2012;7:e42573. doi: 10.1371/journal.pone.0042573. [DOI] [PMC free article] [PubMed] [Google Scholar]
- Li L, et al. The human phosphotyrosine signaling network: evolution and hotspots of hijacking in cancer. Genome Res. 2012;22:1222–1230. doi: 10.1101/gr.128819.111. [DOI] [PMC free article] [PubMed] [Google Scholar]
- Lin S. Space oriented rank-based data integration. Stat. Appl. Genet. Mol. Biol. 2010;9 doi: 10.2202/1544-6115.1534. Article20. [DOI] [PubMed] [Google Scholar]
- Martin YC, et al. Do structurally similar molecules have similar biological activity? J. Med. Chem. 2002;45:4350–4358. doi: 10.1021/jm020155c. [DOI] [PubMed] [Google Scholar]
- Nazarian R, et al. Melanomas acquire resistance to B-RAF(V600E) inhibition by RTK or N-RAS upregulation. Nature. 2010;468:973–977. doi: 10.1038/nature09626. [DOI] [PMC free article] [PubMed] [Google Scholar]
- Nepusz T, et al. Detecting overlapping protein complexes in protein-protein interaction networks. Nat. Methods. 2012;9:471–472. doi: 10.1038/nmeth.1938. [DOI] [PMC free article] [PubMed] [Google Scholar]
- Newman RH, et al. Construction of human activity-based phosphorylation networks. Mol. Syst. Biol. 2013;9:655. doi: 10.1038/msb.2013.12. [DOI] [PMC free article] [PubMed] [Google Scholar]
- Page L, et al. The PageRank Citation Ranking: Bringing Order to the Web. Stanford University, Stanford, CA: Stanford InfoLab; 1999. [Google Scholar]
- Šarić J, et al. Extraction of regulatory gene/protein networks from Medline. Bioinformatics. 2006;22:645–650. doi: 10.1093/bioinformatics/bti597. [DOI] [PubMed] [Google Scholar]
- Stark C, et al. BioGRID: a general repository for interaction datasets. Nucleic Acids Res. 2006;34:D535–D539. doi: 10.1093/nar/gkj109. [DOI] [PMC free article] [PubMed] [Google Scholar]
- Subramanian A, et al. Gene set enrichment analysis: a knowledge-based approach for interpreting genome-wide expression profiles. Proc. Natl Acad. Sci. USA. 2005;102:15545–15550. doi: 10.1073/pnas.0506580102. [DOI] [PMC free article] [PubMed] [Google Scholar]
- Tan VYF, Fevotte C. Automatic relevance determination in nonnegative matrix factorization with the beta-divergence. IEEE Trans. Pattern Anal. 2013;35:1592–1605. doi: 10.1109/TPAMI.2012.240. [DOI] [PubMed] [Google Scholar]
- Zhao X-M, et al. Prediction of drug combinations by integrating molecular and pharmacological data. PLoS Comput. Biol. 2011;7:e1002323. doi: 10.1371/journal.pcbi.1002323. [DOI] [PMC free article] [PubMed] [Google Scholar]
- Zhou T, et al. Solving the apparent diversity-accuracy dilemma of recommender systems. Proc. Natl Acad. Sci. USA. 2010;107:4511–4515. doi: 10.1073/pnas.1000488107. [DOI] [PMC free article] [PubMed] [Google Scholar]
- Zinner RG, et al. Algorithmic guided screening of drug combinations of arbitrary size for activity against cancer cells. Mol. Cancer Ther. 2009;8:521–532. doi: 10.1158/1535-7163.MCT-08-0937. [DOI] [PubMed] [Google Scholar]