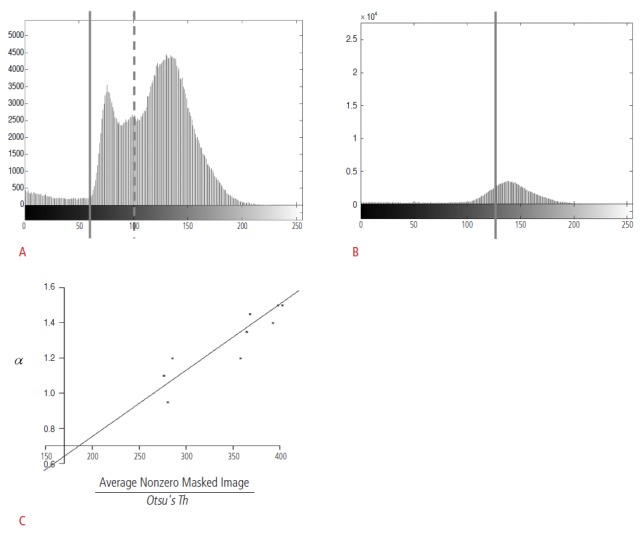
Figure 1. Distribution of pixel intensities and Otsu's thresholds.

A. Otsu's threshold values are represented by a solid line and a dotted line. If the pixel intensities of a mass candidate are located below the solid line, the mass candidate can be detected by both the lines. However, the mass candidates whose pixel intensities are located between the solid and the dotted line cannot be detected by the computer-aided detection (CAD) system with the Otsu's threshold value represented by the dotted line (x-axis, pixel intensity; y-axis, number of pixels). B. The intensity values of mass candidates are not differentiated because of the smooth distribution of the intensity values (x-axis, pixel intensity; y-axis, number of pixels). C. This graph shows the relation between α and the average non-zero pixel value divided by the original Otsu's threshold (x-axis, average non-zero pixel value for a masked image divided by the original Otsu's threshold; y-axis, the lowest Otsu's threshold values obtained from a manual adjustment to detect the mass candidates correctly).
