Abstract
A recently published study by the present authors (Aharoni et al., 2013) reported evidence that functional changes in the anterior cingulate cortex (ACC) within a sample of 96 criminal offenders who were engaged in a Go/No-Go impulse control task significantly predicted their rearrest following release from prison. In an extended analysis, we use discrimination and calibration techniques to test the accuracy of these predictions relative to more traditional models and their ability to generalize to new observations in both full and reduced models. Modest to strong discrimination and calibration accuracy were found, providing additional support for the utility of neurobiological measures in predicting rearrest.
Keywords: prediction, fMRI, impulsivity, anterior cingulate, recidivism
Introduction
A recently published functional magnetic resonance imaging study by the present authors (Aharoni et al., 2013) reported evidence that changes in the brain’s hemodynamic response within a sample of 96 criminal offenders who were engaged in an impulse control task significantly predicted their rearrest following release from prison (Aharoni et al., 2013). The region of the brain under observation is part of the anterior cingulate cortex (ACC), a region already known to be associated with the ability to inhibit undesirable behavior. The predictive effects were obtained using Cox Proportional Hazards Regression, which is a widely accepted semi-parametric method of evaluating whether variables of interest are associated with time to the occurrence of a particular event (e.g., rearrest), providing a probability estimate of risk to that event within a given observation period while adjusting for potential confounding variables.
If this effect can be shown to meet high standards of validity and reliability, it could have profound implications for the development of treatments that help high-risk offenders control their impulses and for the refinement of existing methods for deciding which offenders should be prioritized for re-entry into the community.
Despite its strengths in estimating risk, the method of using Cox Proportional Hazards Regression on a single dataset does not assess a model’s degree of accuracy at predicting event outcomes. Specifically, this approach does not tell us (1) how well the model explains the separation between those who were and were not rearrested as a function of the predictors, known as discrimination (Pepe, Janes, Longton, Leisenring, & Newcomb, 2004), or (2) whether a model’s predicted values can accurately predict outcomes in new offender datasets, known as calibration (Harrell, 2001). In order to validate the predictive effect observed, it is necessary to examine whether the accuracy with which the hemodynamic response can classify rearrest can satisfy these requirements.
Here we extend our initial survival analysis by assessing discrimination and calibration accuracy in our two primary survival models. The first model (“Any Crimes” – Model B) predicted months to any felony rearrest from eight predictors of interest: age, Hare Psychopathy Checklist-Revised (PCL-R) two-factor scores and their interaction, lifetime prevalence of alcohol abuse/dependence score assessed using the structured clinical interview for the diagnostic and statistical manual-IV (SCID I: research version), lifetime prevalence of drug abuse/dependence (SCID I), commission error rate on a “Go/No-Go” impulse control task, and notably, the ACC’s hemodynamic response signal. For every one unit increase in ACC activity, there was a 1.96 decrease in the probability of rearrest within four years of release. The second model (“Nonviolent Crimes” – Model C) predicted months to nonviolent felony rearrest (a corresponding 2.44 decrease in rearrest) using the same eight predictors.
Participants were 96 consenting adult male offenders ranging in age from 20 to 52 years. Thirty six percent self-identified as White, 9% as Black/African American, 9% as American Indian, 28% as Mixed/Other, 42% as Hispanic, and 14% chose not to respond. All participants were determined to be free of traumatic brain injury and psychosis, and had a general IQ over 70. Participants completed all assessments and an fMRI-based inhibition task using the Mind Research Network’s Mobile MRI system prior to release from one of two New Mexico state correctional facilities. After being released, they were tracked from 2007 to 2010. The average follow-up period was 34.5 months. (See Aharoni et al., 2013 for complete methodological details.)
Analysis
Discrimination Analysis
A common method of evaluating discrimination accuracy is the receiver operating characteristic (ROC) curve. The ROC curve reports a biomarker’s true positive fraction (TPF) and false positive fraction (FPF; Pepe et al., 2008). TPF and FPF are also commonly known as sensitivity and 1-specificity, respectively. The area under the ROC curve (AUC) is used here to evaluate discrimination between those who do and do not reoffend within the observation period. The AUC takes on values between 0.5 and 1, where 1 indicates perfect discrimination capability between groups, and 0.5 indicates no discrimination capability whatsoever (Harrell, 2001). By convention, values exceeding 0.70 are can be viewed as “good” discriminatory ability of a model. We created ROC curves for both models to evaluate performance at several time-points using Heagerty and Zheng’s time-dependent ROC curves in the risksetROC function in the risksetROC package in R, version 2.15.2. These time-dependent ROC curves, or incident/dynamic (I/D) ROC curves, are defined by Heagerty and Zheng as time-varying sensitivity and specificity (Heagerty & Zheng, 2005). These are also accompanied with a respective area under the I/D ROC curve for time t, or AUC(t).
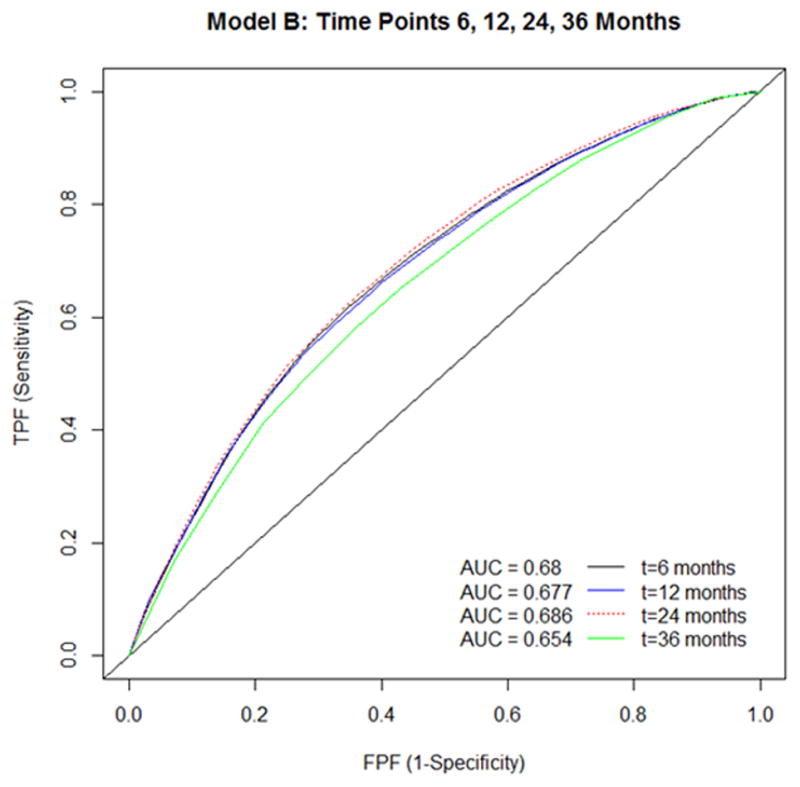
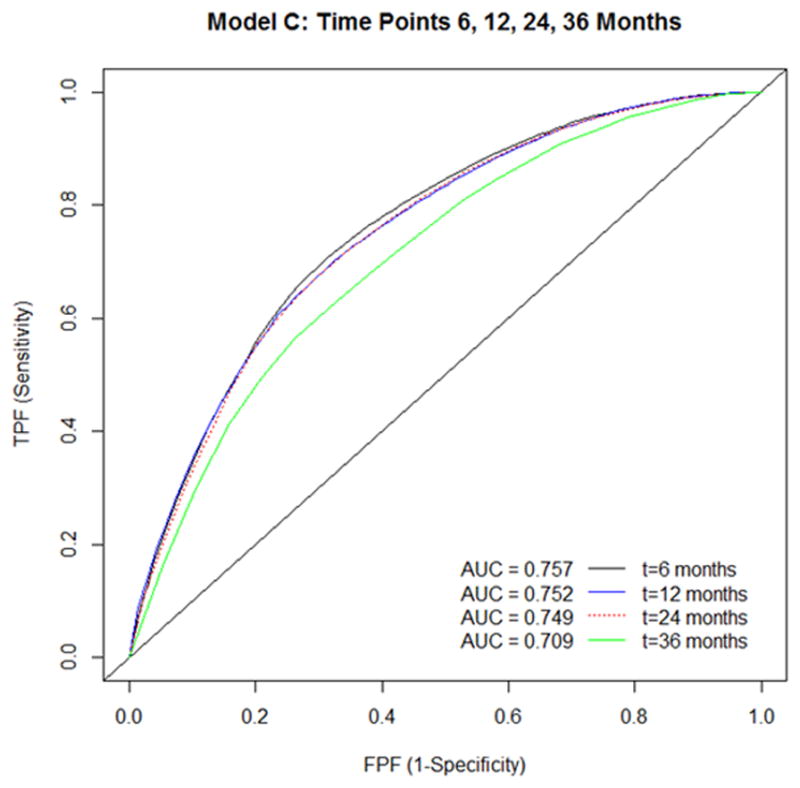
The I/D ROC curves were plotted at time-points 6, 12, 24, and 36 months to felony rearrest for both full models in Figures 1 and 2, respectively. In Figure 1, Any Crimes reports an AUC at six months of 0.68, and this AUC uniformly decreases over time. While the AUC remains between 0.65 and 0.68 from six to 36 months, this model’s discriminatory ability is modest. In Figure 2, however, Nonviolent Crimes achieves an AUC of 0.757 at six months. This model’s AUC value remains strong between the six to 36 month time-period.
Figure 1.

ROC curve and AUC statistics for any crime across four time periods.
Figure 2.

ROC curve and AUC statistics for nonviolent crimes across four time periods.
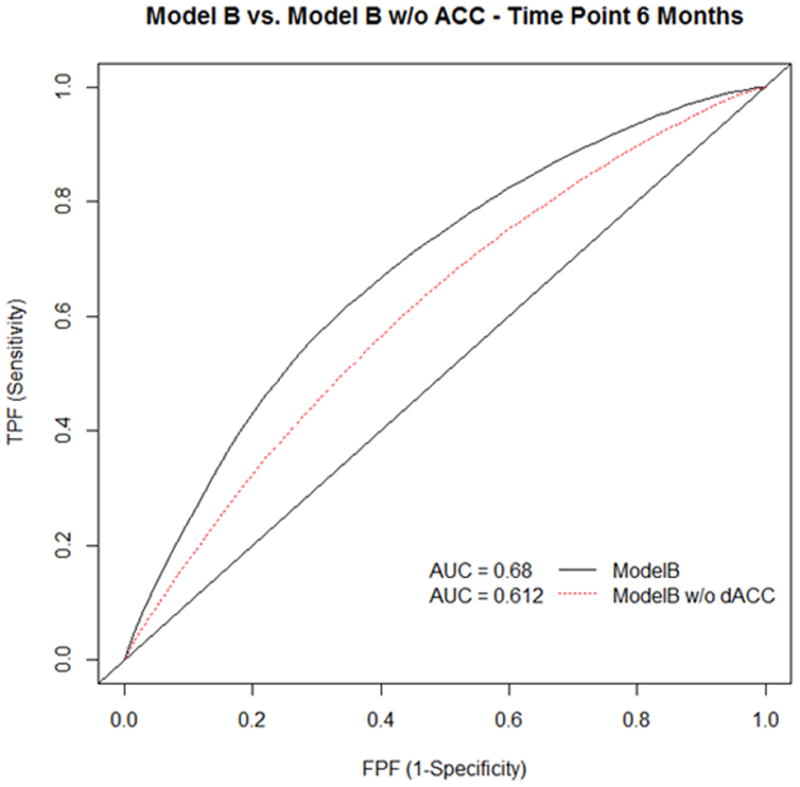
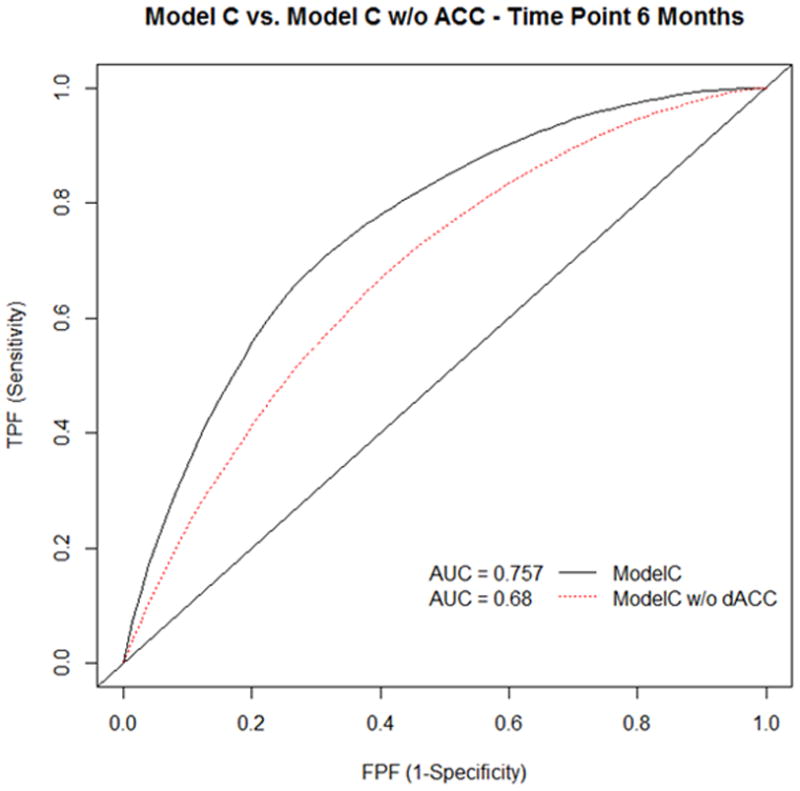
We were also interested in assessing the unique contribution of the anterior cingulate cortex (ACC) region of interest to the ROC model’s predictive accuracy. We did this by removing the ACC parameter from our two models, refitting those two new models, and comparing them to the original full models. The I/D ROC curve is very useful in comparing AUC between these two models at identical time-points. Figures 3 and 4 display comparisons of the full models and the refitted models without ACC at six months, respectively. In both cases, the full model performs far better with the ACC predictor included than when excluded.
Figure 3.

ROC curve and AUC statistics for any crime with and without the ACC.
Figure 4.

ROC curve and AUC statistics for nonviolent crimes with and without the ACC.
Calibration Analysis
Internal validation was used for both full models to assess what Harrell and colleagues call overfitting. This occurs when a model has too many parameters and smaller sample sizes, which can cause it to overestimate the data (Harrell, 2001). The objective of this calibration method is to assess whether the model predicts rearrest in new samples of adult offenders as accurately as it did in our sample.
Since new sample data is not presently available, we chose to internally validate both models. To do this, we used an enhanced bootstrapping resampling method, which accounts for bias due to overfitting, or optimism (Harrell, 2001) using the Efron method (Efron & Tibshirani, 1993). Efron’s steps are as follows: we drew new samples with replacement of 96 subjects, as in our original sample. We then derived a predictive model from each bootstrap sample and applied it to the original sample. The discrimination index calculated from the original sample was subtracted from the index from the bootstrap sample to produce the optimism estimate. This process was repeated for 150 bootstrap replications to obtain an average optimism estimate. This value was then subtracted from the final model’s predictive accuracy to result in a corrected estimate based on overfitting.
Using the validate function in Harrell’s rms package in R, Table 1 reports the values for the original discrimination index, the training data, the original test data, the optimism value, and the corrected estimate for both models. The optimism value is calculated subtracting the test data value from the training data value, and the corrected index value is calculated subtracting the optimism value from the original index value. Harrell’s package reports these using Somers’ D statistic, which is defined as the difference between the two conditional probabilities of concordance and discordance. Harrell defines Somers’ D = 2C −1, where C is known as Harrell’s C (Harrell, 2001). Harrell’s C is analogous to the area under the ROC curve at a specific point in time as it is a weighted average of the AUC(t) {Heagerty & Zheng, 2005). Somers’ D can be applied to survival data as a transformation of the hazard ratio where random variables X or Y, or both, can be censored (Newson, 2002).
Table 1.
Full Models’ Somers’ D Statistic showing 12–13% loss in predictive power.
| Model | Original | Training data | Test data | Optimism | Corrected |
|---|---|---|---|---|---|
| Model B | −0.39 | −0.46 | −0.33 | −0.12 | −0.26 |
| Model C | −0.51 | −0.57 | −0.45 | −0.13 | −0.38 |
We emphasize the “corrected” index value in the table because this value is a better estimate of how well these models will perform with future data than the original index value. The optimism values for All Crimes and Nonviolent Crimes are −0.12 and −0.13, respectively, which report that on average there is about a 12% and 13% difference in the values of Somer’s D between the original data and the data created from our bootstrap replicates. This is a significant loss in predictive power, so this leads us to suspect some overfitting in both models.
Due to the modest sample size, it is possible that there are too many parameters in these models. Thus, we chose to reduce both models, and then add variables one at a time to assess improvement in optimism. Starting with a baseline model, we added each variable one at a time, and chose not to include GNG commission error rate and drug abuse/dependence in attempt to limit our model to endogenous, trait-based predictors rather than including behavioral ones. We fitted new reduced models, and validated them as before, with results of Somers’ D statistic shown in Table 2.
Table 2.
Reduced Models’ Somers’ D Statistic showing 5–7% loss in predictive power.
| Model | Original | Training data | Test data | Optimism | Corrected |
|---|---|---|---|---|---|
| Model B-r | −0.36 | −0.40 | −0.33 | −0.07 | −0.29 |
| Model C-r | −0.49 | −0.50 | −0.45 | −0.05 | −0.43 |
These reduced models greatly improved the optimism values to −0.07 and −0.05 for reduced models Any Crimes-r and Nonviolent Crimes-r, respectively. This is reflected in the improved corrected index values for both models, as well. Both models appear to benefit from excluding these three behavioral variables which may have introduced too many degrees of freedom.
Conclusion
This analysis demonstrates incremental utility in the inclusion of the ACC as a predictor of rearrest in models containing any crime (model B) and nonviolent crime (model C), above and beyond variation attributable to age and psychopathic personality traits. Our analysis also revealed that while these models may suffer from some degree of overfitting, there is still benefit in future prediction of non-violent felony rearrest among new samples of adult offenders using a reduced model of nonviolent crimes. These validation techniques are necessary for generalizing predictive accuracy to new samples.
If neurobiological markers add utility to existing methods of risk assessment, then research will be needed to examine how this information should and should not be used. As we have previously cautioned, neuroprediction may never been accurate enough to warrant predictions about specific individuals, especially those whose welfare may be at stake (Aharoni et al., 2013). Nonetheless, more sophisticated risk assessment models could be potentially useful in low-stakes, group-level applications such as identifying broad classes of offenders at elevated risk for the purpose of providing them with voluntary preventative intervention opportunities. Such opportunities could include programs that provide recipients with the behavioral skills and resources they need to maintain a prosocial lifestyle.
Acknowledgments
This work was supported by the MacArthur Foundation Law & Neuroscience Project, and grants from NIMH (5R01MH070539 & 1R01MH085010; PI: KAK), NIDA (1R01DA026505 & 1R01DA026964; PI: KAK), and NBIB (2R01EB000840; PI: VDC). We thank Russ Poldrack and David Hoaglin for constructive comments which inspired this extended analysis. We gratefully acknowledge the staff and inmates of the New Mexico Corrections Department, for without their generous cooperation this work could not have been completed.
References
- Aharoni E, Vincent GM, Harenski CL, Calhoun VD, Sinnott-Armstrong W, Gazzaniga MS, Kiehl KA. Neuroprediction of future rearrest. Proc Nat Acad Sci. 2013;110:6223–6228. doi: 10.1073/pnas.1219302110. [DOI] [PMC free article] [PubMed] [Google Scholar]
- Efron B, Tibshirani RJ. An introduction to the bootstrap. Florida: Chapman and Hall; 1993. [Google Scholar]
- Heagerty PJ, Zheng Y. Survival model predictive accuracy and ROC curves. Biometrics. 2005;61:92–105. doi: 10.1111/j.0006-341X.2005.030814.x. [DOI] [PubMed] [Google Scholar]
- Harrell F. Regression Modeling Strategies. New York: Springer; 2001. [Google Scholar]
- Pepe MS, Feng Z, Huang Y, Longton G, Prentice R, Thompson IM, Zheng Y. Integrating the Predictiveness of a Marker with Its Performance as a Classifier. Amer J Epidemiol. 2008;167(3):362–368. doi: 10.1093/aje/kwm305. [DOI] [PMC free article] [PubMed] [Google Scholar]
- Pepe MS, Janes H, Longton G, Leisenring W, Newcomb P. Limitations of the Odds Ratio in Gauging the Performance of a Diagnostic, Prognostic, or Screening Marker. Amer J Epidemiol. 2004;159(9):882–890. doi: 10.1093/aje/kwh101. [DOI] [PubMed] [Google Scholar]
- Newson R. Parameters behind “nonparametric” statistics: Kendall’s tau, Somers’ D and median differences. Stata J. 2002;2(1):45–64. [Google Scholar]


