

Background: The osteoclastogenic cytokine RANKL is expressed in various cell types, including osteoblasts, osteocytes, and lymphocytes.
Results: RANKL expression is induced during adipogenesis through the action of C/EBPβ and/or C/EBPδ, and RANKL-positive preadipocytes increase in aging marrow along with down-regulation of osteoprotegerin.
Conclusion: Adipogenesis is linked to osteoclastogenesis through RANKL expression.
Significance: Increased marrow preadipocytes with aging may contribute to osteoporosis.
Keywords: Adipogenesis, Adipokine, Bone, Steroid Hormone, Transcription Factor, RANKL Expression, Osteoclastogenesis, Preadipocyte
Abstract
With advancing age bone marrow is progressively replaced with adipose tissue, accompanied by a concomitant decline in bone mass and strength. The mechanism underlying the increase in marrow fat and bone destruction remains elusive. We found that on the way of adipogenic differentiation of marrow stromal cells, receptor activator for NF-κB ligand (Rankl) expression was induced, concomitantly with a down-regulation of osteoprotegerin, which prompted us to hypothesize that cells at a preadipocyte stage express RANKL. This concept was supported by the findings that the early adipogenic transcription factors C/EBPβ and C/EBPδ, but not the late factor peroxisome proliferator-activated receptor γ, bind to the Rankl promoter and stimulate Rankl gene transcription. In fact, when cells isolated from the bone marrow of aging mice were analyzed by flow cytometry, we found that cells expressing the pre-adipocyte marker Pref-1 were RANKL-positive, and the number of these cells was increased with aging, with concomitant down-regulation of osteoprotegerin, and most importantly, that these RANKL+/Pref-1+ marrow cells were capable of generating osteoclasts from bone marrow macrophages. Thus, the capacity of cells at a pre-adipocyte stage to express RANKL via C/EBPβ and C/EBPδ and to support osteoclastogenesis may account partly for the co-progression of fatty marrow and bone destruction with aging.
Introduction
The number and size of adipocytes in the bone marrow increase along with aging (1, 2). Clinical as well as experimental studies have shown that an increase in marrow adipocytes is seen in association with the conditions that lead to bone loss or osteoporosis, such as aging (3–6), physical inactivity (7), long term glucocorticoid use (8), and ovariectomy (9, 10). Osteoporosis and obesity, two disorders of body composition, have been increasing in prevalence, and investigation into the fat-bone connection is actively being pursued at both clinical and molecular levels (11). Increased adiposity with aging has been studied mainly from the aspect of an imbalance between adipogenesis and osteoblastogenesis (12). Adipocytes and osteoblasts are both derived from mesenchymal stem cells, and skeletal aging is characterized by decreased osteoblastogenesis and increased adipogenesis (2).
The coexistence of increased adipocytes and the progression of bone destruction with aging also suggest a mechanistic link between adipogenesis and osteoclastogenesis. There have been a couple of reports on the potential role of adipocytic cells in supporting osteoclast formation in vitro (13–15). These reports were performed using established cell lines, and did not provide the mechanism by which adipocytes regulate osteoclastogenesis, especially, the involvement of receptor activator for NF-κB ligand (RANKL)2 and its regulation during adipogenesis.
Previously, we observed that bone with targeted ablation of osteocytes is characterized by fatty marrow and elevated bone resorption, mimicking the aging skeleton (16). Most strikingly, bone marrow cultures from osteocyte-ablated mice resulted in the formation of colonies of tartrate-resistant acid phosphatase (TRAP)-positive osteoclasts, without the addition of osteoclastogenic cytokines or hormones, such as RANKL and 1,25-(OH)2D3, and the osteoclasts generated under adipogenic conditions survived more than 11 weeks (16). These observations pointed to a mechanistic link between adipogenesis and osteoclastogenesis, and prompted the present study on the potential of bone marrow preadipocytes, especially those from aged mice, to support osteoclastogenesis.
EXPERIMENTAL PROCEDURES
Reagents and Antibodies
Ascorbic acid, β-glycerophosphate, dexamethasone (Dex), and 3-isobutyl-1-methylxanthine (IBMX), and PPARγ antagonist bisphenol A diglycidyl ether (BADGE) were purchased from Sigma, and PPARγ agonist troglitazone (TZD) from Calbiochem (La Jolla, CA). Recombinant OPG was purchased from R&D Systems, Inc. (Minneapolis, MN).
Polyclonal antibodies against C/EBPβ and C/EBPδ were purchased from Santa Cruz Biotechnology, Inc. (Santa Cruz, CA) and Cell Signaling Technology, Inc. (Danvers, MA), respectively. FITC-conjugated rat monoclonal antibody against mouse B220 was purchased from BD Biosciences (Franklin Lakes, NJ), and PE-conjugated rat monoclonal antibodies against mouse Pref-1 and rat IgG1 isotype control were purchased from MBL Medical & Biological Laboratories, Co., Ltd. (Nagoya, Japan). Streptavidin-APC, biotin-conjugated rat monoclonal antibodies against mouse RANKL and rat IgG2a isotype control were purchased from BioLegend (San Diego, CA).
Cell Culture and Staining
Mouse fibroblastic cell line NIH3T3, mouse preadipocytic cell line 3T3-L1, and human embryonic kidney cell line 293T were purchased from DS Pharma Biomedical Co., Ltd. (Suita, Japan). The mouse calvaria-derived stromal cell line MC3T3-G2/PA6 (PA6) and bone marrow stromal cell line ST2 were obtained from Riken Bioresource Center (Tsukuba, Japan).
Primary mouse whole bone marrow cells, bone marrow stromal cells, and bone marrow macrophages were prepared as described (16–18). Whole bone marrow cells were prepared from 2-month-old to 2-year-old C57BL/6 mice (Clea Japan Inc., Shizuoka, Japan) and were cultured as described previously (16). In brief, cells were seeded in αMEM containing 10% FBS in a 6-well plate at 2–6 × 10⁶ cells/well. After 3 to 8 days, the medium was changed to osteogenic media with 10% FBS/αMEM containing ascorbic acid (50 μg/ml) and β-glycerophosphate (10 mm) or adipogenic media with 10% FBS/αMEM containing dexamethasone (0.5 μm) and IBMX (0.5 mm), respectively. The media were changed every 3 days, and after 5 to 14 days cells were stained with hematoxylin/eosin (H&E), alkaline phosphatase, or TRAP. Alkaline phosphatase staining was performed using an alkaline phosphatase staining kit (Sigma). For TRAP staining, cultured cells were fixed with 10% formalin for 5 min and then with ethanol/acetone (50:50, v/v) for 1 min at room temperature, and incubated in acetate buffer (pH 4.8) containing naphtol AS-MX phosphate (Sigma), fast red violet LB salt (Sigma), and 50 mmol/liter of sodium tartrate. Resorption pit assay was performed, as described previously (19). Briefly, bone marrow cells were cultured in adipogenic media, or osteoclastogenic media containing RANKL (100 ng/ml) and M-CSF (100 ng/ml) as a control, on dentin slices. After osteoclasts formed, dentin slices were harvested and cells were removed from the dentin with 1 m sodium hydrate. After washing with distilled water, dentin was stained with Coomassie Brilliant Blue and the stained resorption pits were analyzed with light microscopy. To quantitatively assess resorbing activity per osteoclast, five to six areas of the dentin slices were randomly selected and the areas of osteoclasts stained by TRAP and the resorption lacunae stained by Coomassie Brilliant Blue were determined with the NIH Image program (rsb.info.nih.gov/nih-image/).
RNA Isolation and RT-PCR
Total RNA was extracted from cells using TRIzol reagent (Invitrogen) and used for RT-PCR analysis. The primers used for RT-PCR are summarized in Tables 1 and 2. Quantitative RT-PCR was performed using the power SYBR Green PCR master mix on a 7300 fast real-time PCR system (Applied Biosystems).
TABLE 1.
Oligonucleotide primers for quantitative PCR
| Gene | Primer (5′-3′) |
|---|---|
| Adiponectin (Adipoq) | Forward: AGGGAGAGAAAGGAGATGCAG |
| Reverse: CTTTCCTGCCAGGGGTTC | |
| Adipocyte protein 2 | Forward: AAGAGAAAACGAGATGGTGACAA |
| (Ap2) | Reverse: CTTGTGGAAGTCACGCCTTT |
| C/EBPβ (Cebpb) | Forward: CGCAACACACGTGTAACTGTCTAG |
| Reverse: AACCCCGCAGGAACATCTTT | |
| Gapdh | Forward: AGCTTGTCATCAACGGGAAG |
| Reverse: TTTGATGTTAGTGGGGTCTCG | |
| Lipoprotein lipase (Lpl) | Forward: CTCGCTCTCAGATGCCCTAC |
| Reverse: GGTTGTGTTGCTTGCCATT | |
| Osteoprotegerin (Opg, Tnfrsf11b) | Forward: ATGAACAAGTGGCTGTGCTG |
| Reverse: CAGTTTCTGGGTCATAATGCAA | |
| PPARγ (Pparg) | Forward: GAAAGACAACGGACAAATCACC |
| Reverse: GGGGGTGATATGTTTGAACTTG | |
| Rankl (Tnfsf11) | Forward: TGAAGACACACTACCTGACTCCTG |
| Reverse: CCCACAATGTGTTGCAGTTC | |
| Proximal (ChIP) | Forward: AAACCAACCACTGGACCCAA |
| Reverse: TCTCAGGGACCCGCCTC | |
| Distal (ChIP) | Forward: GTCTTTGTTTTTTCTTCCTGGCTAA |
| Reverse: CATGGCAGCAGGAATATGTAGTG |
TABLE 2.
Oligonucleotide primers for semi-quantitative PCR
| Gene | Primer (5′-3′) |
|---|---|
| Adiponectin (Adipoq) | Forward: ACAGGAGATGTTGGAATGACAG |
| Reverse: CCTGATACTGGTCGTAGGTGAA | |
| Adipocyte protein 2 | Forward: CACCATCCGGTCAGAGAGT |
| (Ap2) | Reverse: CAAATTTCCATCCAGGCCTCTT |
| Gapdh | Forward: ACTTTGTCAAGCTCATTTCC |
| Reverse: TGCAGCGAACTTTATTGATG | |
| Osteoprotegerin (Opg, Tnfrsf11b) | Forward: CCACTCTTATACGGACAGCT |
| Reverse: TCTCGGCATTCACTTTGGTC | |
| PPARγ (Pparg) | Forward: CCACTATGGAGTTCATGCTTGT |
| Reverse: GACAAATGGTGATTTGTCCGTT | |
| Rankl (Tnfsf11) | Forward: TGAAGACACACTACCTGACT |
| Reverse: AAGATAGTCTGTAGGTACGCTT |
Retroviral Expression
The retroviral vector pMX-puro (a gift from Dr. T. Kitamura of the University of Tokyo) along with Cebpb, Cebpd (gifts from Dr. S. Akira of Osaka University), or Pparg cDNA and/or the pVSVG plasmid vector were used to transfect the retrovirus packaging cells, GP2-293 (Clontech Laboratories, Inc.). NIH3T3 or ST2 cells were infected with the pMX-puro vector expressing C/EBPs or PPARγ under the control of Moloney murine leukemia virus LTR, and cultured in the presence of Polybrene (8 μg/ml) for 1 day. Infected cells were cultured in the presence of 2 μg/ml of puromycin for 3 days. Transduced cells were further cultured to induce adipogenesis.
Small Interfering RNA (siRNA)
For transient silencing of C/EBPβ, ST2 cells were transfected with Silencer Select Pre-designed siRNA for C/EBPβ (s63860, Ambion, Invitrogen Corp.) with Lipofectamine RNAiMAX Reagent (Invitrogen), according to the manufacturer's protocol. The siRNA sequences were 5′-GCACCCUGCGGAACUUGUUtt-3′ for sense and 5′-AACAAGUUCCGCAGGGUGCtg-3′ for antisense. Silencer Select Negative Control (4390843, Ambion) was also transfected as a negative control. The transfected cells were cultured overnight and used for the experiments.
Flow Cytometry and Cell Purification by Magnetic Beads
Bone marrow cells were prepared from the femur and tibia of 2- to 15 month-old mice. Cells were stained with PE-conjugated anti-Pref-1 monoclonal antibody, FITC-conjugated anti-B220 monoclonal antibody, and/or biotin-anti-RANKL monoclonal antibody and streptavidin-APC. After washing, cells were analyzed using flow cytometry (FACSCalibur, BD Biosciences).
For purification of the RANKL-positive bone marrow cells, MACS Micro Beads were used according to the manufacturer's protocol (Miltenyi Biotec GmbH, Bergisch Gladbach, Germany). Mouse bone marrow cells were stained with PE-anti-RANKL monoclonal antibody (BioLegend) and anti-PE magnetic beads (Miltenyi Biotec), and RANKL-positive cells were purified using a MACS column and MACS Separator.
Luciferase Reporter Assay and Chromatin Immunoprecipitation (ChIP) Assay
A 708-bp fragment of the mouse Rankl (Tnfsf11) gene promoter region was amplified by using primers 5′-AACTCGAGTAACAGCTCTTTCCTGACTGTT-3′ containing an XhoI site at the 5′ end and 5′-GGAAGCTTACCGGTTCACAGAGGTCCTGGC-3′ containing a HindIII site at the 5′ end. The PCR fragment was digested with XhoI and HindIII and cloned into a pGL3-basic luciferase reporter vector (Promega, Madison, WI). To construct deletion mutants of Rankl promoter vector, the following PCR primers were used: 5′-ATCTCGAGCACCCACCCCATTCTTTTCC-3′ for −556, 5′-ATCTCGAGCACTTGGGAGGGAGTTCTAG-3′ for −452, 5′-ATCTCGAGCTCTAAGATTTTGAGAGTG-3′ for −345, 5′-ATCTCGAGGATAGGGGCCAGCCTAGAG-3′ for −241, 5′-ATCTCGAGCAGCCTCCACCTCAGAGG-3′ for −192, 5′-ATCTCGAGCGAAGAAGAGTGGGAGGGCG-3′ for −138, 5′-ATCTCGAGGTGAAAGAGGCACCCTCCTG-3′ for −90, and 5′-ATCTCGAGCTCTGGAGGCCAGCTCTCTC-3′ for −58. NIH3T3 cells were transfected with the Rankl promoter vector, using the FuGENE 6 transfection reagent (Roche Applied Science) according to the manufacturer's protocol. The Rankl-Luc reporter plasmids were co-transfected with Renilla-expressing control (pRL-CMV)(Promega) and C/EBPβ-expressing plasmids (pcDNA3.1(+), Invitrogen) or vector controls into NIH3T3 cells. Cell lysate was collected 48 h after transfection, and luciferase assays were performed using the Dual Luciferase Assay System (Promega).The intensity of luciferase activity was determined by a luminometer, and the reporter activity was calculated by normalizing firefly luciferase activity to that of Renilla luciferase. The relative activity was defined by normalizing the reporter activity in cells with C/EBPβ expression to that of the activity in the control.
Chromatin immunoprecipitation (ChIP) assay was performed using the ChIP-IT Express kit (Active Motif, Carlsbad, CA). ST2 cells were cultured in the presence of Dex/IBMX for 3 days and cross-linked and lysed, followed by enzymatic shearing in lysis buffer according to the manufacturer's manual. After centrifugation, the supernatant was immunoprecipitated with anti-C/EBPβ or anti-C/EBPδ antibody or control IgG, and Protein G-coated magnetic beads were added and incubated for 1 h. After washing and reversal of the cross-links, followed by phenol/chloroform extraction and isopropyl alcohol precipitation, DNA was suspended in 50 μl of sterile H2O. PCR was performed using 5 μl of immunoprecipitated DNA as the template and the proximal primers (−216 to −140) of the Rankl promoter, and distal primers (located at ∼4.5 kb upstream from the start site) as the negative control, as shown in Table 1.
Statistical Analysis
Data are expressed as the mean ± S.D. Statistical analysis was performed using unpaired Student's t test or analysis of variance followed by Dunnett's test or Student-Newman-Keuls test. Values were considered statistically significant at *, p < 0.05; **, p < 0.01; and ***, p < 0.001.
RESULTS
Increased Rankl Expression and Adipogenesis with Aging
In an attempt to address the link between osteoclastogenesis and the bone marrow adipocytes that develop during aging, we examined Rankl expression in bone marrow cells derived from young adult versus aged mice. As expected, reflecting increased adipose tissue in bone marrow with aging, aging was associated with an increased expression of adipocyte marker genes such as adiponectin (Adipoq), adipocyte P2 (Ap2), and PPARγ (Pparg), and concomitantly we found a 3-fold higher Rankl expression in the bone marrow of aged mice compared with younger mice (Fig. 1).
FIGURE 1.
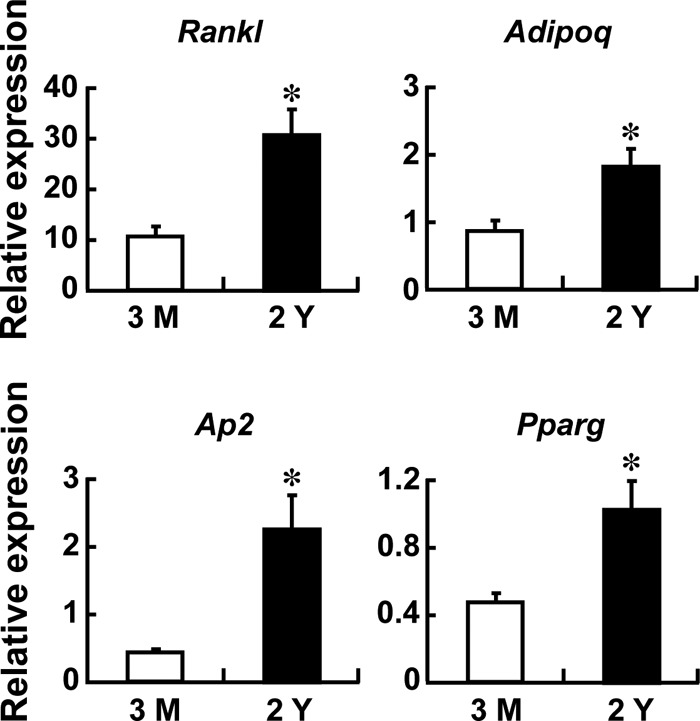
Increased Rankl expression in the bone marrow of aged mice. Bone marrow was flushed out from 3-month- and 2-year-old mice, RNAs were extracted, and quantitative RT-PCR was performed. The expression of Rankl and adipogenic marker genes, adiponectin (Adipoq), adipocyte P2 (Ap2), and PPARγ (Pparg), was examined and normalized by Gapdh. n = 3 mice; *, p < 0.05. The RT-PCR shown is representative of two independent experiments all displaying similar results.
We then collected bone marrow cells from young adult (4 months old), middle aged (1 year old), and aged (2 years old) mice and cultured them under osteogenic or adipogenic conditions. The number of CFU-F, as determined by H&E staining after culturing in αMEM supplemented with 10% FCS, was modestly increased in cultures from the 2-year-old mice (Fig. 2A). The number of alkaline phosphatase-positive colonies or CFU-osteoblast (CFU-Ob), generated under osteogenic conditions with β-glycerophosphate and ascorbic acid, was also modestly increased in the cultures from the aged mice (Fig. 2, A and B). In contrast, TRAP staining revealed a number of TRAP-positive colonies (CFU-OC) in cultures from aged mice under the same osteogenic conditions, whereas such colonies were rare or only occasionally seen in bone marrow cultures from young or middle aged mice, respectively (Fig. 2, A and B). It is to be noted that these cultures contained no exogenous osteoclastogenic cytokines or hormones, such as RANKL/M-CSF, 1,25-(OH)2D3, and parathyroid hormone. The osteoclast colonies formed under the osteogenic condition were completely inhibited by treatment with 100 ng/ml of OPG (Fig. 2, C and D), suggesting that it is RANKL dependent. When bone marrow cells from aged mice were cultured on dentin slices under the osteogenic condition, they displayed a bone-resorbing activity that was significantly weaker than that of the osteoclasts generated under the stimulation of M-CSF and RANKL per cell basis (Fig. 2, E and F).
FIGURE 2.

Increased osteoclastogenesis in osteogenic bone marrow cultures of aged mice. A and B, bone marrow cells from 4-month (4M)-, 1-year (1Y)-, and 2-year (2Y)-old mice were cultured under osteogenic conditions with β-glycerophosphate and ascorbic acid for 5 days. For identification of CFU-osteoclast (CFU-OC), CFU-osteoblast (CFU-Ob), or CFU-fibroblast (CFU-F), cells were stained with TRAP, alkaline phosphatase, or H&E, respectively. The number of CFU-OC, CFU-Ob, and CFU-F was counted, and data are shown as percentage of CFU-OC/CFU-F or CFU-Ob/CFU-F in each age group (B). The experiments were done twice in duplicate, and representative pictures are shown in A. *, p < 0.05; **, p < 0.01; ***, p < 0.001. NS, not significant. C and D, bone marrow cells from 1.5-year-old mice were cultured in the presence of the indicated concentrations of OPG in the osteogenic medium and stained with TRAP (for CFU-OC) or H&E (for CFU-F). The number of CFU-OC and CFU-F was counted, and data are expressed as percentage of CFU-OC/CFU-F (D). The experiments were done twice in triplicate, and representative pictures are shown in C. n = 3 wells; **, p < 0.01; ***, p < 0.001. Note that OPG dose dependently inhibits osteoclast colony formation under osteogenic induction. E and F, bone-resorbing activity as determined by TRAP staining and pit assay. After bone marrow cells were cultured on dentin slices for 3 days, the medium was switched to osteogenic media. As a reference, bone marrow macrophages were induced to differentiate into osteoclasts with RANKL (100 ng/ml) and M-CSF (100 ng/ml) on dentin slices. After 8 or 5 days of osteogenic culture condition (Aged BM cultures) or osteoclastogenic induction (RANKL+M-CSF), respectively, dentin was stained with TRAP for osteoclasts and with Coomassie Brilliant Blue to visualize the resorption pits (E). Scale bar, 100 μm. The areas of osteoclast (OC) and resorption pits were separately quantified using NIH Image, and data are expressed as percentage of pit area/OC area (F). The experiments were done twice in five and six dentin slices for aged BM cultures and osteogenic induction, respectively. ***, p < 0.001.
When bone marrow cells were cultured under adipogenic conditions with Dex/IBMX, the frequency of osteoclast colony formation increased even more than that under osteogenic culture conditions (Fig. 3, A and B). Again, the osteoclast colonies formed under the adipogenic condition was completely inhibited by treatment with OPG (Fig. 3, C and D), suggesting that it is RANKL dependent.
FIGURE 3.

Increased osteoclastogenesis in adipogenic bone marrow cultures of aged mice. A and B, after bone marrow cells from 4-month (4M)-, 1-year (1Y)-, and 2-year (2Y)-old mice were cultured for 10 days, the medium was switched to the adipogenic media with Dex/IBMX for an additional 13 days. Cells were stained with TRAP or H&E for CFU-osteoclast (CFU-OC) or CFU-fibroblast (CFU-F), respectively. The number of CFU-OC and CFU-F was counted, and data are shown as percentage of CFU-OC/CFU-F in each age group (B). The experiments were done twice in duplicate, and representative pictures are shown in A. *, p < 0.05; ***, p < 0.001. C and D, bone marrow cells from 1.5-year-old mice were cultured in the presence of the indicated concentrations of OPG in the adipogenic conditions and stained with either TRAP (for CFU-OC) or H&E (for CFU-F). The number of CFU-OC and CFU-F was counted, and data are expressed as percentage of CFU-OC/CFU-F (D). The experiments were done twice in triplicate, and representative pictures are shown C. n = 3 wells; ***, p < 0.001. Note that OPG inhibits osteoclast colony formation of bone marrow cells under adipogenic conditions. E and F, bone-resorbing activity determined by TRAP staining and pit assay. After bone marrow cells were cultured on dentin slices for 10 days, the medium was switched to the adipogenic media. As a reference, bone marrow macrophages were induced to differentiate into osteoclasts with RANKL (100 ng/ml) and M-CSF (100 ng/ml) on dentin slices. After 14 or 5 days of adipogenic condition (Aged BM cultures) or osteoclastogenic induction (RANKL+M-CSF), respectively, dentin was stained with TRAP for identification of osteoclasts and with Coomassie Brilliant Blue to visualize the resorption pits (E). Scale bar, 100 μm. The areas of osteoclast (OC) and resorption pits were quantified separately using NIH Image, and data are expressed as percentage of pit area/OC area (F). The experiments were done twice in five and six dentin slices for aged BM cultures and osteogenic induction, respectively. NS, not significant. G, bone marrow cells from 4-month-, 1-year-, and 2-year-old mice were cultured for 10 days as in A. After a change to the adipogenic media with Dex/IBMX, cells were cultured for 13 weeks. Medium were changed fresh every 3 days. Cells were stained with TRAP. Note that osteoclast colonies formed in the bone marrow cultures of aged mice under the adipogenic condition survived for 13 weeks.
When bone marrow cells from aged mice were placed on dentin slices under the adipogenic condition, they formed numerous resorption pits (Fig. 3E) and displayed a potent bone-resorbing activity that was comparable with those generated under the stimulation of M-CSF and RANKL (Fig. 3F), indicating that they possess bone-resorbing activity. Osteoclasts generated ex vivo usually die within a couple of days, even if a potent survival factor, such as RANKL, is provided (19, 20). Surprisingly, osteoclast colonies formed in the bone marrow cultures of aged mice under adipogenic conditions survived more than 13 weeks without the addition of any stimulatory factors including RANKL (Fig. 3G). Thus, it is speculated that adipocyte-derived RANKL or some other factor promotes the survival as well as the development of osteoclast colonies.
Adipogenic Differentiation Induces Rankl Expression
To determine whether adipogenic differentiation induces an osteoclastogenesis-supporting microenvironment, primary marrow stromal cells were cultured under normal growth or adipogenic conditions with Dex/IBMX, and expression of Rankl, Opg (Tnfrsf11b), and Adipoq was assessed by quantitative RT-PCR. As shown in Fig. 4A, adipogenic cultures were associated with much higher expression of Rankl and concomitant suppression of Opg, in addition to a progressive increase in Adipoq expression. These data suggest that the induction of Rankl expression takes place, along with Opg down-regulation, on the way to adipocytic differentiation.
FIGURE 4.
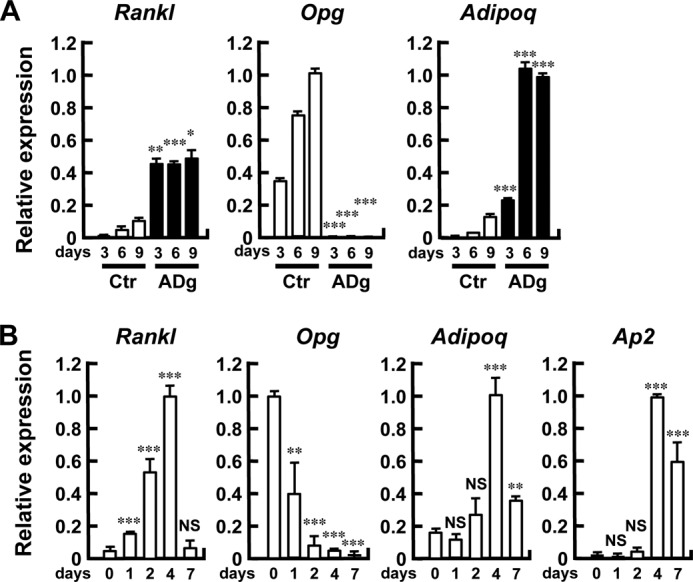
Adipogenic differentiation is associated with increased Rankl and decreased Opg expression. A, induction of Rankl expression following adipogenic stimulation. Primary bone marrow stromal cells were cultured in the absence (Ctr) or presence (ADg) of Dex/IBMX, and RNA was extracted on the indicated days. The expression of Rankl, Opg, and Adipoq was determined by quantitative RT-PCR and normalized by Gapdh. n = 3 wells; *, p < 0.05; **, p < 0.01; ***, p < 0.001. The RT-PCR shown in the figure is representative of two independent experiments displaying similar results. B, induction of Rankl expression in stromal cell line ST2 following adipogenic stimulation. ST2 cells were cultured in the presence of Dex/IBMX, and RNA was extracted on the indicated days. The expression of Rankl, Opg, Adipoq, and Ap2 was examined by quantitative RT-PCR and normalized by Gapdh. n = 3 wells; **, p < 0.01; ***, p < 0.001. NS, not significant. The RT-PCR shown in the figure is representative of two independent experiments displaying similar results. Note the induction of Rankl expression with the mirror-image suppression of Opg.
We further attempted to confirm the association of adipocytic differentiation with Rankl expression using the mouse bone marrow stromal cell line ST2. As shown in Fig. 4B, at baseline the Rankl mRNA level was low in ST2 cells, whereas Opg mRNA was abundantly expressed. When ST2 cells were induced to differentiate into adipocytes, Rankl expression was markedly increased, whereas Opg mRNA expression was progressively suppressed, along with the induction of Adipoq and Ap2 expression (Fig. 4B).
Preadipocytic Cells in the Bone Marrow Express Rankl and Support Osteoclastogenesis
The transient induction of Rankl expression during adipogenesis and its decline upon full maturation suggest that Rankl expression is associated with preadipocytes. To test this in vivo, we characterized RANKL-positive cells in the bone marrow. In doing so, we collected preadipocytes by FACS using Pref-1 as the molecular marker for preadipocytes (21). As shown in Fig. 5A, flow cytometry revealed that the percentage of Pref-1 positive cells increased from 2 months (6.6%) to 12 months of age (11.1%). When bone marrow cells were gated according to the expression of Pref-1, it turned out that 28.2% of the Pref-1-positive population was clearly RANKL positive (R1 in Fig. 5B). Conversely, when bone marrow cells were gated according to the expression of RANKL and B220 (a marker for B lineage cells), most (83.55%) of the RANKL-positive and B220-positive cells were Pref-1 positive (R4 in Fig. 5C). Together, these data suggest a RANKL- and Pref-1-positive cell population exists in the bone marrow and is increased with aging.
FIGURE 5.

Pref-1 positive preadipocytes in the bone marrow express RANKL. A, an increase in Pref-1 positive cells in bone marrow with aging. Bone marrow cells from 2-, 6-, 12-, and 15-month (M)-old mice were stained with an anti-Pref-1 antibody and analyzed by flow cytometry. As a negative control, bone marrow cells from 15-month-old mice were stained with rat IgG1 (isotype control). B and C, flow cytometric analyses of bone marrow cells. Bone marrow cells from 6-month-old mice were stained with PE-anti-Pref-1 antibody, APC-anti-RANKL antibody, and FITC-anti-B220 antibody. In B, cells were gated on a stromal cell fraction and characterized with Pref-1 and B220 staining (separated into R1 and R2), and each fraction was further analyzed for the expression of RANKL. Note that R1 represents a RANKL+Pref-1+B220dull population (28.20%). In C, cells were gated on a stromal cell fraction and characterized with RANKL and B220 expression (R3 to R6), and each fraction was analyzed for Pref-1 expression. Note that R4 represents a RANKL+Pref-1+ B220dull population (83.55%). The results of flow cytometric analysis shown are representative of two independent experiments displaying similar results.
We then purified these RANKL-positive bone marrow cells using anti-RANKL antibody and magnetic beads (Fig. 6). Again, the RANKL-positive cells purified in this manner were shown to express adipogenic marker genes, Adipoq, Ap2, or lipoprotein lipase (Lpl) (Fig. 6A). Interestingly, the expression of Opg in the RANKL-positive population from the aged mice was markedly suppressed compared with the younger mice (Fig. 6A). Evidently, when these RANKL-positive cells were co-cultured with bone marrow-derived macrophages in the presence of Dex/IBMX, TRAP-positive osteoclasts were generated, again without any osteoclastogenic agents such as RANKL or 1,25-(OH)2D3 (Fig. 6, B and C). These data demonstrate that RANKL-expressing preadipocytes in the bone marrow support osteoclastogenesis.
FIGURE 6.

Preadipocytes in the bone marrow express Rankl and support osteoclastogenesis. A, bone marrow cells from 3-month (3M)- and 15-month (15M)-old mice were stained with anti-RANKL antibody, and RANKL-positive cells were collected using magnetic beads. RNA was extracted from the RANKL positive and negative fractions, and RT-PCR was performed. The expression of Rankl, Opg, Adipoq, Ap2, and lipoprotein lipase (Lpl) mRNA was determined by quantitative RT-PCR and normalized with Gapdh. n = 3 wells; *, p < 0.05; **, p < 0.01; ***, p < 0.001. NS, not significant. The results shown are representative of two independent experiments displaying similar results. Note that the RANKL-positive cells from the aged (15 M) mice exhibit a marked suppression of Opg expression. B and C, RANKL-positive bone marrow cells support osteoclastogenesis. RANKL-positive and negative bone marrow cells were collected from 6-month-old mice separately as in A, and co-cultured with bone marrow macrophages in the absence (None) or presence of Dex/IBMX for 5 days. Cells were then stained with TRAP (B), and the number of TRAP-positive multinucleated osteoclasts was counted (C). Data are expressed as the mean of 3 wells. ***, p < 0.001. The results shown are representative of two independent experiments displaying similar results.
Induction of Rankl Transcription by C/EBPβ/δ
We finally examined the molecular mechanism by which Rankl expression is induced in the course of adipogenesis. During adipogenesis, a genetic program orchestrated by multiple transcription factors is evoked (22), and we focused on the early regulators C/EBPβ and C/EBPδ. When NIH3T3 fibroblasts, 3T3-L1 preadipocytes, or ST2 stromal cells were transduced with a retroviral vector encoding C/EBPβ or C/EBPδ, Rankl mRNA expression was induced together with the adipocyte markers Pparg and Adipoq, as shown in Fig. 7, A–C, respectively. Furthermore, knockdown of C/EBPβ by siRNA abrogated the induction of Rankl mRNA by adipogenic culture (Fig. 7D). On the other hand, a PPARγ agonist TZD failed to induce Rankl expression in the preadipocyte cell line 3T3-L1, and stromal cell lines MC-3T3-G2/PA6 (PA6) and ST2, whereas these 3 cell lines express Pparg, and Rankl expression was induced under the adipogenic conditions of Dex/IBMX in PA6 and ST2 cells (Fig. 8A). Forced expression of PPARγ, even with TZD stimulation, failed to induce Rankl expression in NIH3T3 (Fig. 8B). Interestingly, a PPARγ antagonist BADGE slightly increased Rankl expression under the adipogenic conditions in 3T3-L1 and ST2 cells (Fig. 8C). Collectively the data suggest that C/EBPβ and C/EBPδ, transcription factors that act at an early stage in adipogenesis, transactivate Rankl gene expression.
FIGURE 7.

Forced expression of C/EBPβ or C/EBPδ induces Rankl expression in NIH3T3, 3T3-L1, and ST2 cells. NIH3T3 (A), 3T3-L1 (B), or ST2 (C) cells were retrovirally transduced with either C/EBPβ or C/EBPδ, cultured for the indicated days and RNA was extracted. D, ST2 cells were transfected with either control or Cebpb siRNA, and transfected cells were cultured in the absence (Ctr) or presence (ADg) of Dex/IBMX, respectively, and RNA was extracted on day 2. Quantitative RT-PCR was performed for the expression of Rankl, Adipoq, Pparg, Opg, Cebpb, and Ap2, which was normalized by Gapdh. Results are shown as mean ± S.D. of three separate transfections. *, p < 0.05; **, p < 0.01; ***, p < 0.001. NS, not significant. The RT-PCR shown in the figure is representative of at least two independent experiments all displaying similar results.
FIGURE 8.

Adipogenic stimulation, but not TZD, induces Rankl expression in stromal cell lines. A, preadipocytic 3T3-L1 and stromal MC-3T3-G2/PA6 and ST2 cells were cultured in the presence of Dex/IBMX or PPARγ agonist troglitazone (TZD) (10 μm). RNA was extracted on the indicated days, and the expression of Rankl, Opg, Pparg, Adipoq, Ap2, and Gapdh was determined by semi-quantitative RT-PCR (the number of PCR cycles is indicated in the parentheses). B, Rankl expression was not induced in NIH3T3 cells even after forced expression of PPARγ and treatment with TZD. PPARγ was retrovirally expressed in NIH3T3 cells, and transduced cells were treated with TZD. RNA was extracted on the indicated days, and the expression of Rankl, Opg, Pparg, Adipoq, Ap2, and Gapdh was determined by RT-PCR (The number of PCR cycles is indicated in the parentheses). C, PPARγ antagonist BADGE slightly induced the expression of Rankl. Preadipocytic 3T3-L1 and stromal ST2 cells were cultured under the adipogenic condition with Dex/IBMX in the absence or presence of PPARγ antagonist BADGE (100 μm) for 3 days. RNA was extracted and the expression of Rankl, Opg, Adipoq, and Gapdh was determined by semi-quantitative RT-PCR (the number of PCR cycles is indicated in the parentheses). Note that BADGE slightly induced Rankl expression in both 3T3-L1 and ST2 cells under the adipogenic condition, compared with Dex/IBMX alone. The RT-PCR shown in the figure is representative of two independent experiments displaying similar results.
To test the hypothesis that C/EBPβ or C/EBPδ binds to the Rankl promoter and transactivates the Rankl gene, a reporter assay was performed. As shown in Fig. 9A, when a C/EBPβ expression vector was co-transfected with a luciferase reporter vector that contains a 708-bp fragment of the 5′-flanking region of the mouse Rankl gene, luciferase activity was increased dose-dependently with the amount of the C/EBPβ expression plasmid in NIH3T3, C3H10T1/2, 3T3-L1, and ST2 cells. To narrow down a critical region for Rankl gene activation by C/EBP, a series of deletion mutants were constructed (Fig. 9B) and the reporter activity was determined. The results revealed that when the region from −192 to −138 was deleted, the response to C/EBPβ expression was abrogated, and that the region between −138 to −90 was required for the basal level of Rankl transcription (Fig. 9B). These data suggest that the region between −192 to −138 is important for RANKL gene activation by C/EBP.
FIGURE 9.

Activation of Rankl gene transcription by C/EBPβ. A, transcriptional activation of the Rankl gene by C/EBPβ. The luciferase reporter vector containing a 708-bp Rankl promoter was co-transfected with a C/EBPβ expression vector into NIH3T3, C3H10T1/2, 3T3-L1, and ST2 cells, and luciferase activity was determined. n = 3; *, p < 0.05; **, p < 0.01. Results are expressed as relative luciferase activity and represent the mean ± S.D. of three separate transfections. B, deletion mutants of the Rankl promoter for luciferase assay. Eight deletion mutants were cloned into a pGL3 vector and are schematically represented. The CAT box is indicated by an open box. NIH3T3 were transiently transfected with a series of deletion constructs with (closed box) or without (open box) a C/EBPβ expression vector, and luciferase activity was determined, n = 3. Results are expressed as relative luciferase activity and represent the mean ± S.D. of three separate transfections. C, ChIP assays for C/EBPβ binding in the Rankl promoter. After ST2 cells were cultured with or without Dex/IBMX for 3 days, the DNA-protein complex was immunoprecipitated with an anti-C/EBPβ or rabbit IgG as a negative control. Quantitative RT-PCR was performed to detect a proximal DNA element of the Rankl promoter (−216 to −140) or a distal site (4.5 kb upstream) as the negative control. The proximal and distal primers used for ChIP assay are listed in Table 1. n = 6 tubes; *, p < 0.05. All results shown in A–C were representative of at least two independent experiments.
ChIP assays with a specific antibody against C/EBPβ revealed that indeed a proximal region of the mouse Rankl gene promoter responsive to C/EBP expression was amplified specifically by using primers for the region between −216 to −140, when ST2 cells were treated with Dex/IBMX (Fig. 9C). These data are consistent with our concept that C/EBPβ and C/EBPδ bind to the Rankl promoter region, thereby transactivating Rankl gene expression.
DISCUSSION
With aging, bone loss occurs universally not only in humans but also in most animals including mice, and the C57BL/6 mouse strain is a widely accepted model of skeletal aging in which bone volume decreases with aging (23). It has also been reported that bone growth in C57BL/6 mice occurs during the first 3–4 months of life, and reaches a peak at around 5–6 months, followed by a gradual decline that continues throughout the lifespan. Bone loss in older mice is accompanied by a corresponding increase in the number of marrow adipocytes (24). Increased adiposity with aging has been studied mainly from the aspect of an imbalance between adipogenesis and osteoblastogenesis (11). As both adipocytes and osteoblasts are derived from mesenchymal stromal cells, it is reasonable to assume that increased adipogenesis is associated with a reciprocal suppression of osteogenesis (11). In fact, it was reported that haploinsufficiency of PPARγ, a key transcription factor for adipogenesis, promoted bone formation through enhanced osteoblastogenesis and suppression of adipogenesis, a mirror image of what occurs in the aging skeleton (25, 26).
With respect to the link between adipocytes and osteoclasts, several stromal cell lines have been shown to induce osteoclastogenesis (13–15). In the present study, we provide evidence for an osteoclastogenesis-supported ability not only in established stromal cell lines that were induced to differentiate into the adipocytic lineage, but also in primary stromal cells isolated from the bone marrow, especially when cultured under adipogenic conditions. Furthermore, we demonstrated the presence in the bone marrow in vivo of a RANKL- and Pref-1-positive cell population, i.e. RANKL-expressing preadipocytes. By ChIP assay we detected C/EBP binding in vivo to the 5′-region of the Rankl gene between −193 to −138. This region contains a putative binding site of Sp1, which has been reported to interact with C/EBP (27). Taken together with the fact that this region contains no consensus binding site for C/EBP, it is conceivable that C/EBP binds to this region indirectly via Sp1, thereby potentiating Rankl transcription. The fact that C/EBPβ and C/EBPδ, which act at an early stage of the adipogenic program, but not PPARγ, which acts later at the final maturation stage, bind to the Rankl promoter and stimulate Rankl gene transcription, supports the contention that preadipocytes rather than mature adipocytes possess the ability to active Rankl gene transcription, thereby supporting osteoclast development.
RANKL was first identified in T cells as a ligand of RANK on dendritic cells (28), and later found to be identical with the OPG ligand (29) or the osteoclast differentiation factor (30), which had been postulated to be present in osteoblastic/stromal cells (31). RANKL has also been identified in B cells (32) and a number of other cell types (33). Quite surprisingly, it has recently been reported that RANKL is most abundantly expressed in matrix-embedded osteocytes and that the RANKL produced by osteocytes is essential for bone resorption in vivo (33). However, how osteocytes deeply embedded inside bone come into contact with and present RANKL to osteoclast precursors in bone marrow remains an enigma. Adipocytes are surrounded in the bone marrow by hematopoietic cells, making it likely that they easily encounter osteoclast precursor cells of hematopoietic origin and thus are able to present RANKL as an osteoclastogenic signal. For example, leptin has been shown to inhibit oteoclastogenesis both in vitro (34) and in vivo (35), and because leptin treatment is associated with decreased fat mass in bone marrow (36), the reduced osteoclast generation may also be linked with reduced stimulation from adipocytes to hematopoietic osteoclast precursor cells within the marrow microenvironment. Although we showed that the increased number of RANKL-positive preadipocytes correlates with aging in vivo and that osteoclastogenic activity of bone marrow cell cultures ex vivo increases with the age of the animals, it remains to be clarified how much of the age-associated bone loss depends on RANKL derived from preadipocytes in the bone marrow. Quantitative assessment of the impact of specific Rankl deletion in bone marrow preadipocyte on age-related bone loss in vivo would be required to definitively answer this important question.
Attempts to develop in vitro methods that mimic the bone marrow microenvironment in vivo led to the invention of long term bone marrow cultures, represented by the Dexter-type culture for lymphopoiesis (37, 38) and the Whitlock-Witte culture for myelopoiesis (39). There has been no such long term culture system available for osteoclastogenesis that is effective in the absence of osteotrophic factors. To the best of our knowledge, the current study is the first to establish an in vitro culture system for osteoclast colony formation without the need of any exogenous bone-resorbing factors. We also found that osteoclast colonies are markedly increased in bone marrow cultures from aged mice, especially when they are induced toward adipogenic differentiation, and that they survived for several months. Although it is generally recognized that osteoblastogenesis decreases with aging, it has also been reported that CFU-F increases and CFU-Ob remains unaltered or even increases until 18 months old in mice (40, 41), implying that differences in culture conditions and the sex and age of animals used are important.
It has been reported that subcutaneous preadipocytes can trans-differentiate into bone-forming cells in the presence of certain factors (42), and adipocytes and osteoblasts may not be a fixed but rather a flexible phenotype. Thus, during the differentiation pathway from mesenchymal stem cells to adipocytes and osteoblasts, cells exhibit mixed molecular signatures. In the course of our analysis, we found that Pref-1- and RANKL-positive cells in the bone marrow also express B220, albeit weakly. Thus, these intermediate cells may acquire the potential to present RANKL and hence provide an osteoclastogenic microenvironment under certain circumstances, such as in the case of increased adiposity associated with aging, glucocorticoid excess, and other forms of metabolic dysfunction. In conclusion, the potential of bone marrow preadipocytes to express RANKL and support osteoclastogenesis may provide insight into the pathogenesis underlying the co-development of a fatty bone marrow and bone loss with aging.
This work was supported in part by Grant-in-aid for Scientific Research C 18590359 (to S. T.) and a Grant-in-aid for Scientific Research on Innovative Areas 22118007 (to K. I.) from the Ministry of Education, Science of Japan, a grant from the program Promotion of Fundamental Studies in Health Sciences of the National Institute of Biomedical Innovation (NIBIO) of Japan (06-31) (to K. I.), and grants from Ono Foundation (to S. T.), Daiko Foundation (to K. I.), and Tokyo Biochemistry Research Foundation (to K. I.).
- RANKL
- receptor activator for NF-κB ligand
- C/EBP
- CCAAT/enhancer-binding protein
- Dex
- dexamethasone
- IBMX
- 3-isobutyl-1-methylxanthine
- OPG
- osteoprotegerin
- TRAP
- tartrate-resistant acid phosphatase
- PE
- phycoerythrin
- PPARγ
- peroxisome proliferator-activated receptor γ
- TZD
- troglitazone
- BADGE
- bisphenol A diglycidyl ether.
REFERENCES
- 1. Rozman C., Feliu E., Berga L., Reverter J. C., Climent C., Ferrán M. J. (1989) Age-related variations of fat tissue fraction in normal human bone marrow depend both on size and number of adipocytes: a stereological study. Exp. Hematol. 17, 34–37 [PubMed] [Google Scholar]
- 2. Gimble J. M., Robinson C. E., Wu X., Kelly K. A. (1996) The function of adipocytes in the bone marrow stroma: an update. Bone 19, 421–428 [DOI] [PubMed] [Google Scholar]
- 3. Justesen J., Stenderup K., Ebbesen E. N., Mosekilde L., Steiniche T., Kassem M. (2001) Adipocyte tissue volume in bone marrow is increased with aging and in patients with osteoporosis. Biogerontology 2, 165–171 [DOI] [PubMed] [Google Scholar]
- 4. Moore S. G., Dawson K. L. (1990) Red and yellow marrow in the femur: age-related changes in appearance at MR imaging. Radiology 175, 219–223 [DOI] [PubMed] [Google Scholar]
- 5. Duque G. (2008) Bone and fat connection in aging bone. Curr. Opin. Rheumatol. 20, 429–434 [DOI] [PubMed] [Google Scholar]
- 6. Verma S., Rajaratnam J. H., Denton J., Hoyland J. A., Byers R. J. (2002) Adipocytic proportion of bone marrow is inversely related to bone formation in osteoporosis. J. Clin. Pathol. 55, 693–698 [DOI] [PMC free article] [PubMed] [Google Scholar]
- 7. Jee W. S., Wronski T. J., Morey E. R., Kimmel D. B. (1983) Effects of spaceflight on trabecular bone in rats. Am. J. Physiol. 244, R310–R314 [DOI] [PubMed] [Google Scholar]
- 8. Kawai K., Tamaki A., Hirohata K. (1985) Steroid-induced accumulation of lipid in the osteocytes of the rabbit femoral head. A histochemical and electron microscopic study. J. Bone Joint Surg. Am. 67, 755–763 [PubMed] [Google Scholar]
- 9. Martin R. B., Chow B. D., Lucas P. A. (1990) Bone marrow fat content in relation to bone remodeling and serum chemistry in intact and ovariectomized dogs. Calcif. Tissue Int. 46, 189–194 [DOI] [PubMed] [Google Scholar]
- 10. Martin R. B., Zissimos S. L. (1991) Relationships between marrow fat and bone turnover in ovariectomized and intact rats. Bone 12, 123–131 [DOI] [PubMed] [Google Scholar]
- 11. Rosen C. J., Bouxsein M. L. (2006) Mechanisms of disease: is osteoporosis the obesity of bone? Nat. Clin. Pract. Rheumatol. 2, 35–43 [DOI] [PubMed] [Google Scholar]
- 12. Bethel M., Chitteti B. R., Srour E. F., Kacena M. A. (2013) The changing balance between osteoblastogenesis and adipogenesis in aging and its impact on hematopoiesis. Curr. Osteoporos. Rep. 11, 99–106 [DOI] [PMC free article] [PubMed] [Google Scholar]
- 13. Benayahu D., Peled A., Zipori D. (1994) Myeloblastic cell line expresses osteoclastic properties following coculture with marrow stromal adipocytes. J. Cell. Biochem. 56, 374–384 [DOI] [PubMed] [Google Scholar]
- 14. Kelly K. A., Tanaka S., Baron R., Gimble J. M. (1998) Murine bone marrow stromally derived BMS2 adipocytes support differentiation and function of osteoclast-like cells in vitro. Endocrinology 139, 2092–2101 [DOI] [PubMed] [Google Scholar]
- 15. Sakaguchi K., Morita I., Murota S. (2000) Relationship between the ability to support differentiation of osteoclast-like cells and adipogenesis in murine stromal cells derived from bone marrow. Prostaglandins Leukot. Essent. Fatty Acids 62, 319–327 [DOI] [PubMed] [Google Scholar]
- 16. Tatsumi S., Ishii K., Amizuka N., Li M., Kobayashi T., Kohno K., Ito M., Takeshita S., Ikeda K. (2007) Targeted ablation of osteocytes induces osteoporosis with defective mechanotransduction. Cell Metab. 5, 464–475 [DOI] [PubMed] [Google Scholar]
- 17. Takeshita S., Arai S., Kudo A. (2001) Identification and characterization of mouse bone marrow stromal cell lines immortalized by temperature-sensitive SV40 T antigen: supportive activity for osteoclast differentiation. Bone 29, 236–241 [DOI] [PubMed] [Google Scholar]
- 18. Takeshita S., Kaji K., Kudo A. (2000) Identification and characterization of the new osteoclast progenitor with macrophage phenotypes being able to differentiate into mature osteoclasts. J. Bone Miner. Res. 15, 1477–1488 [DOI] [PubMed] [Google Scholar]
- 19. Takeshita S., Namba N., Zhao J. J., Jiang Y., Genant H. K., Silva M. J., Brodt M. D., Helgason C. D., Kalesnikoff J., Rauh M. J., Humphries R. K., Krystal G., Teitelbaum S. L., Ross F. P. (2002) SHIP-deficient mice are severely osteoporotic due to increased numbers of hyper-resorptive osteoclasts. Nat. Med. 8, 943–949 [DOI] [PubMed] [Google Scholar]
- 20. Nagase Y., Iwasawa M., Akiyama T., Kadono Y., Nakamura M., Oshima Y., Yasui T., Matsumoto T., Hirose J., Nakamura H., Miyamoto T., Bouillet P., Nakamura K., Tanaka S. (2009) Anti-apoptotic molecule Bcl-2 regulates the differentiation, activation, and survival of both osteoblasts and osteoclasts. J. Biol. Chem. 284, 36659–36669 [DOI] [PMC free article] [PubMed] [Google Scholar]
- 21. Smas C. M., Sul H. S. (1993) Pref-1, a protein containing EGF-like repeats, inhibits adipocyte differentiation. Cell 73, 725–734 [DOI] [PubMed] [Google Scholar]
- 22. Rosen E. D. (2005) The transcriptional basis of adipocyte development. Prostaglandins Leukot. Essent. Fatty Acids 73, 31–34 [DOI] [PubMed] [Google Scholar]
- 23. Halloran B. P., Ferguson V. L., Simske S. J., Burghardt A., Venton L. L., Majumdar S. (2002) Changes in bone structure and mass with advancing age in the male C57BL/6J mouse. J. Bone Miner. Res. 17, 1044–1050 [DOI] [PubMed] [Google Scholar]
- 24. Lazarenko O. P., Rzonca S. O., Hogue W. R., Swain F. L., Suva L. J., Lecka-Czernik B. (2007) Rosiglitazone induces decreases in bone mass and strength that are reminiscent of aged bone. Endocrinology 148, 2669–2680 [DOI] [PMC free article] [PubMed] [Google Scholar]
- 25. Akune T., Ohba S., Kamekura S., Yamaguchi M., Chung U. I., Kubota N., Terauchi Y., Harada Y., Azuma Y., Nakamura K., Kadowaki T., Kawaguchi H. (2004) PPARγ insufficiency enhances osteogenesis through osteoblast formation from bone marrow progenitors. J. Clin. Invest. 113, 846–855 [DOI] [PMC free article] [PubMed] [Google Scholar]
- 26. Takada I., Mihara M., Suzawa M., Ohtake F., Kobayashi S., Igarashi M., Youn M. Y., Takeyama K., Nakamura T., Mezaki Y., Takezawa S., Yogiashi Y., Kitagawa H., Yamada G., Takada S., Minami Y., Shibuya H., Matsumoto K., Kato S. (2007) A histone lysine methyltransferase activated by non-canonical Wnt signalling suppresses PPAR-γ transactivation. Nat. Cell. Biol. 9, 1273–1285 [DOI] [PubMed] [Google Scholar]
- 27. Chiang B. T., Liu Y. W., Chen B. K., Wang J. M., Chang W. C. (2006) Direct interaction of C/EBPδ and Sp1 at the GC-enriched promoter region synergizes the IL-10 gene transcription in mouse macrophage. J. Biomed. Sci. 13, 621–635 [DOI] [PubMed] [Google Scholar]
- 28. Anderson D. M., Maraskovsky E., Billingsley W. L., Dougall W. C., Tometsko M. E., Roux E. R., Teepe M. C., DuBose R. F., Cosman D., Galibert L. (1997) A homologue of the TNF receptor and its ligand enhance T-cell growth and dendritic-cell function. Nature 390, 175–179 [DOI] [PubMed] [Google Scholar]
- 29. Lacey D. L., Timms E., Tan H. L., Kelley M. J., Dunstan C. R., Burgess T., Elliott R., Colombero A., Elliott G., Scully S., Hsu H., Sullivan J., Hawkins N., Davy E., Capparelli C., Eli A., Qian Y. X., Kaufman S., Sarosi I., Shalhoub V., Senaldi G., Guo J., Delaney J., Boyle W. J. (1998) Osteoprotegerin ligand is a cytokine that regulates osteoclast differentiation and activation. Cell 93, 165–176 [DOI] [PubMed] [Google Scholar]
- 30. Yasuda H., Shima N., Nakagawa N., Yamaguchi K., Kinosaki M., Mochizuki S., Tomoyasu A., Yano K., Goto M., Murakami A., Tsuda E., Morinaga T., Higashio K., Udagawa N., Takahashi N., Suda T. (1998) Osteoclast differentiation factor is a ligand for osteoprotegerin/osteoclastogenesis-inhibitory factor and is identical to TRANCE/RANKL. Proc. Natl. Acad. Sci. U.S.A. 95, 3597–3602 [DOI] [PMC free article] [PubMed] [Google Scholar]
- 31. Suda T., Takahashi N., Udagawa N., Jimi E., Gillespie M. T., Martin T. J. (1999) Modulation of osteoclast differentiation and function by the new members of the tumor necrosis factor receptor and ligand families. Endocr. Rev. 20, 345–357 [DOI] [PubMed] [Google Scholar]
- 32. Kanematsu M., Sato T., Takai H., Watanabe K., Ikeda K., Yamada Y. (2000) Prostaglandin E2 induces expression of receptor activator of nuclear factor-κB ligand/osteoprotegrin ligand on pre-B cells: implications for accelerated osteoclastogenesis in estrogen deficiency. J. Bone Miner. Res. 15, 1321–1329 [DOI] [PubMed] [Google Scholar]
- 33. O'Brien C. A., Nakashima T., Takayanagi H. (2013) Osteocyte control of osteoclastogenesis. Bone 54, 258–263 [DOI] [PMC free article] [PubMed] [Google Scholar]
- 34. Holloway W. R., Collier F. M., Aitken C. J., Myers D. E., Hodge J. M., Malakellis M., Gough T. J., Collier G. R., Nicholson G. C. (2002) Leptin inhibits osteoclast generation. J. Bone Miner. Res. 17, 200–209 [DOI] [PubMed] [Google Scholar]
- 35. Burguera B., Hofbauer L. C., Thomas T., Gori F., Evans G. L., Khosla S., Riggs B. L., Turner R. T. (2001) Leptin reduces ovariectomy-induced bone loss in rats. Endocrinology 142, 3546–3553 [DOI] [PubMed] [Google Scholar]
- 36. Hamrick M. W., Della-Fera M. A., Choi Y. H., Pennington C., Hartzell D., Baile C. A. (2005) Leptin treatment induces loss of bone marrow adipocytes and increases bone formation in leptin-deficient ob/ob mice. J. Bone Miner. Res. 20, 994–1001 [DOI] [PubMed] [Google Scholar]
- 37. Dexter T. M., Wright E. G., Krizsa F., Lajtha L. G. (1977) Regulation of haemopoietic stem cell proliferation in long term bone marrow cultures. Biomedicine 27, 344–349 [PubMed] [Google Scholar]
- 38. Dexter T. M., Allen T. D., Lajtha L. G. (1977) Conditions controlling the proliferation of haemopoietic stem cells in vitro. J. Cell. Physiol. 91, 335–344 [DOI] [PubMed] [Google Scholar]
- 39. Whitlock C. A., Witte O. N. (1982) Long-term culture of B lymphocytes and their precursors from murine bone marrow. Proc. Natl. Acad. Sci. U.S.A. 79, 3608–3612 [DOI] [PMC free article] [PubMed] [Google Scholar]
- 40. Zhang W., Ou G., Hamrick M., Hill W., Borke J., Wenger K., Chutkan N., Yu J., Mi Q. S., Isales C. M., Shi X. M. (2008) Age-related changes in the osteogenic differentiation potential of mouse bone marrow stromal cells. J. Bone Miner. Res. 23, 1118–1128 [DOI] [PMC free article] [PubMed] [Google Scholar]
- 41. Shahnazari M., Dwyer D., Chu V., Asuncion F., Stolina M., Ominsky M., Kostenuik P., Halloran B. (2012) Bone turnover markers in peripheral blood and marrow plasma reflect trabecular bone loss but not endocortical expansion in aging mice. Bone 50, 628–637 [DOI] [PubMed] [Google Scholar]
- 42. Justesen J., Pedersen S. B., Stenderup K., Kassem M. (2004) Subcutaneous adipocytes can differentiate into bone-forming cells in vitro and in vivo. Tissue Eng. 10, 381–391 [DOI] [PubMed] [Google Scholar]