Background: The mitochondrial apoptotic pathway has a non-apoptotic role in cell differentiation.
Results: Differentiation of mouse embryonic stem cells into cardiomyocytes passes through a mitochondrial pathway of apoptosis.
Conclusion: The delayed mitochondrial apoptotic pathway in mouse embryonic stem cells delivers cells into differentiation, not cell death.
Significance: Such a comparative study could help to clarify ambiguities about the death-centric model of differentiation.
Keywords: Apoptosis, ATP, Bioluminescence, Caspase, Cell Death, Cell Differentiation, Mitochondrial Apoptosis
Abstract
Differentiation is an inseparable process of development in multicellular organisms. Mouse embryonic stem cells (mESCs) represent a valuable research tool to conduct in vitro studies of cell differentiation. Apoptosis as a well known cell death mechanism shows some common features with cell differentiation, which has caused a number of ambiguities in the field. The research question here is how cells could differentiate these two processes from each other. We have investigated the role of the mitochondrial apoptotic pathway and cell energy level during differentiation of mESCs into the cardiomyocytes and their apoptosis. p53 expression, cytochrome c release, apoptosome formation, and caspase-3/7 activation are observed upon induction of both apoptosis and differentiation. However, remarkable differences are detected in time of cytochrome c appearance, apoptosome formation, and caspase activity upon induction of both processes. In apoptosis, apoptosome formation and caspase activity were observed rapidly following the cytochrome c release. Unlike apoptosis, the release of cytochrome c upon differentiation took more time, and the maximum caspase activity was also postponed for 24 h. This delay suggests that there is a regulatory mechanism during differentiation of mESCs into cardiomyocytes. The highest ATP content of cells was observed immediately after cytochrome c release 6 h after apoptosis induction and then decreased, but it was gradually increased up to 48 h after differentiation. These observations suggest that a delay in the release of cytochrome c or delay in ATP increase attenuate apoptosome formation, and caspase activation thereby discriminates apoptosis from differentiation in mESCs.
Introduction
In multicellular animals, apoptosis is a well known complementary pathway to proliferation, ensuring development, homeostasis, and integrity of tissues, and is an essential feature of their evolution (1). It is an ATP-dependent process executed by a cysteine protease family known as caspase. Caspases are initially synthesized as inactive procaspases. Their activation requires a proteolytic processing, which occurs through two different pathways: the extrinsic/death receptor pathway and the intrinsic/mitochondrial pathway. In the death receptor pathway, the first executioner caspase (caspase-8) is activated by autoprocessing, whereas in the mitochondrial pathway, the first executioner caspase (caspase-9) is dependent on cytochrome c release (2, 3).
A growing body of evidence suggests that the mitochondrial pathway has another role in the cell differentiation process in which specialized cell types emerge. For example, cytochrome c release in differentiation of lens fiber epithelial cells, monocytes, and sperm and also caspase activity in differentiation of osteoclasts, keratinocytes, erythrocytes, and myocytes have been reported (4–12). In addition, several studies have shown that low level or short exposure of apoptogenic factors in undifferentiated or cancer cells can induce differentiation through a mitochondrion-mediated apoptotic pathway (6, 13).
According to the mentioned evidence, apoptosis and differentiation are physiological processes that share many common features (e.g. chromatin condensation, cytochrome c release, and caspase activation). Due to these common features, a common origin for differentiation and apoptosis has been suggested, and even differentiation process is considered as a modified form of cell death (14). Nevertheless, the death-centric model of differentiation contains some ambiguities, such as how a common pathway can bring two different fates and what factors determine cell death versus differentiation during activation of the apoptotic pathway.
In the present study, we attempt to address these questions by two routes: monitoring the mitochondrial pathway of cell death, including cytochrome c release, apoptosome formation, and caspase activity, and tracking energetic oscillation during apoptosis progress and differentiation in mESCs. Because these two process pass through the same channel, mitochondria, we hypothesize upon release of cytochrome c, time and intensity of apoptosome formation and caspase-3/7 activity would have crucial effects. A powerful and sensitive tool to monitor cytochrome c release and pursue apoptosome formation based on the split luciferase complementary assay has recently been developed. This biosensor detects and reports apoptosome formation based on Apaf-1 (apoptotic protease-activating factor-1) oligomerization (15). Our evidence has revealed the roles of cellular ATP oscillations in apoptosome formation during apoptosis and differentiation.
EXPERIMENTAL PROCEDURES
Cell Culture
The mESC line Royan B16, derived from the C57BL6 mouse strain (16), was cultured in gelatin (0.1%; Sigma-Aldrich, G2500)-coated flasks (SPL) containing mESC3 medium (R2i condition) containing DMEM/F-12 (Invitrogen, 980891) and neurobasal (Invitrogen, 21103) at a 1:1 ratio, 1% N2 supplement (Invitrogen, 17502-048), 1% B27 supplement (Invitrogen, 17504-044), 2 mm l-glutamine (Invitrogen, 25030-081), 1% nonessential amino acids (Invitrogen, 11140-035), penicillin/streptomycin (Invitrogen, 15070-063), 0.1 mm β-mercaptoethanol (Sigma-Aldrich, M7522), 5 mg/ml BSA (Sigma-Aldrich, A9418), and 1000 units/ml mouse leukemia-inhibitory factor (Royan Institute). Small molecules used for maintenance of pluripotency under feeder-free conditions were the R2i compound, which consisted of PD0325901 (1 μm; Sigma-Aldrich) and SB431542 (10 μm; Sigma-Aldrich). The cells were maintained at 37 °C in an incubator with 5% CO2.
Cardiac Differentiation Induction of mESC Line
Differentiation of the mESC line was initiated by the static suspension culture in non-attach Petri dishes (Griner, 628-102) at a density of 105 cells/ml. After 2 days, formed spheroid bodies were harvested and transferred to the differentiation medium containing knock-out DMEM (Invitrogen, 1098675), 1 μm non-essential amino acids, 1 mm glutamine, 100 μm β-mercaptoethanol, and 1% penicillin and streptomycin in the presence of 0.2 μm ascorbic acid. Formed embryoid bodies were plated on gelatin (0.1%; Sigma-Aldrich, G2500)-coated plates at day 5. Differentiation medium was renewed every 2 days for a week.
Apoptosis Induction of mESC Line
To induce apoptosis induction, all steps were similar to differentiation, and instead of ascorbic acid, an apoptogenic chemical, doxorubicin (Ebendoxo, EBEWE Pharma Ges), at a variety of concentrations (0, 0.1, 0.2, 0.5, 0.7, and 1 μm) was added to the undifferentiated mESCs and incubated at 37 °C for 24 h. Following incubation, all experiments were performed in the presence of doxorubicin (0.5 μm).
Cell Extract Preparation and Protein Concentration Measurement
To prepare cell extract, two different methods were applied. Cytosolic fractionation by hypotonic buffer containing 10 mm HEPES-KOH, pH 7.5, 1.5 mm MgCl2, 10 mm KCl, 1.0 mm Na-EDTA, 68 mm sucrose, 1.0 mm PMSF. In this method, harvested cells at 6, 12, 24, and 48 h were washed twice with cold PBS, trypsinized, pelleted by centrifugation at various time points, and then resuspended in 200 μl of cold hypotonic buffer. The cells were then allowed to swell on ice for 10 min and then mixed for 30 s by vortex. The hypotonic buffer A caused the cells to swell and burst (17). The cell debris was pelleted by centrifugation at 4 °C, 12,000 rpm for 30 s. The supernatant cell lysate was removed for various assays and stored at −80 °C. Cell lysis was done with cell culture lysis reagent (CCLR) containing 100 mm potassium phosphate, pH 7.8, 1 mm EDTA, 7 mm 2-mercaptoethanol, 1% (v/v) Triton X-100, and 10% (v/v) glycerol. Harvested cells at the indicated times were mixed with 100 μl of CCLR buffer, and the mix was stored at −80 °C. To determine Protein concentrations of cell lysates, the standard Bradford method was applied.
Immunoblotting
Cell lysate prepared by CCLR and the cytosolic fractionation method was used to assess p53 expression and determine cytochrome c. Equal amounts of total protein were separated by electrophoresis on a 12% SDS-polyacrylamide gel and transferred onto the polyvinylidene difluoride (PVDF) membrane. p53 and cytochrome c were identified by a reaction with specific primary and secondary antibodies linked to horseradish peroxidase. Reactive bands were detected with staining by diaminobenzidine. Antibodies were purchased from Abcam.
Generation of Transfected mESC Line
To monitor apoptosome formation during apoptosis and differentiation, cotransfection of mESCs with two vectors containing split luciferase genes connected to the APAF1 gene (pcDNA-NLuc-APAF1 and pcDNA-CLuc-APAF1) were transiently performed by Lipofectamine 2000 (Invitrogen). The day after transfection, differentiation and apoptosis were induced in transfected mESCs as described earlier.
Split Luciferase Biosensor Activity
Cell lysate prepared by the cytosolic fractionation method at times 2, 6, 24, and 48 h after induction of apoptosis and differentiation in transfected mESCs was used to assay the split luciferase activity based on the methods reported earlier and using a luminometer (Berthold Detection System) (15).
Caspase-9 Activity Assay
A colorimetric assay was used to measure caspase-9 activity (GenScript). Cell lysate prepared by the cytosolic fractionation method at the indicated times with equal protein concentration was subjected to detect caspase-9 activity as described by the manufacturer.
Caspase-3/7 Activity Assay
The Caspase-Glo 3/7 luminescent assay system was used to measure caspase activity (Promega). Cell lysate prepared by the cytosolic fractionation method in the indicated times with equal protein concentration was subjected to detection of caspase-3/7 activity as described by the manufacturer.
Apoptosis Measurement
Annexin V and a propidium iodide (PI) staining kit (IQ product) was used to detect apoptosis at 6, 24, and 48 h after apoptosis and differentiation induction. Cells were trypsinized and pelleted by centrifugation at room temperature at 1200 rpm for 5 min. Staining was performed following the manufacturer's instructions and was analyzed by a FACSCalibur flow cytometer.
PARP-1 Immunoblotting
Cell lysate prepared by CCLR was subjected to immunoblotting of PARP-1. Equal amounts of total protein were separated by electrophoresis on a 10% SDS-polyacrylamide gel and transferred onto the PVDF membrane. PARP-1 was identified by a reaction with polyclonal primary and secondary antibodies linked to horseradish peroxidase. Reactive bands were detected with staining by diaminobenzidine. Antibodies were purchased from Abcam.
Oct4 and Nanog Immunoblotting
Cell lysate prepared by CCLR was used to assess Oct4 and Nanog changes during differentiation. Equal amounts of total protein were separated by electrophoresis on a 12% SDS-polyacrylamide gel and transferred onto the PVDF membrane. Oct4 and Nanog were identified by reaction with polyclonal primary and secondary antibodies linked to horseradish peroxidase. Reactive bands were detected with staining by diaminobenzidine. Antibodies were purchased from Santa Cruz Biotechnology, Inc.
ATP Measurement
Cell lysate prepared by CCLR buffer at the indicated times was subjected to ATP measurement. Cellular ATP content was measured by the firefly luciferase assay. A standard curve was obtained by making a dilution series of ATP as standard solution. A luciferin-luciferase assay was performed by a luminometer, as reported earlier (18, 19).
Complex I Activity Assay
In order to measure the enzymatic activity of mitochondrial complex I in cell lysate prepared by CCLR buffer, NADH-ferricyanide reductase activity was assayed spectrophotometrically by using oxidized ferricyanide at 410 nm and 30 °C. The assay mixture contained the following in 1 ml: NADH, ferricyanide, triethanolamine, and phosphate buffer (pH 7.8) (20, 21).
RESULTS
Differentiation of mESCs into Cardiomyocytes
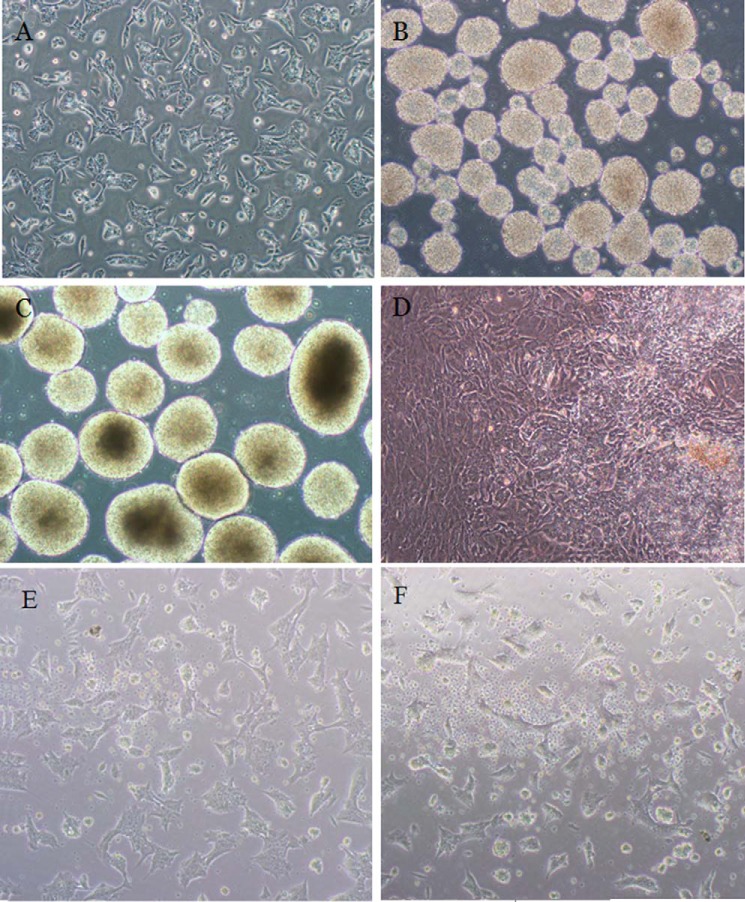
A pluripotent stem cell line (Royan B 16 cell line) with the ability to differentiate into cells of all three germ layers was used in this study (16). Homogeneity of mESCs was confirmed by a flow cytometry assay (data not shown). In order to evaluate differentiation process into cardiomyocytes, the mESC line was cultured in a suspension method with a defined cell number. Differentiation induction was performed upon spheroid body formation. Cardiac differentiation was confirmed by observation of beating cardiomyocytes (Fig. 1).
FIGURE 1.
mESC differentiation into the cardiomyocytes and their apoptosis. A, undifferentiated mESCs; B, spheroid bodies; C, embryoid bodies; D, cardiomyocytes; E, non-apoptotic mESCs; F, apoptotic mESCs in the presence of doxorubicin (0.5 μm).
Doxorubicin-induced Apoptosis
Different cell lines show different sensitivity to apoptogenic agents, such as doxorubicin. In the present study to determine the apoptogenic concentration of doxorubicin for Royan B16, the mESC line was grown in the presence of a variety of concentrations of doxorubicin for 24 h, and 0.5 μm doxorubicin was chosen (Fig. 1).
p53 Expression in Differentiation and Apoptosis of mESC Line
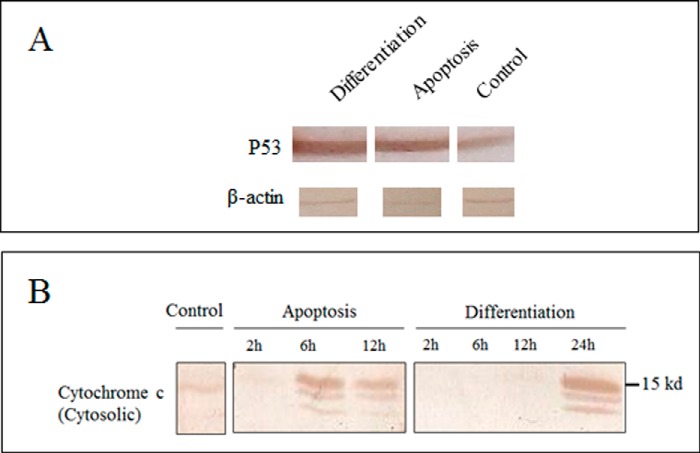
p53 is a critical mediator of mESC differentiation; however, its apoptotic role in mESC is controversial (22). To explicate the p53 dependence/independence of both processes, its expression was studied by immunoblotting using anti-p53 antibody. As shown in Fig. 2A, its accumulation occurred in both processes, showing p53 dependence of both apoptosis and differentiation.
FIGURE 2.
p53 expression and cytochrome c release in apoptosis and differentiation. A, immunoblotting of p53 was performed 6 and 24 h after apoptosis and differentiation induction. B, immunoblotting of cytochrome c was performed 2, 6, and 12 h and 2, 6, 12, and 24 h after apoptosis and differentiation induction, respectively.
Cytochrome c Release in Differentiation and Apoptosis Processes of mESC Line
Cytochrome c release is a critical step in the intrinsic pathway of apoptosis which has been reported in the differentiation of several cell lines (4, 6, 23). In order to determine the cytochrome c release during cardiac differentiation and its comparison with apoptosis, immunoblotting with antibodies against cytochrome c was performed at 2, 6, 12, and 24 h after induction of apoptosis and differentiation. As shown in Fig. 2B, release of cytochrome c has been observed in cardiac differentiation, similar to apoptosis, although it occurs with a delay in differentiation.
Apoptosome Formation in Differentiation and Apoptosis Processes in mESC Line
Apaf-1 is a cytosolic protein; its binding to the free cytochrome c within cytosol induces its oligomerization into a heptameric complex named apoptosome. This machinery has a pivotal role in activating caspase-9 and promoting the apoptosis cascade in apoptotic cells (24). Although this machinery shows a known function in apoptosis, its role has not yet been reported in differentiation. Here we examined its engagement in apoptosis and differentiation of mESCs using a split luciferase complementary assay. Using split luciferase activity, apoptosome formation has been shown within 6 h after apoptosis induction of mESCs (Fig. 3). Moreover, 24 h after the induction of differentiation in the mESC line, activity of the split luciferase due to apoptosome formation was observed (Fig. 3). It should be pointed out that, although a large number of cells were pooled and apoptosome formation within them was monitored, this might indicate the lack of a subpopulation of apoptotic cells within the differentiating cells.
FIGURE 3.
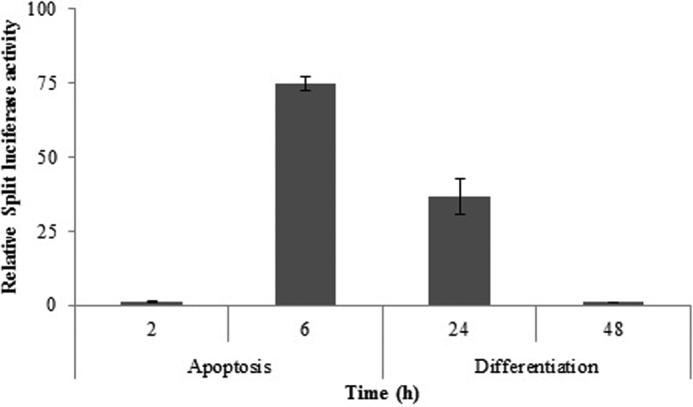
Split luciferase activity upon induction of apoptosis and differentiation (data expressed relative to control). The data are means ± S.D. (error bars) of triplicate experiments.
Caspase-9 Activity in Differentiation and Apoptosis Processes of mESC Line
Caspase-9 is the initiator caspase of the mitochondrial pathway. Caspase-9 activity was tracked at 6 h after apoptosis induction, 24 and 48 h after differentiation induction. As displayed in Fig. 4, during differentiation, caspase-9 activity at 24 h was not changed, whereas its activity increased slightly at 48 h after induction. In cells treated with doxorubicin, caspase-9 activity was increased 10 times.
FIGURE 4.
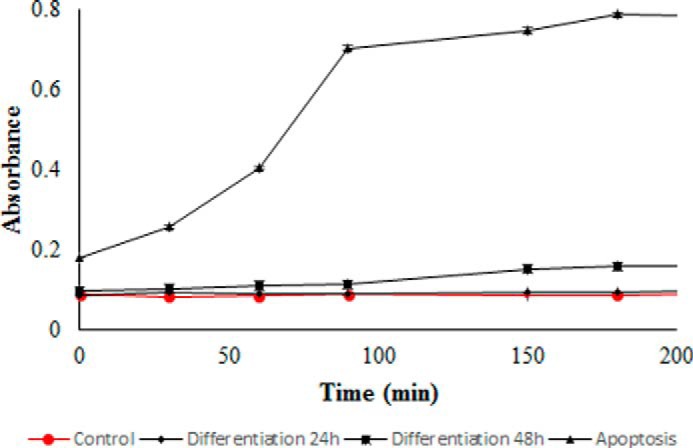
Caspase-9 activity. The caspase-9 activity assay was performed 6 h after apoptosis induction and 24 and 48 h after differentiation induction. The data are means ± S.D. (error bars) of triplicate experiments.
Caspase-3/7 Activity in Differentiation and Apoptosis Processes of mESC Line
The major executioners of the apoptosis pathway are caspases 3 and 7, the activities of which have been indicated during differentiation of monocytes, keratinocytes, and other cells. In this study, caspase-3/7 activity was monitored at 6, 12, 24, and 48 h after the induction of apoptosis, and it was continued until 7 days in differentiation. In the case of apoptosis, 6 h after induction, caspase-3/7 activity increased nearly 9 times more than control, whereas during differentiation of mESCs into cardiomyocytes, no significant activity was observed up to 48 h after induction of differentiation. As indicated in Fig. 5, 48 h after induction, caspase-3/7 activity was increased about 5 times. Therefore, the rise in caspase-3/7 activity was achieved over longer times and at lower activity than observed in apoptosis (Fig. 5).
FIGURE 5.
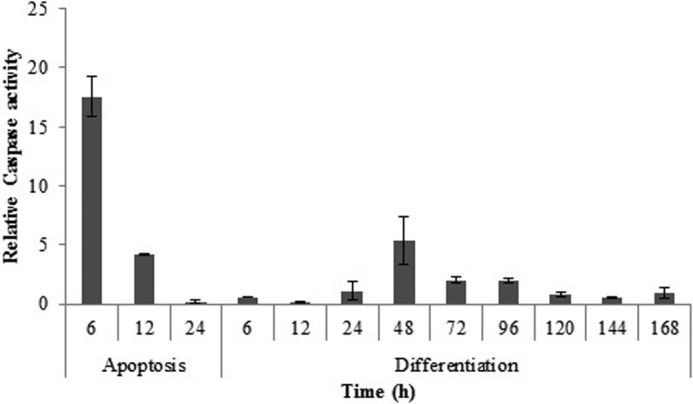
Caspase-3/7 activity. The caspase-3/7 activity assay was performed 6, 12, and 24 h after apoptosis and 6, 12, 24, 48, 72, 96, 120, 144, and 168 h after differentiation induction. (The data are expressed relative to control). The data are means ± S.D. (error bars) of triplicate experiments.
Apoptosis Detection in mESC Differentiation
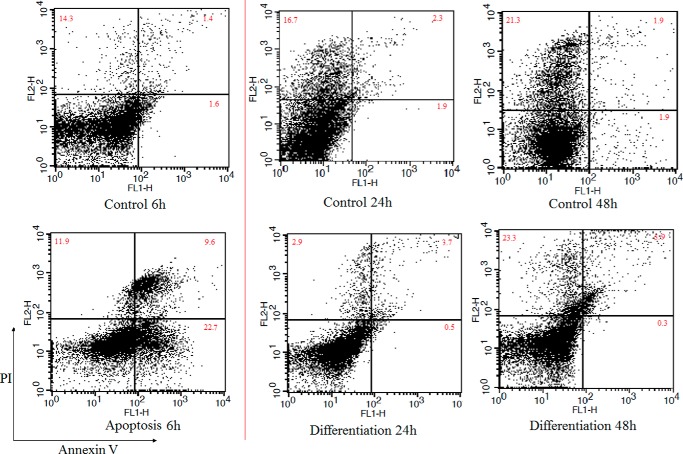
One of the hallmarks of apoptosis is phosphatidylserine translocation from the inner to the outer surface of the plasma membrane (25). To demonstrate the ratio of apoptosis during differentiation, annexin V and PI staining of cells were applied at 24 and 48 h after differentiation induction and also 6 h after doxorubicin treatment as a positive control of apoptosis. As indicated in Fig. 6, in control cells at 6, 24, and 48 h, the percentage of early apoptotic cells (annexin V+/PI−) was 1.6, 1.9, and 1.9%; in late apoptotic cells (annexin V−/PI+), it was 14.3, 16.7, and 21.3%; and in necrotic cells (annexin V+/PI+), it was 1.4, 2.3, and 1.9%. In differentiating cells at 24 and 48 h after induction, the percentage of early apoptotic cells (annexin V+/PI−) was 0.5 and 0.3%; in late apoptotic cells (annexin V−/PI+), it was 2.9 and 23.3%; and in necrotic cells (annexin V+/PI+), it was 3.7 and 5.9%. In cells treated with doxorubicin for 6 h, the percentage of early apoptotic cells (annexin V+/PI−) was 22.7%; in late apoptotic cells (annexin V−/PI+), it was 11.9%; and in necrotic cells (annexin V+/PI+), it was 9.6%.
FIGURE 6.
Apoptosis detection using annexin V/PI staining. Viable cells (annexin V−/PI−), early apoptotic cells (annexin V+/PI−), late apoptotic cells (annexin V−/PI+), and necrotic cells (annexin V+/PI+) are located in the bottom left, bottom right, top right, and top left quadrants, respectively. The numbers in each quadrant represent the percentage of cells.
PARP-1 Cleavage in Differentiation and Apoptosis Processes
PARP-1 cleavage into two fragments, 89 and 24 kDa, is a hallmark of apoptosis (26). As indicated in Fig. 7A, in cells treated with doxorubicin, 6 h after apoptosis induction, an 89 kDa band is apparent. In the case of differentiation, 24 h after induction, no cleavage in PARP-1 was seen, but 48 h after induction, a cleaved form of PARP-1 with a pattern different from that of apoptotic cells appeared.
FIGURE 7.
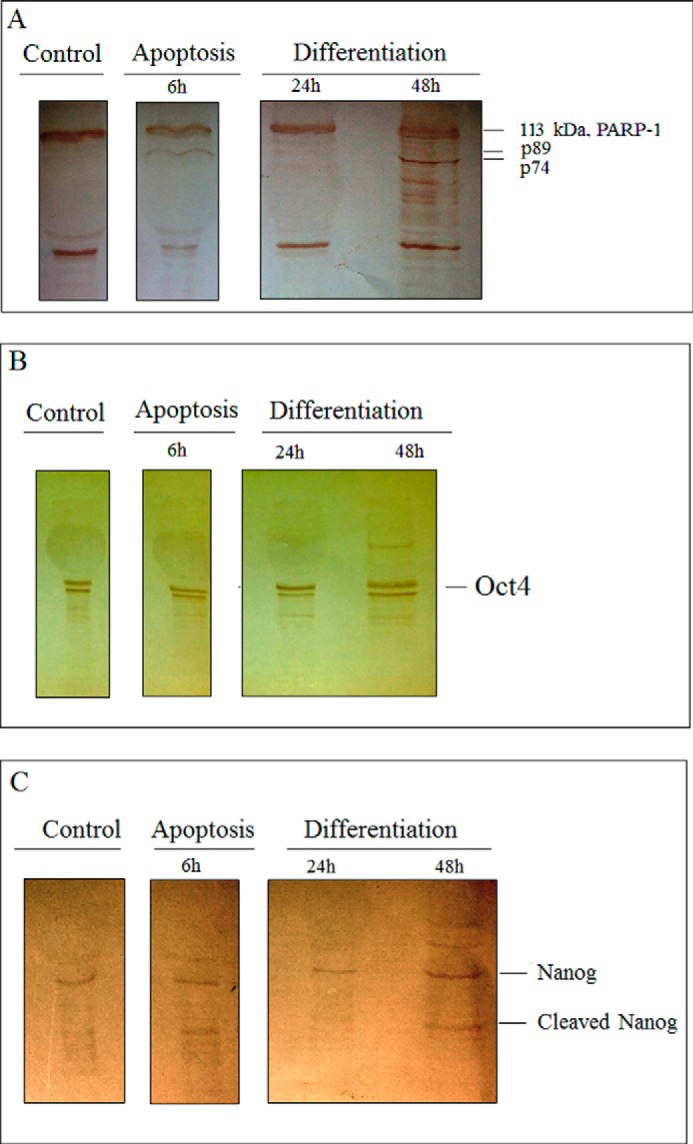
PARP-1, Oct4, and Nanog immunoblotting. To follow PARP-1, Oct4, and Nanog cleavage, immunoblotting of the mentioned proteins was carried out 6 h after apoptosis induction and 24 and 48 h after differentiation induction. A, PARP-1; B, Oct4; C, Nanog.
Oct4 and Nanog Cleavage in Differentiation and Apoptosis
Oct4 and Nanog are the major transcription factors involved in pluripotency (27). Immunoblotting of Oct4 and Nanog was performed to determine whether or not they are substrates for activated caspases in differentiation. The result shows that Oct4 is not a caspase substrate in both processes; however, at time 48 h after differentiation, a decrease in the intact form is indicated (Fig. 7B). As indicated in Fig. 7C, in differentiating cells at time 48 h after induction and cells treated with doxorubicin 6 h after apoptosis induction, the cleaved form of Nanog appears.
ATP Changes in Differentiation and Apoptosis
ATP changes in cardiac differentiation were evaluated because of its role in regulation of caspase activity and apoptosome formation. The content of ATP was measured at 6, 12, 24, and 48 h after the induction of apoptosis and differentiation using a firefly luciferase assay. The undifferentiated mESC line, which, set as a control, had lower ATP in comparison with apoptotic and differentiating cells (Fig. 8). 6 h after induction of apoptosis, cellular ATP content reached the highest concentration (2.9 μm), and after that it was decreased, whereas, as indicated in Fig. 8, upon induction of differentiation, the cellular ATP content was increased up to 48 h (2.1 μm).
FIGURE 8.
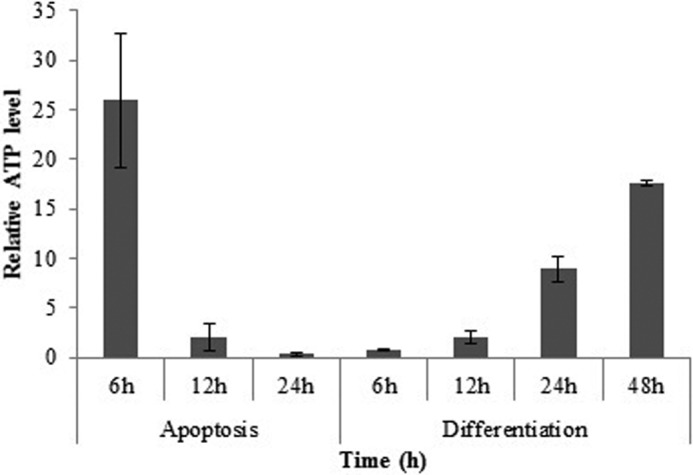
ATP measurement upon induction of apoptosis and differentiation. ATP measurement was performed 6, 12, and 24 h and 6, 12, 24, and 48 h after apoptosis and differentiation induction, respectively. (The data are expressed relative to control). The data are means ± S.D. (error bars) of triplicate experiments.
Complex I Activity in Differentiation and Apoptosis Processes of mESC Line
Mitochondria are the main source of ATP production in cells using the electron transfer chain. To examine the mitochondrial contribution to observed energetic changes during differentiation and apoptosis, the activity of mitochondrial complex I, one of the major complexes in the electron transport chain, was kinetically assayed. As shown in Fig. 9 in apoptotic cells, the most activity of complex I (0.13 units/mg) was correlated with 12 h after induction, and then it was decreased. In the case of differentiating cells, the greatest activity of complex I (0.11 units/mg) was observed at 24 h after induction, and then it was kept at the same level (Fig. 9).
FIGURE 9.
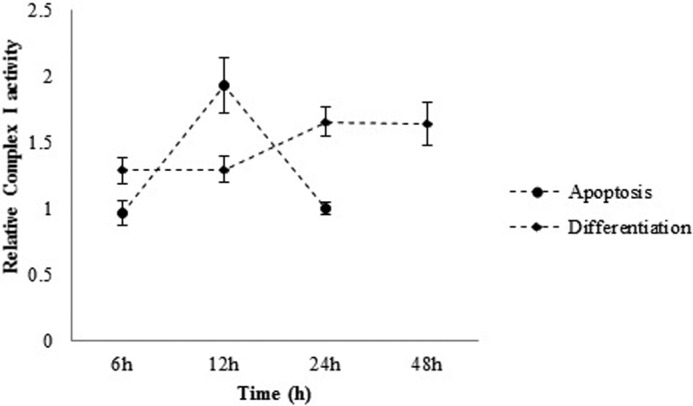
Complex I activity assay. Complex I activity measurement was performed 6, 12, and 24 h and 6, 12, 24, and 48 h after apoptosis and differentiation induction, respectively. 48 h after apoptosis induction, almost all of the cells were dead, and no complex I activity was observed. (The data are expressed relative to control). The data are means ± S.D. (error bars) of triplicate experiments.
DISCUSSION
Molecular aspects involved in the maintenance of mESC pluripotency as well as those modulated upon differentiation commitment are essential for manipulation of these cells for future applications. The identity of and function of molecules whose presence is modulated upon the first steps of embryogenesis remain largely unknown despite current efforts. Pioneering works have indicated that regulation of apoptotic pathways is critically important for correct embryo development starting at the blastocyst stage (28).
To study the links between apoptosis and differentiation, mESC line differentiation into the cardiomyocytes is compared with apoptosis based on the mitochondrial pathway and energetic changes. Here, we present some evidence of a death-centric pathway engagement at the onset of cardiac differentiation, embryoid body formation, a pathway similar to what happens during the mitochondrial pathway of apoptosis with some critical differences. We have identified key events whose regulation is correlated with cell fates (differentiation and apoptosis).
p53 expression is a key player in stem cell differentiation, but its role in mouse embryonic stem cell apoptosis is controversial. As indicated in Fig. 2A, upon apoptosis and differentiation, Western blot for p53 was performed. p53 accumulation in both apoptosis and the non-apoptotic mitochondrial pathway of differentiation were observed, indicating that p53 contributed to mESC apoptosis upon doxorubicin treatment and differentiation, which is implicated in a recent report on the critical role of p53 in differentiation of mESCs (22). However, the possible mechanism of p53 accumulation could have arisen from enhancement of gene expression or stabilization of p53 under intracellular conditions.
In the mESC line involved in apoptosis 6 h after exposure to doxorubicin, apoptotic symptoms, such as increase of p53 expression (Fig. 2A), accumulation of cytosolic cytochrome c (Fig. 2B), apoptosome formation (Fig. 3), and caspase-3/7 activity (Figs. 4 and 5), appeared. In the mESC line involved in differentiation, a similar process was observed with a significant delay time between the events. At 24 h after differentiation induction, p53 expression was increased (Fig. 2A), cytochrome c was released to the cytosol (Fig. 2B), and apoptosome was formed. A minor increase in caspase-9 activity was found 48 h after differentiation induction (Fig. 4).
However, high caspase-3/7 activity did not bring about apoptosis and loss of viability of differentiating cells. Furthermore, this result was also confirmed by flow cytometric analysis of differentiating cells, indicate that despite increased caspase-3/7 activity, cell viability was maintained (Fig. 6). To examine this prospect, annexin V/PI staining of cells at the indicated times was applied. As illustrated in Fig. 6, no significant differences in the early and late apoptotic cell population in differentiation, relative to their related controls, were demonstrated. However, in differentiating cells, at 48 h, the percentage of necrotic cells was nearly 4% more than its control. These differences in cell viability compared with apoptosis could be attributed to different caspase substrate availability within living cells. Moreover, similar studies on differentiation reveal not only that the increase of caspase activity does not originate from apoptosis but that it also is required for differentiation (14, 29, 30). It should be noted that release of cytochrome c upon induction of differentiation in other cells rather than cardiomyocytes might have occurred by a different schedule of appearance. An example of a different time of cytochrome c release has been observed upon differentiation induction in embryonic lens fiber cells (4, 23). Notably, apoptosome formation and caspase-3/7 activity peaks in apoptotic cells were three times greater than what was seen in differentiating cells (Figs. 3 and 5). This implies the existence of a regulatory mechanism that postpones the time and decreases the intensity of caspase-3/7 activity beyond the cytochrome c release and apoptosome formation during differentiation.
The other question is whether PARP-1 cleavage by caspase, which is a hallmark of apoptosis, occurs during differentiation. Immunoblotting of PARP-1 at the indicated times showed that at 48 h after differentiation induction, the cleaved form of PARP-1 is apparent but with a different pattern from that in cells treated with doxorubicin. Its cleavage shows a 74 kDa band, similar to necrotic cells, which may be due to necrosis at 48 h (Fig. 7A) (26). Oct4 and Nanog, as the other substrate candidates for caspase activity, were also examined here. Immunoblotting results showed that Oct4 not only in differentiation but also in apoptosis was uncleaved. Unlike Oct4, the cleaved form of Nanog appeared 48 h after differentiation induction as in the apoptotic sample, similar to the caspase-3/7 activation pattern. This is in contrast to a previous report on the possibility of PARP-1 cleavage by caspase (29). Furthermore, Fujita et al. (29) have also proposed Nanog cleavage by caspase as a way to disrupt the pluripotency of embryonic stem cells and switch to differentiation.
A great deal of evidence has demonstrated that pluripotent stem cells in comparison with differentiated ones have a lower level of ATP, and energetically they depend on the glycolytic metabolic pathway. This observation results from immature mitochondria in pluripotent stem cells. Moreover, it has been shown that there is a high expression level of an uncoupling protein named UCP2, which separates phosphorylation from ATP synthesis in pluripotent stem cells. Indeed, during differentiation, the energetic load of the cells shifts from the glycolytic pathway and is taken into mature mitochondria (31–33). In addition, apoptosis is an ATP-dependent process that provides it through cytosolic ATP (2, 34). According to these observations, one could propose ATP changes as a regulatory mechanism and the necessity for the progression of the mitochondrial pathway of apoptosis. It should be noted that, according to a recent hypothesis, apoptosome formation requires nucleotide exchange. This hypothesis mentions that, in the absence of ATP/dATP exchange, cytochrome c-bound Apaf-1 molecules form inactive aggregates (35). However, this is indirect evidence but implies the importance of ATP changes during apoptosome formation. Thus, in apoptosis and differentiation, a change in cellular ATP level is predictable. Our observation confirms these changes in ATP level during both processes. As illustrated in Fig. 8, in apoptotic cells after 6 h, the ATP level reached its highest point, whereas until the same time, complex I activity was not changed (Fig. 9). At the same time, cytochrome c was detected in cytosol (Fig. 2), apoptosome was formed (Fig. 3), and caspase-9 and caspase-3/7 were active (Figs. 4 and 5). Induction of mESCs apoptosis by doxorubicin leads to fast elevation in ATP content (provided by the glycolytic pathway), release of cytochrome c, and apoptosome formation, thereby rendering downstream mitochondrial pathway of apoptosis. ATP consumption by apoptosome formation and insufficient ATP production due to immature mitochondria of mESCs may disrupt mitochondrial membrane potential as an alternative pathway (34, 36, 37).
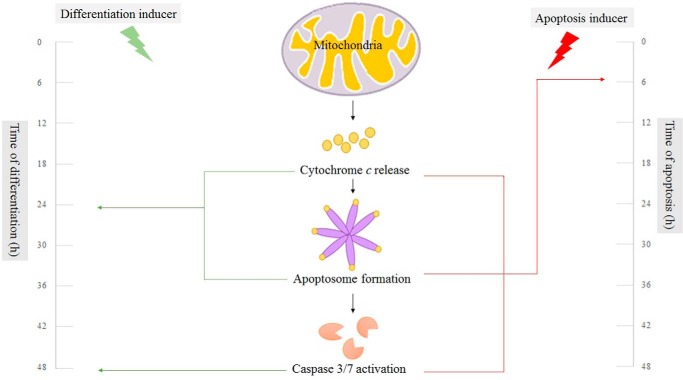
On the other hand, in differentiating mESCs, delayed accumulation of cytosolic cytochrome c (Fig. 2B) and apoptosome formation (Fig. 3) correlated with gradual increase in the cellular ATP level (Fig. 8) and complex I activity (Fig. 9) until significant caspase-3/7 activity was observed (Fig. 5). From these results, it is inferred that, unlike in apoptosis, during differentiation, the mitochondrial pathway indices (e.g. cytochrome c release, apoptosome formation, and caspase activity) change during mitochondria maturation. Therefore, it may be suggested that if it had not been for a lower ATP level with differentiating cells, an earlier rise in apoptotic signal could have been observed. Attenuated caspase-3/7 (as final effectors) activity may occur due to lower oxidative phosphorylation originating from immature mitochondria, as suggested earlier (31–33). In differentiation, elevations of the ATP level, which could be the result of maturing mitochondria, are slower and are accompanied by delayed and less severe mitochondrial pathway progression. Therefore, it may be concluded that, despite activation of the mitochondrial pathway of cell death within differentiating cells due to insufficient ATP level, caspase activation is being delayed, thereby preventing cell death. At this occasion, the cell decides to choose the differentiation pathway instead of apoptosis (Fig. 10). Based on the results of this work, it may be concluded that, unlike apoptosis, a delayed and moderate mitochondrial pathway in differentiation and its association with an energetic supportive mechanism can guarantee cell viability and deliver the cell into differentiation.
FIGURE 10.
Time course of apoptosis versus differentiation. In the presence of an apoptosis inducer, in a short time, fast apoptosome formation appears, whereas in the presence of differentiation inducer, delayed apoptosome formation and delayed caspase activity attenuate apoptosis in mESC differentiation.
Footnotes
- mESC
- mouse embryonic stem cell
- CCLR
- cell culture lysis reagent.
REFERENCES
- 1. Cikala M., Wilm B., Hobmayer E., Böttger A., David C. N. (1999) Identification of caspases and apoptosis in the simple metazoan Hydra. Curr. Biol. 9, 959–962 [DOI] [PubMed] [Google Scholar]
- 2. Eguchi Y., Shimizu S., Tsujimoto Y. (1997) Intracellular ATP levels determine cell death fate by apoptosis or necrosis. Cancer Res. 57, 1835–1840 [PubMed] [Google Scholar]
- 3. Nicholson D. W. (1999) Caspase structure, proteolytic substrates, and function during apoptotic cell death. Cell Death Differ. 6, 1028–1042 [DOI] [PubMed] [Google Scholar]
- 4. Weber G. F., Menko A. S. (2005) The canonical intrinsic mitochondrial death pathway has a non-apoptotic role in signaling lens cell differentiation. J. Biol. Chem. 280, 22135–22145 [DOI] [PubMed] [Google Scholar]
- 5. Sordet O., Rébé C., Plenchette S., Zermati Y., Hermine O., Vainchenker W., Garrido C., Solary E., Dubrez-Daloz L. (2002) Specific involvement of caspases in the differentiation of monocytes into macrophages. Blood 100, 4446–4453 [DOI] [PubMed] [Google Scholar]
- 6. Arama E., Agapite J., Steller H. (2003) Caspase activity and a specific cytochrome c are required for sperm differentiation in Drosophila. Dev. Cell 4, 687–697 [DOI] [PubMed] [Google Scholar]
- 7. Weil M., Raff M. C., Braga V. M. (1999) Caspase activation in the terminal differentiation of human epidermal keratinocytes. Curr. Biol. 9, 361–364 [DOI] [PubMed] [Google Scholar]
- 8. Zermati Y., Garrido C., Amsellem S., Fishelson S., Bouscary D., Valensi F., Varet B., Solary E., Hermine O. (2001) Caspase activation is required for terminal erythroid differentiation. J. Exp. Med. 193, 247–254 [DOI] [PMC free article] [PubMed] [Google Scholar]
- 9. Okuyama R., Nguyen B. C., Talora C., Ogawa E., Tommasi di Vignano A., Lioumi M., Chiorino G., Tagami H., Woo M., Dotto G. P. (2004) High commitment of embryonic keratinocytes to terminal differentiation through a Notch1-caspase 3 regulatory mechanism. Dev. Cell 6, 551–562 [DOI] [PubMed] [Google Scholar]
- 10. Zandy A. J., Lakhani S., Zheng T., Flavell R. A., Bassnett S. (2005) Role of the executioner caspases during lens development. J. Biol. Chem. 280, 30263–30272 [DOI] [PubMed] [Google Scholar]
- 11. Fernando P., Kelly J. F., Balazsi K., Slack R. S., Megeney L. A. (2002) Caspase 3 activity is required for skeletal muscle differentiation. Proc. Natl. Acad. Sci. U.S.A. 99, 11025–11030 [DOI] [PMC free article] [PubMed] [Google Scholar]
- 12. Murray T. V., McMahon J. M., Howley B. A., Stanley A., Ritter T., Mohr A., Zwacka R., Fearnhead H. O. (2008) A non-apoptotic role for caspase-9 in muscle differentiation. J. Cell Sci. 121, 3786–3793 [DOI] [PubMed] [Google Scholar]
- 13. Kim J., Freeman M. R. (2003) JNK/SAPK mediates doxorubicin-induced differentiation and apoptosis in MCF-7 breast cancer cells. Breast Cancer Res. Treat. 79, 321–328 [DOI] [PubMed] [Google Scholar]
- 14. Fernando P., Megeney L. A. (2007) Is caspase-dependent apoptosis only cell differentiation taken to the extreme? FASEB J. 21, 8–17 [DOI] [PubMed] [Google Scholar]
- 15. Torkzadeh-Mahani M., Ataei F., Nikkhah M., Hosseinkhani S. (2012) Design and development of a whole-cell luminescent biosensor for detection of early-stage of apoptosis. Biosens. Bioelectron. 38, 362–368 [DOI] [PubMed] [Google Scholar]
- 16. Hassani S. N., Totonchi M., Farrokhi A., Taei A., Larijani M. R., Gourabi H., Baharvand H. (2012) Simultaneous suppression of TGF-β and ERK signaling contributes to the highly efficient and reproducible generation of mouse embryonic stem cells from previously considered refractory and non-permissive strains. Stem Cell Rev. 8, 472–481 [DOI] [PubMed] [Google Scholar]
- 17. Liu X., Kim C. N., Yang J., Jemmerson R., Wang X. (1996) Induction of apoptotic program in cell-free extracts: requirement for dATP and cytochrome c. Cell 86, 147–157 [DOI] [PubMed] [Google Scholar]
- 18. Nazari M., Hosseinkhani S. (2011) Design of disulfide bridge as an alternative mechanism for color shift in firefly luciferase and development of secreted luciferase. Photochem. Photobiol. Sci. 10, 1203–1215 [DOI] [PubMed] [Google Scholar]
- 19. Mohammadi S., Nikkhah M., Nazari M., Hosseinkhani S. (2011) Design of a coupled bioluminescent assay for a recombinant pyruvate kinase from a thermophilic Geobacillus. Photochem. Photobiol. 87, 1338–1345 [DOI] [PubMed] [Google Scholar]
- 20. Heidari M. M., Houshmand M., Hosseinkhani S., Nafissi S., Khatami M. (2009) Complex I and ATP content deficiency in lymphocytes from Friedreich's ataxia. Can. J. Neurol. Sci. 36, 26–31 [DOI] [PubMed] [Google Scholar]
- 21. Ghiasi P., Hosseinkhani S., Noori A., Nafissi S., Khajeh K. (2012) Mitochondrial complex I deficiency and ATP/ADP ratio in lymphocytes of amyotrophic lateral sclerosis patients. Neurol. Res. 34, 297–303 [DOI] [PubMed] [Google Scholar]
- 22. Lin T., Chao C., Saito S., Mazur S. J., Murphy M. E., Appella E., Xu Y. (2005) p53 induces differentiation of mouse embryonic stem cells by suppressing Nanog expression. Nat. Cell Biol. 7, 165–171 [DOI] [PubMed] [Google Scholar]
- 23. Sanders E. J., Parker E. (2002) The role of mitochondria, cytochrome c and caspase-9 in embryonic lens fibre cell denucleation. J. Anat. 201, 121–135 [DOI] [PMC free article] [PubMed] [Google Scholar]
- 24. Zou H., Li Y., Liu X., Wang X. (1999) An APAF-1·cytochrome c multimeric complex is a functional apoptosome that activates procaspase-9. J. Biol. Chem. 274, 11549–11556 [DOI] [PubMed] [Google Scholar]
- 25. Vermes I., Haanen C., Steffens-Nakken H., Reutelingsperger C. (1995) A novel assay for apoptosis: flow cytometric detection of phosphatidylserine expression on early apoptotic cells using fluorescein labelled Annexin V. J. Immunol. Methods 184, 39–51 [DOI] [PubMed] [Google Scholar]
- 26. Gobeil S., Boucher C. C., Nadeau D., Poirier G. G. (2001) Characterization of the necrotic cleavage of poly(ADP-ribose) polymerase (PARP-1): implication of lysosomal proteases. Cell Death Differ. 8, 588–594 [DOI] [PubMed] [Google Scholar]
- 27. Loh Y. H., Wu Q., Chew J. L., Vega V. B., Zhang W., Chen X., Bourque G., George J., Leong B., Liu J., Wong K. Y., Sung K. W., Lee C. W., Zhao X. D., Chiu K. P., Lipovich L., Kuznetsov V. A., Robson P., Stanton L. W., Wei C. L., Ruan Y., Lim B., Ng H. H. (2006) The Oct4 and Nanog transcription network regulates pluripotency in mouse embryonic stem cells. Nat. Genet. 38, 431–440 [DOI] [PubMed] [Google Scholar]
- 28. Coucouvanis E., Martin G. R. (1995) Signals for death and survival: a two-step mechanism for cavitation in the vertebrate embryo. Cell 83, 279–287 [DOI] [PubMed] [Google Scholar]
- 29. Fujita J., Crane A. M., Souza M. K., Dejosez M., Kyba M., Flavell R. A., Thomson J. A., Zwaka T. P. (2008) Caspase activity mediates the differentiation of embryonic stem cells. Cell Stem Cell 2, 595–601 [DOI] [PMC free article] [PubMed] [Google Scholar]
- 30. De Maria R., Zeuner A., Eramo A., Domenichelli C., Bonci D., Grignani F., Srinivasula S. M., Alnemri E. S., Testa U., Peschle C. (1999) Negative regulation of erythropoiesis by caspase-mediated cleavage of GATA-1. Nature 401, 489–493 [DOI] [PubMed] [Google Scholar]
- 31. Varum S., Rodrigues A. S., Moura M. B., Momcilovic O., Easley C. A., 4th, Ramalho-Santos J., Van Houten B., Schatten G. (2011) Energy metabolism in human pluripotent stem cells and their differentiated counterparts. PloS One 6, e20914. [DOI] [PMC free article] [PubMed] [Google Scholar]
- 32. Zhang J., Khvorostov I., Hong J. S., Oktay Y., Vergnes L., Nuebel E., Wahjudi P. N., Setoguchi K., Wang G., Do A., Jung H. J., McCaffery J. M., Kurland I. J., Reue K., Lee W. N., Koehler C. M., Teitell M. A. (2011) UCP2 regulates energy metabolism and differentiation potential of human pluripotent stem cells. EMBO J. 30, 4860–4873 [DOI] [PMC free article] [PubMed] [Google Scholar]
- 33. Cho Y. M., Kwon S., Pak Y. K., Seol H. W., Choi Y. M., Park do J., Park K. S., Lee H. K. (2006) Dynamic changes in mitochondrial biogenesis and antioxidant enzymes during the spontaneous differentiation of human embryonic stem cells. Biochem. Biophys. Res. Commun. 348, 1472–1478 [DOI] [PubMed] [Google Scholar]
- 34. Zamaraeva M. V., Sabirov R. Z., Maeno E., Ando-Akatsuka Y., Bessonova S. V., Okada Y. (2005) Cells die with increased cytosolic ATP during apoptosis: a bioluminescence study with intracellular luciferase. Cell Death Differ. 12, 1390–1397 [DOI] [PubMed] [Google Scholar]
- 35. Kim H. E., Du F., Fang M., Wang X. (2005) Formation of apoptosome is initiated by cytochrome c-induced dATP hydrolysis and subsequent nucleotide exchange on Apaf-1. Proc. Natl. Acad. Sci. U.S.A. 102, 17545–17550 [DOI] [PMC free article] [PubMed] [Google Scholar]
- 36. Deshmukh M., Kuida K., Johnson E. M., Jr. (2000) Caspase inhibition extends the commitment to neuronal death beyond cytochrome c release to the point of mitochondrial depolarization. J. Cell Biol. 150, 131–143 [DOI] [PMC free article] [PubMed] [Google Scholar]
- 37. Düssmann H., Rehm M., Kögel D., Prehn J. H. (2003) Outer mitochondrial membrane permeabilization during apoptosis triggers caspase-independent mitochondrial and caspase-dependent plasma membrane potential depolarization: a single-cell analysis. J. Cell Sci. 116, 525–536 [DOI] [PubMed] [Google Scholar]


