Abstract
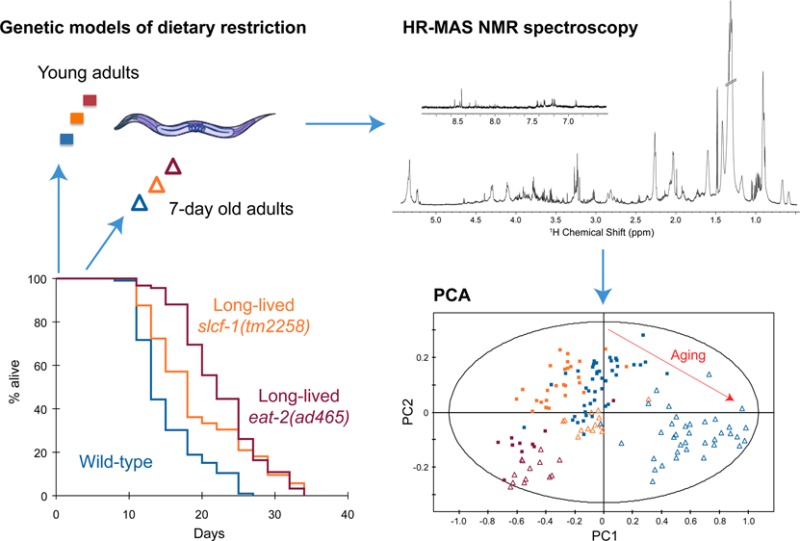
Dietary restriction (DR) is one of the most universal means of extending lifespan. Yet, whether and how DR specifically affects the metabolic changes associated with aging is essentially unknown. Here, we present a comprehensive and unbiased picture of the metabolic variations that take place with age at the whole organism level in Caenorhabditis elegans by using 1H high-resolution magic-angle spinning (HR-MAS) nuclear magnetic resonance (NMR) analysis of intact worms. We investigate metabolic variations potentially important for lifespan regulation by comparing the metabolic fingerprint of two previously described genetic models of DR, the long-lived eat-2(ad465) and slcf-1(tm2258) worms, as single mutants or in combination with a genetic suppressor of their lifespan phenotype. Our analysis shows that significant changes in metabolite profiles precede the major physiological decline that accompanies aging and that DR protects from some of those metabolic changes. More specifically, low phosphocholine (PCho) correlates with high life expectancy. A mutation in the tumor suppressor gene PTEN/DAF-18, which suppresses the beneficial effects of DR in both C. elegans and mammals, increases both PCho level and choline kinase expression. Furthermore, we show that choline kinase function in the intestine can regulate lifespan. This study highlights the relevance of NMR metabolomic approaches for identifying potential biomarkers of aging.
Keywords: metabolomics, metabonomics, Caenorhabditis elegans, NMR, aging, dietary restriction, PTEN, HR-MAS
Introduction
It has been known for decades that dietary restriction (DR) promotes longevity significantly and delays aging in many species.1 Yet, how interventions such as DR specifically affect the metabolic changes associated with aging has not been extensively studied. In mammals, this approach is restricted to the description of metabolite concentrations in biofluids or specific tissues, which provides complementary but partial information on the homeostatic network of the whole body. Previous studies have investigated the metabolite profile of animals under DR in mice, rats, dogs, and rhesus monkeys. Although these previous studies identified discriminating metabolites between DR- and ad libitum-fed animals, a consensus of the results can hardly be established. Several factors might account for these variations, including the type of biofluid analyzed, either urine2,3 or plasma,4−6 and the ad libitum and DR regimens that vary from one study to another. Moreover, these analyses were dedicated mainly to the comparison of young animals to very old ones that represent a heterogeneous population.
In this work, we use the nematode Caenorhabditis elegans as a model system to investigate the metabolic changes associated with DR. C. elegans plays an instrumental role in deciphering mechanisms involved in aging. Previous genetic screens identified mutants that mimic dietary restriction, and mutations in genes that encode evolutionary conserved effectors of DR suppress their long-lived phenotype.7,8 Those mutants thus provide an ideal biological system to further assess metabolic variations more specifically linked to the beneficial effect of DR on lifespan. Here, we assess metabolic phenotypes of whole C. elegans animals by high-resolution magic angle spinning (HRMAS) nuclear magnetic resonance (NMR) spectroscopy.9,10 The influence of DR on the metabolic profiles associated with aging is analyzed using multivariate statistics. Quantification of individual metabolites for wild-type, long-lived, and short-lived mutants provides detailed insight into the metabolic perturbations associated with DR in C. elegans to highlight biomarkers of aging across genotypes.
Experimental Section
Nematode Strains, Culture Conditions, and Lifespan Assay
C. elegans strains were cultured at 20 °C on nematode growth media (NGM)11 agar plates freshly poured and seeded with Escherichia coli strain OP50 culture. The OLB11 strain, which allows intestine-specific inactivation of genes by RNAi, was kindly provided by Olaf Bossinger.12 Wild-type Bristol N2, eat-2(ad465) II, and daf-18(e1375) IV strains were provided by the Caenorhabditis Genetics Center (University of Minnesota). Strain slcf-1(tm2258) and ckb-2(ok1922) mutants were obtained from the C. elegans knockout consortium and outcrossed five times in our wild-type strain. Promoter::gfp reporter strains BC14636 (B0285.9) were obtained from the British Columbia C. elegans Gene Expression Consortium.13
The ckb-2 clone (B0285.9) was purchased from GeneService Ltd. Bacterial feeding RNAi experiments and lifespan assays were carried out essentially as described previously.8 Survival analyses were performed using the Kaplan–Meier method, and the significance of differences between survival curves was calculated using the log rank test. The statistical software used was XLSTAT 2007 and all P-values <0.05 were considered significant.
Sample Preparation for Metabolomics Analysis
To reduce variation relative to sample preparation or analysis, the assays were performed on a large number of worms (40 000 worms of each age in total, split into 1000 worms per analyzed NMR sample) prepared in at least three independent experiments. For worm amplification and synchronization, 10 adult worms were allowed to lay eggs, on E. coli OP50-seeded 55 mm NGM plates, for 2–3 h at 20 °C then removed. When F1 worms reached the preadult-L4 stage, 5-fluorouracil (5-FU, Sigma) was added on top of the plate at a final concentration of 1.30 mg·L–1 (10 μM) so that the eggs laid by the F1 worms do not develop. This protocol allowed the maintenance of a synchronized F1 population until old age, while avoiding transferring worms every couple of days to separate them from their progeny. Synchronized worms were recovered 24 h later (YA stage, i.e., worms with a vulva, characteristic of the adult stage, but without eggs in the gonad) or 7 days later (A7). Worm culture synchronization and recovery were set up to recover both young adult and 7-day-old worms on the same day for all genotypes, and repeated at least three times. On the day of recovery, 50 plates for each condition (age/genotype) were washed 5 times in 50 mL of M9 buffer, separated by 5 min sedimentation steps to get rid of residual bacteria. Worms were then fixed for 45 min in 1% paraformaldehyde and then washed five times in distilled water, followed by five washes in deuterium oxide. Disposable Kel-f inserts (30 mL) with sealing caps for 4 mm NMR rotors were filled with around 1000 whole worms and stored at −80 °C until NMR analysis. Samples were thawed at room temperature 15 min before the NMR experiments.
Whole C. elegans HR-MAS NMR Spectroscopy
C. elegans HR-MAS NMR spectroscopy was performed as previously described by Blaise et al.9,10 Spectra were reduced over the chemical range of 0.55–8.75 ppm to 8200 bins (10–3 ppm wide) with integration of signal intensity. The residual water signal (δ = 4.5–5 ppm), residual methanol signal resulting from the formaldehyde fixation step (δ = 3.32–3.39 ppm), and a noise area (δ = 5.5–6.5 ppm) were discarded prior to analysis. Spectra were normalized using the probabilistic quotient normalization approach14 with a median of all spectra as a reference spectrum. We applied Pareto scaling on the data set for multivariate analysis only.
Metabolite assignment was completed exploiting reference data from the literature,9,25 the HMDB,15 MMCD,16 bbiorefcode-2-0-0 (Bruker, GmbH, Rheinstetten, Germany), and Chenomx NMR Suite 7.0 (Chenomx Inc., Edmonton, Canada) spectral databases.
NMR Data Analysis
Principal component analysis (PCA),17 was first conducted in SIMCA P12+ (Umetrics, Umea, Sweden) and was used to derive the main sources of variance within the data set, assess sample homogeneity, and exclude biological or technical outliers. Orthogonal projection to latent structure discriminant analysis (OPLS-DA) was then performed in MATLAB (The MathWorks Inc., Natick, MA) to derive pairwise comparison between the different conditions (strains and ages).18
Metabolites involved in class discrimination were then derived from an univariate approach based on the statistical recoupling of variables (SRV) analysis recently described.19 SRV corresponds to an automatic binning scheme based on the relationship of covariance and correlation between consecutive variables, which is followed by a univariate unpaired two-tailed t test calculated for each variable under the Benjamini–Yekutieli correction to cope with multiple testing issues.20
Statistically significant metabolites found in the previous analysis were finally quantified either by direct signal integration, in the case of nonoverlapping signals, or by computer assisted manual fitting (deconvolution) of overlapping NMR peaks using the Chenomx NMR Suite 7.0 (Chenomx Inc., Edmonton, Canada). Results were plotted as means and 95% confidence intervals and p values were calculated for each pairwise comparison from univariate unpaired two-tailed t tests.
Quantitative Real-Time PCR
Young adult and 7-day-old wild-type daf-18(e1375), slcf-1(tm2258), daf-18(e1375), and slcf-1(tm2258) mutant worms were synchronized in the same conditions as sample preparation for metabolomic analysis. Biological replicates obtained from five independent experiments were flash-frozen in liquid N2, and RNA was extracted using the standard Trizol method, followed by phenol–chloroform purification. Total RNA was quantified using DO 260 nm on a NanoDrop 1000 spectrophotometer (ThermoScientific, Baltimore, MA, USA), and quality was assessed with the Agilent 2100 Bioanalyzer (Agilent Technologies, Palo Alto, CA, USA). RNA (800 ng) was spiked with an external control (Poly-A spike control from Bacillus subtilis, Affymetrix) and reverse-transcribed using the iScript Reverse Transcription Supermix (Bio-Rad, Hercules, CA, USA). Conventional house-keeping genes, including tba-1, rpl-22, and rpl-26, proved to be stable between assays and were used for normalization as well as the external bacterial control and gave similar results. Quantitative real-time PCR (qRT-PCR) was performed with the Fast SYBR Green Master Mix and the Applied Biosystems 7900HT Fast Real-Time PCR system (Appied Biosystems, Foster City, CA, USA). The experimental protocol consisted of an initial polymerase activation at 95 °C for 20 s, followed by an amplification program for 40 cycles while maintaining the annealing and primer extension temperature at 60 °C for 20 min. Melting-curve analysis was then performed to verify the amplification of a single product. All primers were designed using NCBI Primer-BLAST and selected to generate amplicons with a length of 100–200 bp. Standard curves were generated for each primer set to calculate the efficiency of each set. Only primer sets with an efficiency of 1.9–2.1 were used for qPCR. The relative mRNA levels for each assay were computed from the Ct values obtained for the target gene. qPCR experiments were repeated at least three times using independent RNA/cDNA preparations. Data were pooled and analyzed using RQ manager v1.2 and dataAssist v1.0 (Applied Biosystems)
Results and Discussion
Metabolic Changes Correlate with Both Chronological and Physiological Age in C. elegans
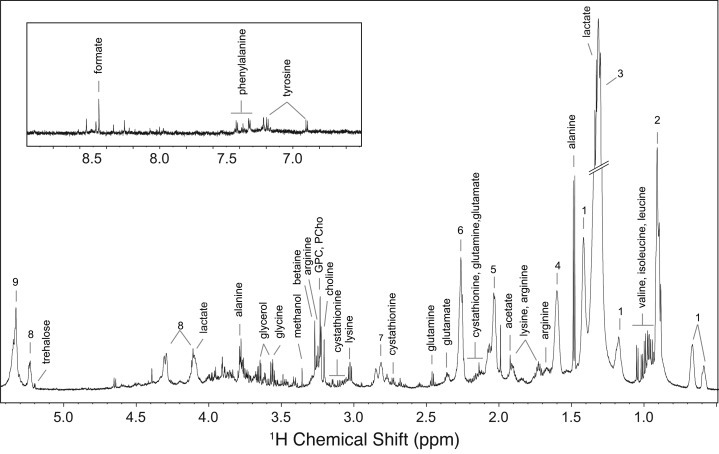
Wild-type (WT) worms raised at 20 °C have a median and maximal lifespan of 17 and 30 days, respectively, on average.8 Under these experimental conditions, obvious morphological changes and functional decline appeared after a week and progressively increased until death.21 To investigate the metabolic variations that occur during early adulthood, we analyzed the metabolome of worms staged at two different adult ages: as young adults (YA) before egg production starts, and at day 7 of adulthood (A7), just after egg production ceases. These ages were used to target a time window preceding the onset of strong morphological alterations while minimizing the impact of egg production on the metabolome. Acquisition of 1H NMR metabolic profiles (Figure 1) was performed on a pool of intact fixed animals following HRMAS protocol described earlier.10
Figure 1.
Typical 700 MHz 1H HR-MAS NOESY NMR spectrum of whole slcf-1(tm2258)C. elegans worms for aliphatic (δ = 0.5–5.3 ppm) and aromatic (δ = 6.5–9 ppm, magnified 5 times) regions. The resolution of a 1H HR-MAS NMR spectrum is typically 1.3 Hz (measured as the width at half height for one of the alanine doublet peaks). Spectra were recorded with a signal-to-noise ratio of 300. Keys: 1, cyclic fatty acids; 2, lipids (CH3); 3, lipids ((CH2)n); 4, lipids (CH2CH2CO); 5, unsaturated lipids (CH2CH=CH); 6, lipids (CH2CO); 7, unsaturated lipids (CH=CHCH2CH=CH); 8, glyceryl of lipids; 9, unsaturated lipids (CH=CH); PCho, phosphocholine; GPC, glycerophosphocholine.
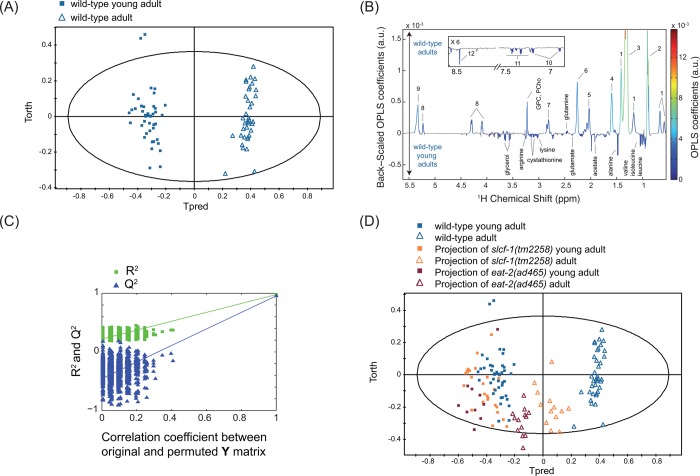
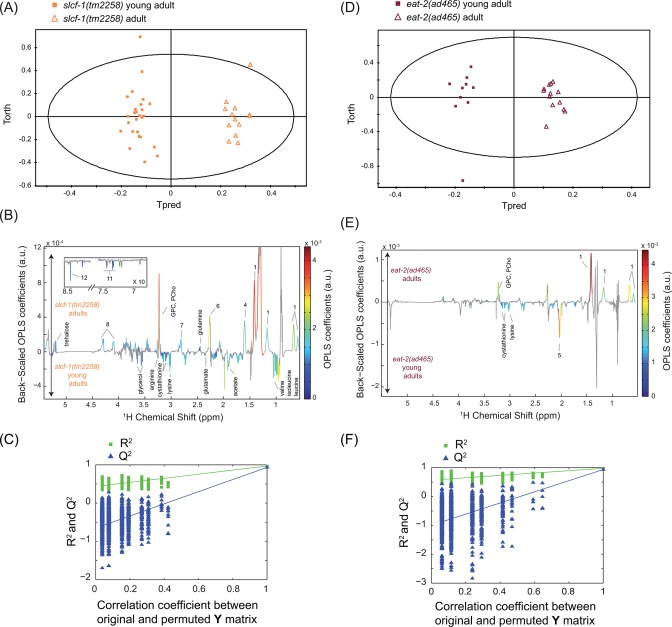
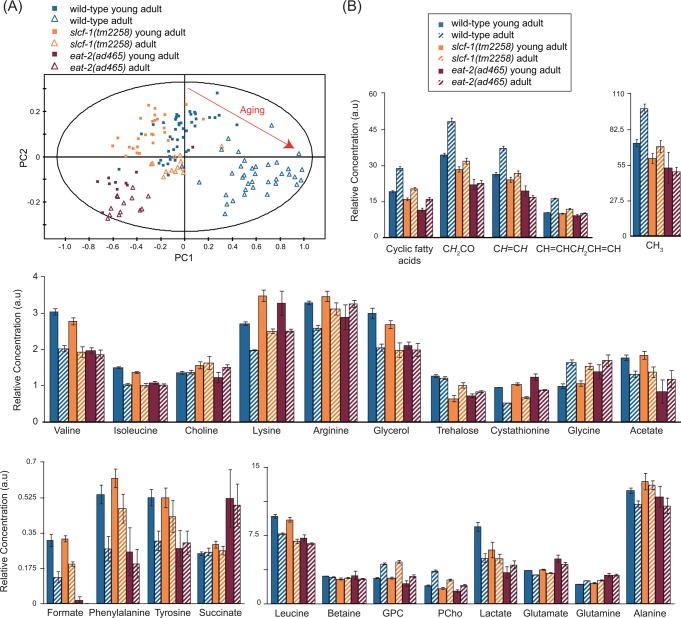
Data were analyzed by using two multivariate statistical approaches: unsupervised (PCA17) or supervised (orthogonal partial least-squares (OPLS)18) models; the latter extracts a group-specific robust metabolic phenotype by exploiting the genotype and age class membership within a regression model. These analyses show that WT YA and A7 worms can clearly be distinguished by their metabolic fingerprints (Figures 2A–C and 3, Supporting Information (SI) Table S1). YA and A7 worms were essentially isogenic and maintained in a steady environment, and any bias linked to individual phenotype is precluded by our sampling conditions. These data therefore show that metabolic profiles correlate with the chronological age of adult worms and may constitute a fingerprint characteristic of physiological aging. In this case, one would expect that the metabolic profile of worms with extended longevity should harbor a “young fingerprint “, that is, similar to WT YA, at a more advanced age. To test this hypothesis, we analyzed the metabolome of worms carrying a mutation in the slcf-1 gene, which has been shown to increase the average lifespan of animals by 30% compared with WT animals.8 Similar to WT animals, YA and A7 slcf-1(tm2258) mutants can still be separated according to their metabolic profiles from supervised analysis (Figure 4A–C). Furthermore, WT and long-lived worms can also be discriminated at the same chronological age (YA or A7) (SI Table S2). Indeed, PCA revealed that the metabolic fingerprint of A7 slcf-1 mutants is closer to the profiles of young adults, either slcf-1(tm2258) or WT, than to the A7 WT fingerprint (Figure 5A).
Figure 2.
Metabolic signature of aging in wild-type C. elegans worms. OPLS model discriminating wild-type young adults and wild-type adults (1 predictive component and 3 orthogonal components; R2X = 0.846, R2Y = 0.978, Q2 = 0.956) from Pareto-scaled data set: (A) score plot; (B) loadings plot resulting from the SRV analysis, showing back-scaled OPLS coefficients values, colored from the original OPLS coefficients if variables were found statistically significant after a multiple testing univariate procedure (Benjaminin-Yekutieli correction); and (C) model validation resulting from 1000 permutations, demonstrating the model robustness, because model R2 and Q2 values were significantly higher than random model ones. (D) Score plot of the projections of slcf-1(tm2258) and eat-2(ad465) adults and young adults in the OPLS model (A), discriminating wild-type adults, and young adults. Key: 1, cyclic fatty acids; 2, lipids (CH3); 3, lipids ((CH2)n); 4, lipids (CH2CH2CO); 5, unsaturated lipids (CH2CH=CH); 6, lipids (CH2CO); 7, unsaturated lipids (CH=CHCH2CH=CH); 8, glyceryl of lipids; 9, unsaturated lipids (CH=CH); 10, tyrosine; 11, phenylalanine; 12, formate; PCho, phosphocholine; GPC, glycerophosphocholine.
Figure 3.
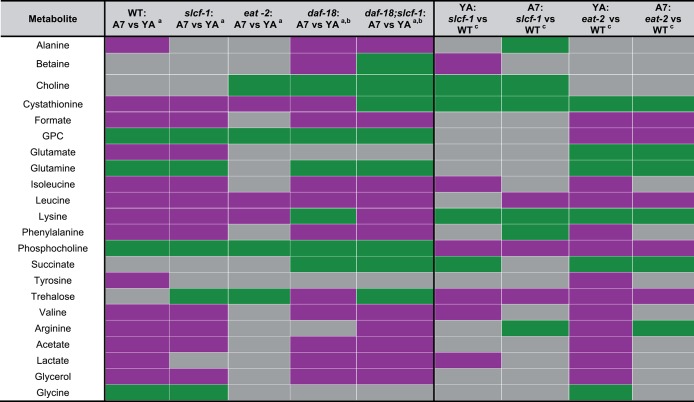
Metabolite variations with age in WT, slcf-1(tm2258), eat-2(ad465), daf-18(e1375) mutants, and daf-18(e1375);slcf-1(tm2258) double mutants and between WT and long-lived mutants slcf-1(tm2258) or eat-2(ad465) in young adults and 7-day-old adults. a = Increase (green) or decrease (purple) in metabolite concentrations with age. b = Acetate, lactate, glycerol, and glycine variations are not reliable due to signal overlaps. c = Increase (green) and decrease (purple) in metabolite concentrations in long-lived mutant (slcf-1 or eat-2) by comparison to WT. Nonsignificant metabolite variations are left in gray; YA, young adult; A7, adult.
Figure 4.
Metabolic signatures of aging in slcf-1(tm2258) and eat-2(ad465)C. elegans worms. OPLS model discriminating slcf-1(tm2258) young adults and slcf-1(tm2258) adults (1 predictive component and 3 orthogonal components; R2X = 0.794, R2Y = 0.97, Q2 = 0.934) from Pareto-scaled data set: (A) scores plot; (B) loadings plot resulting from the SRV analysis; and (C) model validation resulting from 1000 permutations, demonstrating the model robustness, because model R2 and Q2 values were significantly higher than random model ones. OPLS model discriminating eat-2(ad465) young adults and eat-2(ad465) adults (1 predictive component and 2 orthogonal components; R2X = 0.728, R2Y = 0.978, Q2 = 0.934) from Pareto-scaled data set: (D) scores plot; (E) corresponding loadings plot resulting from the SRV analysis; and (F) model validation resulting from 1000 permutations, demonstrating the model robustness. Key: 1, cyclic fatty acids; 4, lipids (CH2CH2CO); 5, unsaturated lipids (CH2CH=CH); 6, lipids (CH2CO); 7, unsaturated lipids (CH=CHCH2CH=CH); 8, glyceryl of lipids; 11, phenylalanine; 12, formate; PCho, phosphocholine; GPC, glycerophosphocholine.
Figure 5.
Metabolic variations in WT, slcf-1(tm2258) and eat-2(ad465) worms during aging. (A) PCA including young adults and adults WT, slcf-1(tm2258), and eat-2(ad465). PC1 and PC2 stand for the first and second principal components, respectively. (B) Relative concentrations in arbitrary units of 22 metabolites and lipid signals corresponding to specific chemical functions. Results are reported with means and 95% confidence intervals.
Dietary Restriction Prevents Metabolic Changes Associated with Aging
Several DR protocols have been tested in C. elegans, such as bacterial dilution on solid or liquid medium, food deprivation, eat-2 mutants, etc. However, the extension of lifespan requires the activation of specific effectors that only partially overlaps between DR regimen.22,23
The slcf-1 gene encodes a putative monocarboxylate transporter expressed in the intestine of the worm, and we have recently shown that the slcf-1(tm2258) mutation increased longevity by mechanisms similar to DR.8 We thus asked whether the difference in the metabolic shift observed with age between WT and slcf-1(tm2258) mutants was specific for slcf-1(tm2258) mutants or may be a paradigm for metabolic changes that take place in response to DR. To this end, we aimed to validate these results by using eat-2(ad465) mutants as a second genetic model of DR, which also exhibit an increased longevity.7 The eat-2 gene encodes a subunit of nicotinic acetylcholine receptors that regulates pharyngeal pumping. The dramatically reduced frequency of these receptors in eat-2(ad465) mutants induces a strong reduction in food intake. PCA showed a distinct cluster for eat-2(ad465) mutants and a discrimination between eat-2(ad465) YA and A7 (Figure 5A) confirmed by supervised analysis (Figure 4D–F, SI Table S2). PCA also revealed a common axis for discrimination between YA and A7 in the three strains, but with less amplitude for the two long-lived mutants. To further evaluate how long-lived mutants behave along the metabolic coordinates of WT, we projected slcf-1(tm2258) and eat-2(ad465) individuals onto an OPLS model discriminating YA and A7 WT worms (Figure 2D). YA, for both slcf-1(tm2258) and eat-2(ad465) mutants, cluster with the WT YA worms, whereas long-lived A7 adults of these long-lived mutants are projected at an intermediate position on the physiological aging axis, between YA and A7 WT worms. Overall, these results show that there are fewer differences between old and young long-lived worms for metabolic variations associated with physiological aging than between young and old WT worms and suggest that the metabolic reprogramming triggered by DR specifically prevents the age-associated metabolic variations.
To further investigate this hypothesis, we sought to define metabolites that discriminate the A7 from YA wild-type worm populations. We identified a set of metabolites for which concentrations increase with age: saturated and unsaturated lipids, glycerophosphocholine (GPC), phosphocholine (PCho), glutamine, and glycine. Another 14 metabolites for which a decrease in concentration was observed includes a range of amino acids (alanine, arginine, isoleucine, leucine, lysine, phenylalanine, tyrosine, valine), formate and cystathionine, both of which are linked to folate metabolism, as well as tricarboxylic acid cycle (TCA) metabolites (glutamate, acetate, and lactate) and glycerol (Figures 3 and 5B, SI Table S1). When considering specifically the metabolites that show age-dependent significant variation in their levels for WT worms, we observed lower basal levels of lipids and PCho in slcf-1(tm2258) mutants at the YA stage and only a moderate increase with age (Figures 4B, 5B, SI Tables S1 and S3). An attenuated decrease in the concentration of alanine, arginine, phenylalanine, tyrosine, cystathionine, and formate was also observed for slcf-1(tm2258) aging animals, as compared with WT (Figure 4B). Furthermore, a set of common metabolic features clearly discriminated both eat-2(ad465) and slcf-1(tm2258) animals from the WT worms. These differences include lower levels of lipids, leucine, PCho, trehalose, and higher levels of lysine, arginine, and cystathionine (Figure 5B, SI Table S3). These metabolites may therefore constitute a common signature of the long-life phenotype for C. elegans DR mutants.
Previous studies2−6 do not allow one to draw a list of common metabolic variations associated with DR in aged animals, most probably as a result of different experimental conditions regarding both sample preparation (nature of biofluid, age, DR and ad libitum regimen) and analysis (extraction condition, NMR or MS analysis). Yet, one common observation is that DR counteracts the increase in lipids associated with age that we also observed in our study.
High Phosphocholine Content Is Predictive of a Short Lifespan Expectancy
These observations show that DR is associated with a metabolic reprogramming associated with the attenuation of the metabolic variations linked to physiological aging observed in worms fed ad libitum and that this effect could participate in the beneficial effect of DR on lifespan. A mutation that suppresses the extended lifespan phenotype of DR worms should thus affect the same metabolite levels in an opposite manner. To test this hypothesis, we used worms carrying the daf-18(e1375) mutation, which shortens the average lifespan by 30% compared with WT, while it completely suppresses the extended longevity of slcf-1(tm2258) worms, as daf-18(e1375);slcf-1(tm2258) double mutants exhibit a lifespan reduced by 60% compared to slcf-1(tm2258) single mutants.8,24
We analyzed the metabolome of short-lived daf-18(e1375) and daf-18(e1375); slcf-1(tm2258) mutants and identified leucine, PCho and arginine as metabolites, the levels of which vary in the opposite direction in double daf-18(e1375); and slcf-1(tm2258) mutants compared with slcf-1(tm2258) and eat-2(ad465) single mutants (SI Table S4). Among these metabolites, we then defined leucine and PCho as metabolites of which levels vary in the same direction as in short-lived daf-18(e1375) single mutants when compared with WT. Leucine levels decrease with age and are significantly lower in slcf-1 and eat-2 mutants as compared with WT, and the levels are higher in daf-18(e1375) single mutants. However, leucine levels in daf-18(e1375);slcf-1(tm2258) double mutants remain similar to the level of WT animals at day 7 of adulthood (SI Figure S1) and, thus, do not correlate with life expectancy because daf-18(e1375);slcf-1(tm2258) animals are short-lived compared with WT.8
On the other hand, PCho levels, which are lower in both A7 eat-2(ad465) and slcf-1(tm2258) mutants compared with WT (Figure 5B), are dramatically increased in daf-18(e1375) single mutants and daf-18(e1375);slcf-1(tm2258) double mutants (Figure 6A, SI Table S4 and S5).
Figure 6.
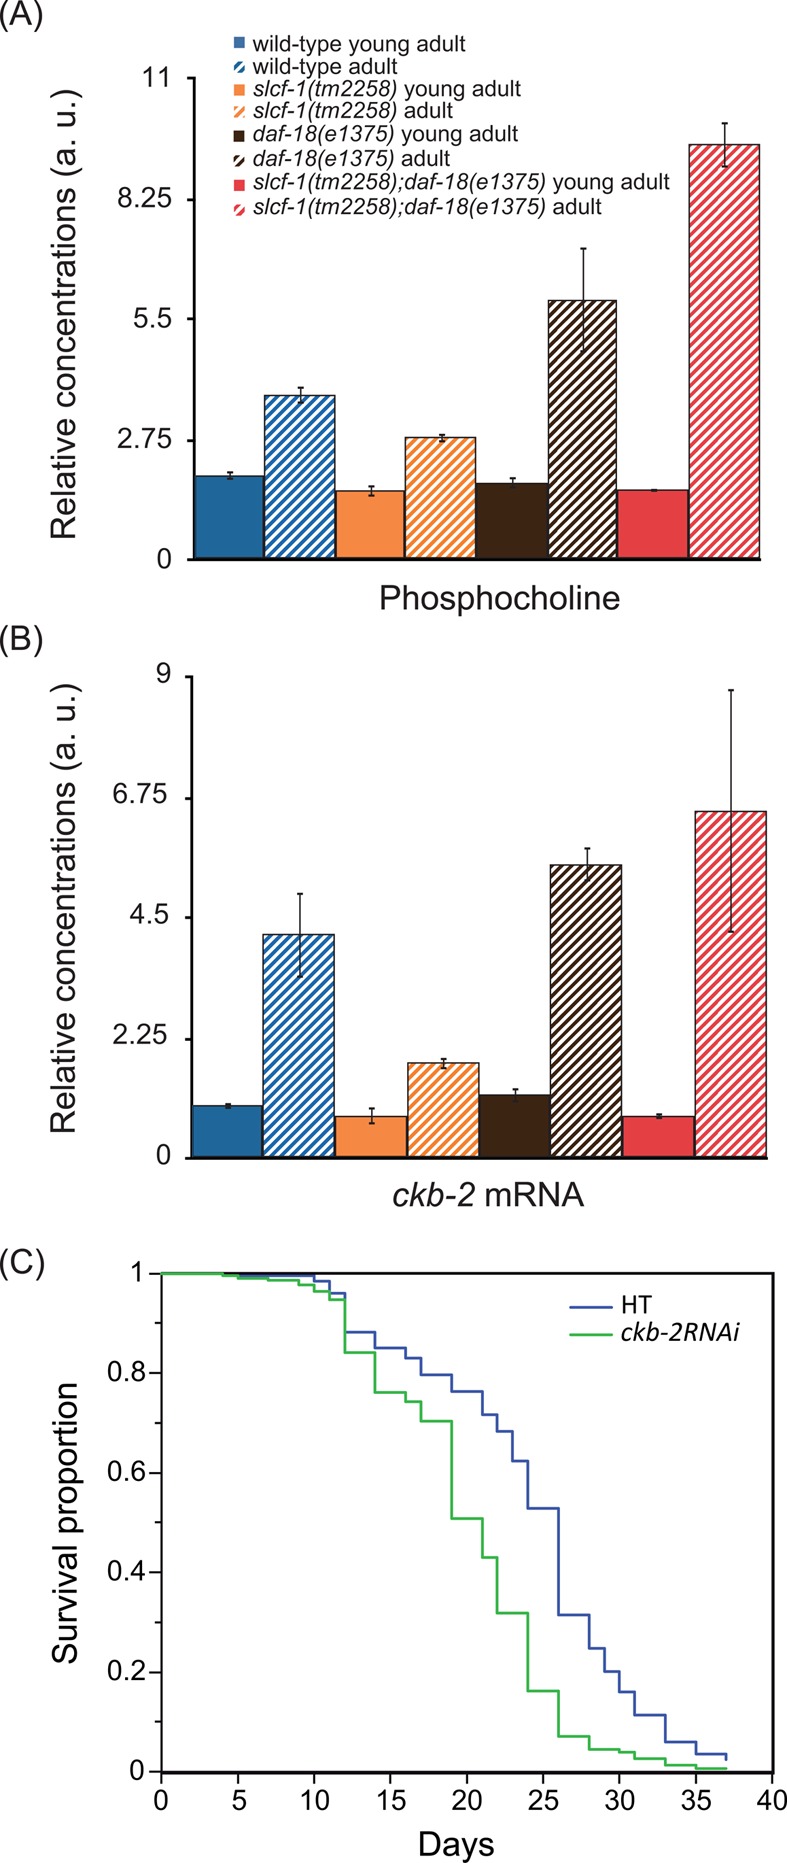
Activation of the phosphocholine pathway with aging. (A) Relative concentrations in arbitrary units of phosphocholine in young and 7-day-old adult WT, slcf-1(tm2258), daf-18(e1375), and daf-18(e1375);slcf-1(tm2258) double mutants. Results are reported with means and 95% confidence intervals. (B) Relative concentrations in arbitrary units of ckb-2 mRNA in young and 7-day-old adults WT, slcf-1(tm2258), daf-18(e1375) and daf-18(e1375);slcf-1(tm2258) double mutants. Results are reported with means and standard deviations. See SI Table S2 for detailed data and statistical tests for comparison. (C) Survival curves of OLB11 worms fed control (HT) or ckb-2RNAi bacterial clones. OLB11 strain allows RNAi inactivation of genes in the intestine only. Data from three independent experiments have been pooled. The corresponding lifespans were 23.3 ± 0.2 (n = 208) and 19.9 ± 0.4 (n = 228), respectively, for wild-type and ckb-2RNAi-treated worms. Comparison with log rank test: p < 10–3.
To further investigate whether the PCho level may be a valid lifespan predictor, we calculated the Pearson correlation coefficients between those two parameters (SI Table S6). We obtained correlation values of −0.56 (p = 0.296) for YA and −0.83 (p = 0.077) for A7 worms. Correlation coefficients were also calculated considering lifespan as a qualitative variable (1 for short-lived daf-18(e1375) and daf-18(e1375);slcf-1(tm2258) mutants, 2 for WT, and 3 for long-lived slcf-1(tm2258) and eat-2(ad465) mutants). We obtained correlation values of −0.45 (p = 0.44) for YA and −0.88 (p = 0.046) for A7 worms. Overall, these results showed an association between lifespan and PCho level that increased with age. This association was statistically significant at A7 when considering lifespan as a qualitative variable. The PCho level measured for 7-day-old adults was thus a valuable predictor for longevity.
It is noteworthy that this observation is not restricted to long-lived DR worms. It was recently reported that long-lived insulin/IGF-1/daf-2 mutants also harbor lower levels of PCho (among other metabolic changes) compared with WT25,26 and that this level is increased in short-lived FOXO/daf-16 single or daf-16;daf-2 double mutants.25
Ckb-2 Choline Kinase Expression Correlates with Physiological Age and Its Inhibition Decreases Lifespan
PCho is produced by the phosporylation of choline by choline kinase. To test the hypothesis that variations in PCho levels may reflect the activation of choline kinase expression, we quantified choline kinase transcripts in WT and lifespan mutants at different ages. The C. elegans genome encodes 4 choline kinases called CKB-1, -2, -3, and -4.27 Although the levels of expression of ckb-1, -3, and -4 do not vary significantly (Table 1), ckb-2 transcript levels correlate with PCho content in worms for all genotypes and ages (Figure 6B). Moreover, living animals expressing the green fluorescent protein under the control of the ckb-2 endogenous promoter13 showed similar age- and genotype-dependent variations in intestinal GFP expression (data not shown). These data are consistent with the abundance of PCho being correlated with the activation of the choline pathway with age.
Table 1. Relative Concentrations in Arbitrary Units of ckb-1, ckb-2, ckb-4 mRNA in young and 7-day-old adults WT, slcf-1(tm2258), daf-18(e1375), and daf-18(e1375);slcf-1(tm2258) double mutantsa.
| genotype/age | av level of mRNA ± SEM | no. replicates | Mann–Whitney test P values against specific groups |
|---|---|---|---|
| ckb-1 | |||
| WT/YA | 0.99 ± 0.02 | 6 | |
| WT/A7 | 0.8 ± 0.08 | 6 | 0.092/WT YA |
| slcf-1/YA | 0.95 ± 0.08 | 6 | 0.575/WT YA |
| slcf-1/A7 | 0.87 ± 0.09 | 6 | 0.575/slcf-1 YA |
| 0.810/WT A7 | |||
| daf-18/YA | 0.97 ± 0.06 | 6 | 0.936/WT YA |
| daf-18/A7 | 1.14 ± 0.09 | 6 | 0.230/daf-18 YA |
| 0.031/WT A7 | |||
| daf-18;slcf-1/YA | 0.93 ± 0.05 | 6 | 0.470/WT YA |
| 1.000/slcf-1 YA | |||
| 0.936/daf-18 YA | |||
| daf-18;slcf-1/A7 | 1.03 ± 0.11 | 6 | 0.093/WT A7 |
| 0.575/slcf-1 A7 | |||
| 0.378/daf-18 A7 | |||
| ckb-2 | |||
| WT/YA | 0.97 ± 0.02 | 9 | |
| WT/A7 | 2.88 ± 0.32 | 9 | <10–3/WT YA |
| slcf-1 /YA | 0.70 ± 0.04 | 9 | 10–3/WT YA |
| slcf-1/A7 | 1.64 ± 0.17 | 9 | <10–3/slcf-1 YA |
| 0.002/WT A7 | |||
| daf-18/YA | 1.03 ± 0.07 | 6 | 0.593/WT YA |
| daf-18 /A7 | 4.70 ± 0.25 | 6 | 0.005/daf-18 YA |
| 0.008/WT A7 | |||
| daf-18;slcf-1/YA | 0.83 ± 0.07 | 9 | 0.013/WT YA |
| 0.143/slcf-1 YA | |||
| 0.045/daf-18 YA | |||
| daf-18;slcf-1/A7 | 5.78 ± 0.64 | 9 | 0.020/WT A7 |
| <10–3/slcf-1 A7 | |||
| 0.376/daf-18 A7 | |||
| ckb-4 | |||
| WT/YA | 0.96 ± 0.06 | 6 | |
| WT/A7 | 0.8 ± 0.04 | 6 | 0.030/WT YA |
| slcf-1/YA | 1.04 ± 0.08 | 6 | 0.065/WT YA |
| slcf-1/A7 | 0.74 ± 0.05 | 6 | 0.013/slcf-1 YA |
| 0.298/WT A7 | |||
| daf-18/YA | 0.81 ± 0.04 | 6 | 0.065/WT YA |
| daf-18 /A7 | 0.86 ± 0.11 | 6 | 1.000/daf-18 YA |
| 0.936/WT A7 | |||
| daf-18;slcf-1/YA | 1.12 ± 0.13 | 6 | 0.470/WT YA |
| 1.000/slcf-1 YA | |||
| 0.020/daf-18 YA | |||
| daf-18;slcf-1/A7 | 0.094 ± 0.1 | 6 | 0.471/WT A7 |
| 0.128/slcf-1 A7 | |||
| 0.689/daf-18 A7 | |||
The C. elegans genome encodes four choline kinase “B” isoforms named ckb-1, -2, -3, and -4 for which expression data are reported in the table, except for ckb-3, which was expressed at undetectable levels.
We next addressed the functional significance of these variations. Choline kinase expression can also be activated during conditions of endoplasmic reticulum (ER) stress in both worms and mammalian cells,28−30 and modulation of ER stress response in the intestine was recently shown to regulate aging.31 The increased ckb-2 expression in older animals may point to a role for CKB-2 in adaptation to stress that accumulates with age and predicts that its inactivation would shorten lifespan. Results presented in Figure 6C are consistent with this hypothesis. Although inactivation of ckb-2 at the whole organism level by RNAi or mutation did not affect lifespan, its inactivation exclusively in the intestine did significantly shorten C. elegans lifespan. This also suggests that whole body inactivation of ckb-2 triggers compensation mechanisms that are not set up when ckb-2 is inactivated in the intestine only.
Our results support the hypothesis that the phosphocholine level constitutes a signature of ER stress with age and that low phosphocholine content reflects higher resistance to ER stress, as we observed for long-lived slcf-1 mutants (data not shown).
Conclusion
Overall, our data show that metabolic variations take place as an early step during adulthood, before strong physiological decline arises. Some of the metabolic variation is counteracted by mutations that extend lifespan by mimicking DR, supporting the hypothesis that DR increases lifespan, at least in part, by buffering some metabolic variations associated with age. Comparisons of the metabolic profiles obtained from WT, long-lived, and short-lived mutants allowed us to identify PCho as a potential marker of aging in C. elegans.
Future efforts should concentrate on new technological approaches to scale down the number of worms required and thus address the question of metabolic modifications associated with different ages and genetic backgrounds in a more systematic manner. Still interestingly, several recent studies have reported the modification with age of choline metabolites in different species, including humans.4,5,32−34 In support of those observations, our work reinforces the value of metabolomic approaches to identify new potential biomarkers of aging by further demonstrating a functional link between phosphocholine levels, choline kinase expression, and longevity.
Acknowledgments
We thank S. Mitani and O. Bossinger for slcf-1(tm2258) and OLB11 strains, respectively, and the C. elegans Genetics Center, which is funded by the NIH National Center for Research Resources, for other strains used in this work. This study was supported by grants from the Association pour la Recherche sur le Cancer (ARC, F. Solari, No. 076751) and CNRS (AO “Longévité et Vieillissement”). We are grateful to S. Croze, N. Nazaret, and C. Rey from ProfileXpert, Génomique & Microgénomique, Université Lyon 1, SFR santé LYON-EST, UCBL-INSERM US 7-CNRS UMS 3453 for gene expression analysis. We also thank Erin Rossini for carefully reading and correcting the manuscript.
Supporting Information Available
Metabolite variations with age in WT, slcf-1(tm2258) and eat-2(ad465). Goodness-of-fit parameter values for the OPLS models discriminating young adults and adults for WT, slcf-1(tm2258), and eat-2(ad465) and for each age, discriminating WT from slcf-1(tm2258) or eat-2(ad465). Metabolite variations: between WT and long-lived mutants slcf-1(tm2258) or eat-2(ad465) in young adults and 7-day-old adults; with age in daf-18(e1375) mutants and daf-18(e1375);slcf-1(tm2258) double mutants; between WT and daf-18(e1375) or daf-18(e1375);slcf-1(tm2258) in young adults and adults. Wild-type and mutants average lifespans and corresponding phosphocholine levels. Relative concentration of leucine in young and 7-day-old adults WT, slcf-1(tm2258), daf-18(e1375), and daf-18(e1375); slcf-1(tm2258) double mutants. This material is available free of charge via the Internet at http://pubs.acs.org.
Author Present Address
¶ (L. Mouchiroud) Laboratory of Integrative and Systems Physiology, École Polytechnique Fédérale de Lausanne, CH-1015 Lausanne, Switzerland.
Author Present Address
∥ (N. Dallière) Centre of Biological Sciences, University of Southampton, Life Sciences Building 85, Highfield Campus, Southampton, SO17 1BJ.
Author Contributions
⊥ C. Pontoizeau and L. Mouchiroud contributed equally to this work.
The authors declare no competing financial interest.
Funding Statement
National Institutes of Health, United States
Supplementary Material
References
- Fontana L.; Partridge L.; Longo V. D. Extending healthy life span—from yeast to humans. Science 2010, 3285976321–6. [DOI] [PMC free article] [PubMed] [Google Scholar]
- Wang Y.; Lawler D.; Larson B.; Ramadan Z.; Kochhar S.; Holmes E.; Nicholson J. K. Metabonomic investigations of aging and caloric restriction in a life-long dog study. J. Proteome Res. 2007, 651846–54. [DOI] [PubMed] [Google Scholar]
- Zhang Y.; Yan S.; Gao X.; Xiong X.; Dai W.; Liu X.; Li L.; Zhang W.; Mei C. Analysis of urinary metabolic profile in aging rats undergoing caloric restriction. Aging: Clin. Exp. Res. 2012, 24179–84. [DOI] [PubMed] [Google Scholar]
- Selman C.; Kerrison N. D.; Cooray A.; Piper M. D.; Lingard S. J.; Barton R. H.; Schuster E. F.; Blanc E.; Gems D.; Nicholson J. K.; Thornton J. M.; Partridge L.; Withers D. J. Coordinated multitissue transcriptional and plasma metabonomic profiles following acute caloric restriction in mice. Physiol. Genomics 2006, 273187–200. [DOI] [PubMed] [Google Scholar]
- Rezzi S.; Martin F. P.; Shanmuganayagam D.; Colman R. J.; Nicholson J. K.; Weindruch R. Metabolic shifts due to long-term caloric restriction revealed in nonhuman primates. Exp. Gerontol. 2009, 445356–62. [DOI] [PMC free article] [PubMed] [Google Scholar]
- De Guzman J. M.; Ku G.; Fahey R.; Youm Y. H.; Kass I.; Ingram D. K.; Dixit V. D.; Kheterpal I.. Chronic caloric restriction partially protects against age-related alteration in serum metabolome. Age (Dordrecht, Neth.) 2013, 35, (4), 1091–104. [DOI] [PMC free article] [PubMed] [Google Scholar]
- Lakowski B.; Hekimi S. The genetics of caloric restriction in Caenorhabditis elegans. Proc. Natl. Acad. Sci. U.S.A. 1998, 952213091–6. [DOI] [PMC free article] [PubMed] [Google Scholar]
- Mouchiroud L.; Molin L.; Kasturi P.; Triba M. N.; Dumas M. E.; Wilson M. C.; Halestrap A. P.; Roussel D.; Masse I.; Dalliere N.; Segalat L.; Billaud M.; Solari F. Pyruvate imbalance mediates metabolic reprogramming and mimics lifespan extension by dietary restriction in Caenorhabditis elegans. Aging Cell 2011, 10139–54. [DOI] [PubMed] [Google Scholar]
- Blaise B. J.; Giacomotto J.; Elena B.; Dumas M. E.; Toulhoat P.; Segalat L.; Emsley L. Metabotyping of Caenorhabditis elegans reveals latent phenotypes. Proc. Natl. Acad. Sci. U.S.A. 2007, 1045019808–12. [DOI] [PMC free article] [PubMed] [Google Scholar]
- Blaise B. J.; Giacomotto J.; Triba M. N.; Toulhoat P.; Piotto M.; Emsley L.; Segalat L.; Dumas M. E.; Elena B. Metabolic profiling strategy of Caenorhabditis elegans by whole-organism nuclear magnetic resonance. J. Proteome Res. 2009, 852542–50. [DOI] [PubMed] [Google Scholar]
- Brenner S. The genetics of Caenorhabditis elegans. Genetics 1974, 77171–94. [DOI] [PMC free article] [PubMed] [Google Scholar]
- Pilipiuk J.; Lefebvre C.; Wiesenfahrt T.; Legouis R.; Bossinger O. Increased IP3/Ca2+ signaling compensates depletion of LET-413/DLG-1 in C. elegans epithelial junction assembly. Dev. Biol. 2009, 327134–47. [DOI] [PubMed] [Google Scholar]
- Hunt-Newbury R.; Viveiros R.; Johnsen R.; Mah A.; Anastas D.; Fang L.; Halfnight E.; Lee D.; Lin J.; Lorch A.; McKay S.; Okada H. M.; Pan J.; Schulz A. K.; Tu D.; Wong K.; Zhao Z.; Alexeyenko A.; Burglin T.; Sonnhammer E.; Schnabel R.; Jones S. J.; Marra M. A.; Baillie D. L.; Moerman D. G. High-throughput in vivo analysis of gene expression in Caenorhabditis elegans. PLoS Biol. 2007, 59e237. [DOI] [PMC free article] [PubMed] [Google Scholar]
- Dieterle F.; Ross A.; Schlotterbeck G.; Senn H. Probabilistic quotient normalization as robust method to account for dilution of complex biological mixtures. Application in 1H NMR metabonomics. Anal. Chem. 2006, 78134281–90. [DOI] [PubMed] [Google Scholar]
- Wishart D. S.; Knox C.; Guo A. C.; Eisner R.; Young N.; Gautam B.; Hau D. D.; Psychogios N.; Dong E.; Bouatra S.; Mandal R.; Sinelnikov I.; Xia J.; Jia L.; Cruz J. A.; Lim E.; Sobsey C. A.; Shrivastava S.; Huang P.; Liu P.; Fang L.; Peng J.; Fradette R.; Cheng D.; Tzur D.; Clements M.; Lewis A.; De Souza A.; Zuniga A.; Dawe M.; Xiong Y.; Clive D.; Greiner R.; Nazyrova A.; Shaykhutdinov R.; Li L.; Vogel H. J.; Forsythe I. HMDB: a knowledge base for the human metabolome. Nucleic Acids Res. 2009, 37Database issueD603–10. [DOI] [PMC free article] [PubMed] [Google Scholar]
- Cui Q.; Lewis I. A.; Hegeman A. D.; Anderson M. E.; Li J.; Schulte C. F.; Westler W. M.; Eghbalnia H. R.; Sussman M. R.; Markley J. L. Metabolite identification via the Madison Metabolomics Consortium Database. Nat. Biotechnol. 2008, 262162–4. [DOI] [PubMed] [Google Scholar]
- Wold S.; Esbensen K.; Geladi P. Principal Component Analysis. Chemom. Intel. Lab. Syst. 1987, 21–337–52. [Google Scholar]
- Trygg J.; Wold S. Orthogonal projections to latent structures (O-PLS). J. Chemom. 2002, 163119–128. [Google Scholar]
- Blaise B. J.; Shintu L.; Elena B.; Emsley L.; Dumas M. E.; Toulhoat P. Statistical recoupling prior to significance testing in nuclear magnetic resonance based metabonomics. Anal. Chem. 2009, 81156242–51. [DOI] [PubMed] [Google Scholar]
- Benjamini Y.; Yekutieli D. The control of the false discovery rate in multiple testing under dependency. Ann. Stat. 2001, 2941165–1188. [Google Scholar]
- Herndon L. A.; Schmeissner P. J.; Dudaronek J. M.; Brown P. A.; Listner K. M.; Sakano Y.; Paupard M. C.; Hall D. H.; Driscoll M. Stochastic and genetic factors influence tissue-specific decline in ageing C. elegans. Nature 2002, 4196909808–14. [DOI] [PubMed] [Google Scholar]
- Greer E. L.; Brunet A. Different dietary restriction regimens extend lifespan by both independent and overlapping genetic pathways in C. elegans. Aging Cell 2009, 82113–27. [DOI] [PMC free article] [PubMed] [Google Scholar]
- Mair W.; Panowski S. H.; Shaw R. J.; Dillin A. Optimizing Dietary Restriction for Genetic Epistasis Analysis and Gene Discovery in C. elegans. PLoS One 2009, 42e4535. [DOI] [PMC free article] [PubMed] [Google Scholar]
- Solari F.; Bourbon-Piffaut A.; Masse I.; Payrastre B.; Chan A. M.; Billaud M. The human tumour suppressor PTEN regulates longevity and dauer formation in Caenorhabditis elegans. Oncogene 2005, 24120–7. [DOI] [PubMed] [Google Scholar]
- Fuchs S.; Bundy J. G.; Davies S. K.; Viney J. M.; Swire J. S.; Leroi A. M. A metabolic signature of long life in Caenorhabditis elegans. BMC Biol. 2010, 8, 14. [DOI] [PMC free article] [PubMed] [Google Scholar]
- Martin F. P.; Spanier B.; Collino S.; Montoliu I.; Kolmeder C.; Giesbertz P.; Affolter M.; Kussmann M.; Daniel H.; Kochhar S.; Rezzi S. Metabotyping of Caenorhabditis elegans and their culture media revealed unique metabolic phenotypes associated to amino acid deficiency and insulin-like signaling. J. Proteome Res. 2011, 103990–1003. [DOI] [PubMed] [Google Scholar]
- Gee P.; Kent C. Multiple isoforms of choline kinase from Caenorhabditis elegans: cloning, expression, purification, and characterization. Biochim. Biophys. Acta 2003, 16481–233–42. [DOI] [PubMed] [Google Scholar]
- Calfon M.; Zeng H.; Urano F.; Till J. H.; Hubbard S. R.; Harding H. P.; Clark S. G.; Ron D. IRE1 couples endoplasmic reticulum load to secretory capacity by processing the XBP-1 mRNA. Nature 2002, 415686792–6. [DOI] [PubMed] [Google Scholar]
- Urano F.; Calfon M.; Yoneda T.; Yun C.; Kiraly M.; Clark S. G.; Ron D. A survival pathway for Caenorhabditis elegans with a blocked unfolded protein response. J. Cell Biol. 2002, 1584639–46. [DOI] [PMC free article] [PubMed] [Google Scholar]
- Caruso M. E.; Jenna S.; Bouchecareilh M.; Baillie D. L.; Boismenu D.; Halawani D.; Latterich M.; Chevet E. GTPase-mediated regulation of the unfolded protein response in Caenorhabditis elegans is dependent on the AAA+ ATPase CDC-48. Mol. Cell. Biol. 2008, 28134261–74. [DOI] [PMC free article] [PubMed] [Google Scholar]
- Taylor R. C.; Dillin A. XBP-1 Is a cell-nonautonomous regulator of stress resistance and longevity. Cell 2013, 15371435–47. [DOI] [PMC free article] [PubMed] [Google Scholar]
- Wijeyesekera A.; Selman C.; Barton R. H.; Holmes E.; Nicholson J. K.; Withers D. J. Metabotyping of long-lived mice using 1H NMR spectroscopy. J. Proteome Res. 2012, 1142224–35. [DOI] [PMC free article] [PubMed] [Google Scholar]
- Houtkooper R. H.; Argmann C.; Houten S. M.; Canto C.; Jeninga E. H.; Andreux P. A.; Thomas C.; Doenlen R.; Schoonjans K.; Auwerx J. The metabolic footprint of aging in mice. . Sci. Rep. 2011, 1, 134. [DOI] [PMC free article] [PubMed] [Google Scholar]
- Yu Z.; Zhai G.; Singmann P.; He Y.; Xu T.; Prehn C.; Romisch-Margl W.; Lattka E.; Gieger C.; Soranzo N.; Heinrich J.; Standl M.; Thiering E.; Mittelstrass K.; Wichmann H. E.; Peters A.; Suhre K.; Li Y.; Adamski J.; Spector T. D.; Illig T.; Wang-Sattler R. Human serum metabolic profiles are age dependent. Aging cell 2012, 116960–7. [DOI] [PMC free article] [PubMed] [Google Scholar]
Associated Data
This section collects any data citations, data availability statements, or supplementary materials included in this article.


