

Abstract
One of the hallmarks of numerous life-threatening and debilitating brain diseases is cellular swelling that negatively impacts extracellular space (ECS) structure. The ECS structure is determined by two macroscopic parameters, namely tortuosity (λ) and volume fraction (α). Tortuosity represents hindrance imposed on the diffusing molecules by the tissue in comparison with an obstacle-free medium. Volume fraction is the proportion of tissue volume occupied by the ECS. From a clinical perspective, it is essential to recognize which factors determine the ECS parameters and how these factors change in brain diseases. Previous studies demonstrated that dead-space (DS) microdomains increased λ during ischemia and hypotonic stress, as these pocket-like structures transiently trapped diffusing molecules. We hypothesize that astrocytes play a key role in the formation of DS microdomains because their thin processes have concave shapes that may elongate as astrocytes swell in these pathologies. Here we selectively swelled astrocytes in the somatosensory neocortex of rat brain slices with a gliotoxin DL-α-Aminoadipic Acid (DL-AA), and we quantified the ECS parameters using Integrative Optical Imaging (IOI) and Real-Time Iontophoretic (RTI) diffusion methods. We found that α decreased and λ increased during DL-AA application. During recovery, α was restored whereas λ remained elevated. Increase in λ during astrocytic swelling and recovery is consistent with the formation of DS microdomains. Our data attribute to the astrocytes an important role in determining the ECS parameters, and indicate that extracellular diffusion can be improved not only by reducing the swelling but also by disrupting the DS microdomains.
Keywords: Tortuosity, volume fraction, DL-α-aminoadipic acid, somatosensory neocortex, rat
INTRODUCTION
Brain cells are surrounded by extracellular space (ECS) that facilitates diffusion- mediated transport of signaling molecules, ions, nutrients, and therapeutic agents (Fellows et al., 1992; Nicholson, 1979; Ulbrich et al., 1997). Diffusion of these substances is governed by two macroscopic parameters of the ECS structure, tortuosity (λ) and volume fraction (α). The tortuosity parameter represents the hindrance imposed on the diffusing molecules by the tissue in comparison with an obstacle-free medium whereas the volume fraction parameter is the proportion of tissue volume occupied by the ECS (Nicholson, 2001). In a healthy brain tissue, λ is about 1.6 and α is about 0.20 (Nicholson and Philips, 1981), but both parameters change dramatically in pathologies accompanied by cell swelling (Hrabetova et al., 2002; Kume-Kick et al., 2002; Pérez-Pinzón et al., 1995; Syková et al., 1994). For example, during ischemia in rat neocortex in vivo λ increased to 2.0 while α was as low as 0.06 (Voříšek and Syková, 1997). Consequently, drastically compromised diffusion in the ECS presents a formidable challenge for drug delivery strategies, augments brain dysfunction and hinders recovery. From a perspective of patient care, it is essential that we identify factors determining the ECS parameters, and how these factors change in brain pathologies and during recovery.
The ECS structural elements that may contribute to λ are under debate. It had been thought that λ can be explained by circumnavigation of diffusing molecules around obstacles formed by convex cells. However, λ derived theoretically or obtained from simulations in media composed of convex elements, exhibited an upper limit of 1.225, for α ranging from 0 to 1 (El-Kareh et al., 1993; Hrabe et al., 2004; Hrabetova et al., 2003; Tao et al., 2004). Therefore some other factor must determine λ in the brain. One hypothesis proposed that λ can be explained by a more complex geometry of the ECS with dead-end pores or voids, and this hypothesis led to the development of a dead-space (DS) microdomain model of λ based on diffusion dwell-times (Hrabe et al., 2004; Hrabetova et al., 2003; Hrabetova and Nicholson, 2004). In this model, diffusing molecules are transiently held in the DS microdomains, and as their travel through the ECS is delayed, λ increases. The DS microdomain hypothesis was supported by experiments in the somatosensory rat neocortex during ischemia and hypotonic stress where λ was shown to increase through the formation of DS microdomains (Hrabetova et al., 2003).
In brain tissue, astrocytes have potential to form the DS microdomains and determine λ because of their complex morphology (Hrabe et al., 2004; Hrabetova, 2005; Hrabetova et al., 2003). Many thin astrocytic processes have concave shapes that wrap synapses or they intercalate between neuronal somata and processes (Grosche et al., 1999; Kosaka and Hama, 1986; Špaček, 1985). It has been reported that λ is higher in a brain region, where astrocytic wrappings of synapses are more complete (Hrabetova, 2005). Piet et al. (2004) found that λ in the hypothalamic supraoptic nucleus is higher in virgin rats where the astrocytes extensively wrap neurons and synapses than in the lactating rats where the astrocytic wrapping is reduced. Additional evidence suggesting that astrocytes impede diffusion in the ECS comes from studies in brain pathological conditions. Astrocytes are the most noticeable cells to swell in pathological states such as ischemia and hypotonic stress (Aschner et al., 1999) where the DS microdomains were shown to contribute to λ (Hrabetova et al., 2003). Because these studies suggest that astrocytes may play a key role in the DS microdomain formation, and consequently contribute to λ, we selectively manipulated astrocytes and quantified the ECS parameters.
It is a challenging task to manipulate a single cellular type within the complex environment of intact tissue. One useful experimental tool is a structural analog of glutamate α-Aminoadipic Acid (AA) (McBean, 1994) that selectively swells astrocytes. Here we measured diffusion of fluorophore-labeled dextran (f-dex, MW 3000) and tetramethylammonium (TMA+, MW 74) using the Integrative Optical Imaging (IOI) method (Nicholson and Tao 1993) and the Real Time Iontophoretic (RTI) method (Nicholson and Phillips 1981), respectively, to quantify the ECS parameters in the somatosensory neocortex of rat brain slices during superfusion with gliotoxin DL-AA and during the recovery. Diffusion measurements were complemented by measurements of [K+] in the ECS during DL-AA application using potassium-selective microelectrodes.
MATERIALS AND METHODS
Preparation of rat brain slices
All experiments were performed at State University of New York Downstate Medical Center in adherence with the National Institute of Health (NIH) guidelines and local Institutional Animal Care and Use Committee regulations. Coronal slices (400 μm thick) were prepared from adult female Sprague-Dawley rats (44 animals, 137 – 272 g) as described previously (Hrabetova, 2005). The animals were anesthetized with sodium pentobarbital (50 mg kg−1, i.p.) and decapitated. The brain was removed from the skull and chilled with ice-cold artificial cerebrospinal fluid (ACSF). The ACSF comprised of (mM): NaCl 124, KCl 5, NaHCO3 26, NaH2PO4 1.25, D-Glucose 10, MgCl2 1.3 and CaCl2 1.5, was gassed with 95% O2/5% CO2 mixture to buffer at pH 7.4. Osmolality of the ACSF was measured with a freezing point-depression osmometer (Osmette A #5002; Precision Systems Inc., Natick, MA, USA) and the values were in the range of 295–305 mosmol/kg. The slices were prepared using a microtome with a vibrating blade (Leica VT1200S; Leica Microsystems GmbH, Nussloch, Germany). Slices were submerged in the ACSF in an incubation chamber at room temperature for at least an hour to allow for a recovery after the dissection. To provide a calibration standard for TMA+ diffusion experiments, 0.5 mM TMA+ chloride was added to the ACSF in the incubation chamber and to the ACSF superfusing the slices in the recording chamber.
For diffusion experiments, brain slices were transferred to a submersion tissue chamber (Warner model RC-27L; Harvard Apparatus, Holliston, MA, USA) and superfused with the ACSF at a flow rate of 2.0 mL min−1. The temperature of the ACSF was maintained at 34 ± 1°C in the recording chamber through a dual automatic temperature controller (Warner model TC-344B; Harvard Apparatus) operating an in-line heater (Warner model SH-27A; Harvard Apparatus) along with a chamber heating system. All experiments were done in the somatosensory neocortex. Gliotoxin DL-AA (catalog# A0637; Sigma-Aldrich, St. Louis, MO, USA) was dissolved in the ACSF at the concentrations 0.1, 0.5, 2, 3 and 4 mM.
Integrative Optical Imaging (IOI) Method
The Integrative Optical Imaging method (Nicholson and Tao, 1993; Tao and Nicholson, 1995) is a diffusion-based method that uses a CCD (charge-coupled device) camera attached to a compound microscope to measure the distribution of a fluorophore or fluorophore-labeled probe molecule released from a point source into the medium. Small dextran molecules are often used as probe molecules (Hrabetova et al., 2003; Nicholson and Tao, 1993; Thorne and Nicholson, 2006).
Dextran (MW 3000) labeled with the fluorophore Texas Red (f-dex; catalog# D3329; Life Technologies, Carlsbad, CA, USA) was dissolved in 150 mM NaCl to provide a final concentration of 1 mM. A glass micropipette (tip diameter 2–4 μm) was prepared from a thin-walled glass tubing (catalog# 6170; A-M Systems, Carlsborg, WA, USA), backfilled with f-dex solution, and attached to an electronically controlled pressure injection unit (Picospritzer; Parker Hannifin Corp., Fairfield, NJ, USA). The f-dex was injected by a brief pulse (50–400 ms, 10–30 psi) of compressed nitrogen into a dilute agarose gel [0.3% (w/v) in 150 mM NaCl; NuSieve GTG Agarose, catalog# 50081, Lonza, Rockland, ME, USA] or a brain slice. The tip of the glass micropipette was placed at 200 μm below the surface of a brain slice.
Diffusion measurements with the IOI method were performed on a setup composed of a CCD camera (QuantEM 512SC; Photometrics, Tucson, AZ, USA) attached to a compound microscope (BX61WI; Olympus America, Melville, NY, USA) equipped with a water immersion objective (Olympus, UMPlanFl; 10x, numerical aperture 0.3) and infrared (IR) differential interference contrast (DIC) optics to allow for tissue and glass micropipette visualization. During the fluorescence imaging, the excitation light from a 300 W xenon lamp was directed to the specimen using a dichroic mirror containing the Texas Red filter set. For each pressure injection of f-dex, a set of 30 two-dimensional images was taken at preset intervals (dilute agarose gel: 1 s; brain slice: 3 s). The f-dex injection and image acquisition were controlled by V++ for Windows (Digital Optics, Auckland, New Zealand) and MATLAB-based program (The MathWorks, Natick, MA, USA) DEVIDA (Nicholson et al., 2011).
Acquired data were analyzed using MATLAB-based program IDA (Hrabetova and Nicholson, 2007; Nicholson et al., 2011). An appropriate solution of the diffusion equation was fitted to intensity profiles obtained along 0, 30, 60, 90, 120 and 150 degree angles running through the center of each image within a set, and six values of γ2/4 were obtained for each image, where γ2 = 4D*(ti + to), ti is the time at which image was taken and to is the time offset that compensates for the finite size of the injection (Nicholson and Tao, 1993). A diffusion coefficient was calculated for each of six axes by applying a linear regression to the time series of γ2/4 values. To increase robustness of the estimate, the maximal and minimal diffusion coefficients were discarded, and the remaining four values of diffusion coefficient were averaged. Diffusion measurements in a dilute agarose gel yielded the free diffusion coefficient D (cm2s−1). Diffusion measurements in a brain slice yielded the effective diffusion coefficient D* (cm2s−1). The tortuosity was calculated as λ = (D/D*) 1/2.
Real-Time Iontophoretic (RTI) Method
The Real-Time Iontophoretic method (Nicholson and Philips, 1981) is a diffusion-based method that employs an ion-selective microelectrode (ISM) to detect specific ions released iontophoretically from a microelectrode. Tetramethylammonium (MW 74; TMA+) is often used as the probe molecule, and hence the method is also known as the TMA method.
The microelectrodes were prepared from a double-barreled theta glass (TG200-4; Warner Instruments Corp., Hamden, CT, USA) as described previously (Nicholson, 1993). The iontophoretic microelectrode (both barrels) was backfilled with 150 mM TMA+ chloride and connected to a constant current, high impedance source (model PS-100 Iontophoresis Generator; Dagan Corporation, Minneapolis, MN, USA). A constant positive bias current (20 nA) was applied to an iontophoretic microelectrode to maintain a stable transport number (nt) at all times during diffusion experiment (Nicholson and Philips, 1981). To obtain a diffusion curve, the iontophoretic current was increased to 60–120 nA for 50 s. For TMA+-ISM, the ion-detecting barrel was backfilled with 150 mM TMA+ chloride and contained a short column of TMA+-detecting tetraphenylborate-based ion-exchanger (Corning exchanger 477317; currently available as IE 190 from WPI, Sarasota, FL, USA) in the tip. The reference barrel detecting the DC potential was backfilled with 150 mM NaCl. Each TMA+-ISM was calibrated in a set of standard solutions (0.5, 1, 2, 4, and 8 mM TMA+ in 150 mM NaCl) before and after each experiment. The calibration voltages were fitted to the Nikolsky equation to obtain the slope and the interference of each TMA+-ISM that were used for voltage-to-concentration conversion (Nicholson, 1993). To test whether a TMA+-ISM had any sensitivity to DL-AA, we calibrated several microelectrodes in a separate set of calibration solutions containing 3 mM DL-AA. No effect on TMA+-ISM slope was found.
The recording setup was mounted on a Gibraltar fixed-stage and used along with a compound microscope (BX51W1; Olympus America Inc., Melville, NY, USA). A CCD camera (OLY 150; Olympus America Inc.) was attached to the microscope. In the setup, the TMA+-ISM and iontophoretic microelectrodes were held in two independent robotic manipulators (MP285; Sutter Instruments Co., Novato, CA, USA) allowing precise and controlled movements (Hrabetova et al., 2002). For diffusion measurements, the tips of a TMA+-ISM and an iontophoretic microelectrode were held 120 μm apart. In brain slices, recording depth was 200 μm. The TMA+ signal was obtained by continuously subtracting the reference signal from ion-detecting barrel signal using a dual channel microelectrode preamplifier (model IX2-700; Dagan Corp.), which also amplified TMA+ and DC signals. The TMA+ and DC signals were further amplified and low-pass (2 Hz) filtered using a CyberAmp 320 (Axon Instruments Inc., Union City, CA, USA). Amplified signals were digitized with an analog-to-digital converter (model PCI-MIO-16E-4; National Instruments, Austin, TX, USA) and acquired using the MATLAB-based program (MathWorks, Natick, MA, USA) WANDA (Hrabetova and Nicholson, 2007; Nicholson et al., 2011). The acquired diffusion curves were fitted with an appropriate solution of diffusion equation using a MATLAB-based program WALTER (Hrabetova and Nicholson, 2007; Nicholson et al., 2011). The TMA+ and DC signals were also continuously monitored on a chart recorder.
Diffusion measurements obtained in a dilute agarose gel yielded the free diffusion coefficient D (cm2 s−1) of TMA+ and the transport number (nt) of the iontophoretic microelectrode, while measurements in a brain slice provided the effective diffusion coefficient D* (cm2 s−1), the volume fraction (α), and a nonspecific clearance k′ (s−1) (Nicholson, 1992). The tortuosity was calculated as λ = (D/D*) 1/2. To verify the constancy of nt, additional measurements were taken in a dilute agarose gel after the brain diffusion experiments.
Ion-Selective Microelectrodes for potassium
The ion-selective microelectrodes for potassium (K+-ISM) were prepared in a similar way as the TMA+-ISM (Hrabetova et al., 2002). The ion-detecting barrel was backfilled with 150 mM KCl and it contained a short column of the same tetraphenylborate-based ion-exchanger (also used for TMA+-ISM) in the tip to detect K+ ions. In the absence of TMA+, the tetraphenylborate-based ion-exchanger is sensitive to K+. For [K+]ECS measurements, TMA+ chloride was not added to the ACSF incubating and superfusing brain slices. The reference barrel of the K+-ISM was backfilled with 150 mM NaCl. Each K+-ISM was calibrated in a set of standard solutions (3, 6, 12, 24 and 48 mM K+ in 150 mM NaCl) before and after each experiment. The calibration voltages were fitted to the Nikolsky equation to obtain the slope and the interference of each K+-ISM that were used for voltage-to-concentration conversion (Nicholson, 1993).
Immunohistochemistry
Immunostaining for the GFAP (glial fibrillary acidic protein) and vimentin was done in brain slices from control, 3 mM DL-AA treated, and recovery conditions as described previously (Alonso, 2001; Wang and Hatton, 2009) with small modifications. The 400 μm slices were fixed in formalde solution (catalog# SF94-4; Fisher Scientific, Suwanee, GA, USA) overnight at 4°C. The fixed slices were cut to 40 μm thick sections using a microtome with a vibrating blade (Leica VT1200S; Leica Microsystems GmbH, Nussloch, Germany). The sections were rinsed three times (5 minutes each) in 0.01 M phosphate-buffered saline (PBS; catalog# R027, G Bioscience, Maryland Heights, MO, USA; pH 7.5) followed by permeabilization with 0.3% Triton X-100 (catalog# T8787; Sigma-Aldrich, St. Louis, MO, USA) in PBS.
The sections were then incubated for an hour in a blocking solution containing 2% normal goat serum (catalog# 005-000-121; Jackson ImmunoResearch, West Grove, PA, USA) and 0.2% Triton-X 100 in PBS. The sections were incubated in primary mouse anti-GFAP antibody (1:100; catalog# IF03L, Life Technologies) and primary rabbit anti-vimentin antibody (1:100; catalog# ab92547, Abcam, Cambridge, MA, USA) overnight at 4°C. The primary antibodies were diluted in a solution containing 3% bovine serum albumin (BSA; catalog# 001-000-161, Jackson ImmunoResearch) and 0.2% Triton-X 100 in PBS. The sections were rinsed six times (5 minutes each) in PBS containing 0.2% Triton-X-100.
The sections were incubated in FITC-conjugated donkey anti-mouse secondary antibody (1:100 for GFAP; catalog# 715-095-151, Jackson ImmunoResearch) and Alexa Fluor-conjugated goat anti-rabbit secondary antibody (1:200 for vimentin; catalog# ab150079, Abcam) for an hour at room temperature. The secondary antibodies were diluted in a solution containing 1% BSA and 0.2% Triton-X 100 in PBS. The sections were rinsed three times (5 minutes each) with PBS containing 0.2% Triton-X-100 and mounted on glass slides with Vectashield mounting medium (H-1000; Vector Laboratories, Burlingame, CA, USA).
Images of sections obtained from slices under control, 3 mM DL-AA treated, and recovery conditions were taken with a laser scanning confocal microscope (Bio-Radiance 2000; Bio-Rad) in a sequential scanning mode. Z-series of 11 images (0.5 μm thick) was taken with 40X with oil objective and a central image was used for analysis. All images (ROI: 308 μm × 308 μm) from each experiment were obtained at the same settings of gain, offset, illumination, pin-hole, magnification and power. The integrated density of intensity from each image was quantified using ImageJ 1.46i (http://rsb.info.nih.gov/ij/) and background intensity was subtracted. For each experiment, the intensities measured in the sections from the DL-AA treated group and in the sections from the recovery group were expressed as percentages of intensities obtained in the sections from the control group.
Statistical Analysis
Statistical analysis was performed by the Scientific Computing Center at SUNY Downstate using SAS (SAS Institute, Cary NC) Release 9.2 (PROC GLIMMIX, NPAR1WAY). For diffusion experiments, a mixed linear model analysis was employed because of uneven number of observations and animals in each treatment, and because of two levels of repeated measures (animal and slice). Since observations coming from the same animal and from the same slice are plausibly correlated, a mixed linear model was constructed for each analysis. Random factors were an animal and a slice nested within animal, while fixed effects were DL-AA concentrations (0.1, 0.5, 2, 3 and 4 mM) or different conditions of the slice (control, 3 mM DL-AA, and recovery). As a pair-wise post-hoc test, we used Dunnett test (control vs. each of five DL-AA concentrations) or bootstrap test (among five DL-AA concentrations; among three different conditions). Model residuals were inspected for skew and for outliers.
For immunohistochemical experiments, a Kruskal-Wallis one way ANOVA was used to determine statistical significance among three conditions (control, 3 mM DL-AA, and recovery), followed by a pair-wise post-hoc comparisons with Dunn’s test. For experiments measuring potassium concentration, a Wilcoxon signed rank test was used to determine statistical significance between [K+] ECS in control versus DL-AA treatment.
For all tests performed, p < 0.05 was considered significant. All data are presented as mean ± SD (n) where n = number of observations.
RESULTS
Gliotoxin DL-AA increases tortuosity measured in somatosensory neocortex with IOI method and f-dex probe molecules
We studied the effect of astrocytic swelling on the tortuosity by measuring the extracellular diffusion during control conditions and during application of gliotoxin DL-AA. For this purpose, we employed the diffusion-based IOI method with fluorophore-labeled dextran (f-dex, MW 3000) as a probe molecule. Prior to experiments in brain tissue, the free diffusion coefficient (D, cm2s−1) of f-dex was measured in a dilute agarose gel at 34°C (20.5 ± 0.23 × 10⁻⁷ cm2s−1, 169; mean ± SD, number of observations) and used, together with effective diffusion coefficient (D*, cm2s−1) measured in the somatosensory neocortex to calculate λ. We first quantified λ under control conditions. Then, DL-AA was added to ACSF superfusing a brain slice, and after 0.5 hr of equilibration, λ was measured for up to 1 hour. We began with 2 mM concentration of DL-AA, which was reported to be effective in rat hypothalamic slices (Fleming et al., 2011).
Representative time-series of f-dex images with corresponding intensity profiles are presented in Fig. 1A. Application of gliotoxin increased hindrance to the diffusion of f-dex, as revealed by a less steep linear regression line in 2 mM DL-AA treated tissue compared to control conditions (Fig. 1B). The value of λ increased from 1.72 ± 0.11 (184) measured under control conditions to 1.93 ± 0.16 (15) during application of 2 mM DL-AA (p < 0.05, mixed linear model).
Fig. 1.

Tortuosity in the somatosensory neocortex during DL-AA application. (A) Representative time-series of f-dex images obtained with the IOI method in the somatosensory neocortex under control conditions (top panel) and during 2 mM DL-AA application (bottom panel). The images shown here were taken immediately after the f-dex release (labeled t = 0 s) and at the times indicated. The concentration of f-dex in the tissue is shown in pseudo color (red is the highest concentration and blue is the lowest concentration). Intensity profiles (yellow and red lines) extracted along the horizontal axis running through the center of the image (white dashed line) are superimposed with theoretical curves (black dotted lines). Scale bar is 100 μm. (B) Linear regression line applied to a time series of γ2/4 values extracted from each image provided D* = 6.92 × 10⁻⁷ cm2s−1 for control conditions (open circles) and D* = 5.29 × 10⁻⁷ cm2s−1 during 2 mM DL-AA application (closed circles) at 34°C. Tortuosity values were 1.72 and 1.97 under control conditions and during 2 mM DL-AA application, respectively. (C) A summary of λ values obtained with f-dex under control conditions and during DL-AA application (0.1, 0.5, 2, 3 and 4 mM). Statistically significant differences are marked with asterisks (see Results section for details).
Next, we wanted to know whether changes in λ value depend on DL-AA concentration and to determine DL-AA concentration that would induce the largest increase in λ. We therefore measured λ in the somatosensory neocortex incubated with four additional concentrations of DL-AA (0.1, 0.5, 3 and 4 mM). Results are summarized in Fig. 1C. Statistical analysis revealed that the values of λ measured in all DL-AA concentrations tested were significantly higher than λ measured under control conditions (p < 0.05, mixed linear model). Pair-wise comparison of λ values for non-zero DL-AA concentrations showed that the values of λ in 3 mM DL-AA [2.48 ± 0.33 (76)] and 4 mM DL-AA [2.49 ± 0.36 (11)] were significantly higher than the values of λ in 0.1, 0.5, and 2 mM DL-AA (Fig. 1C; p < 0.05, mixed linear model). In conclusion, we established that the DL-AA treatment increases tissue hindrance to f-dex in a concentration dependent manner, and that 3 mM and 4 mM DL-AA led to the largest increase in λ. We used 3 mM DL-AA in all following experiments.
Tortuosity measured with IOI method and f-dex probe molecule remains elevated during recovery
Next, we wanted to know whether λ in the somatosensory neocortex could be restored to its control value when DL-AA was removed. Accordingly, we measured λ using the IOI method with f-dex in slices under control conditions, during application of 3 mM DL-AA, and during 2 hr recovery in gliotoxin-free ACSF.
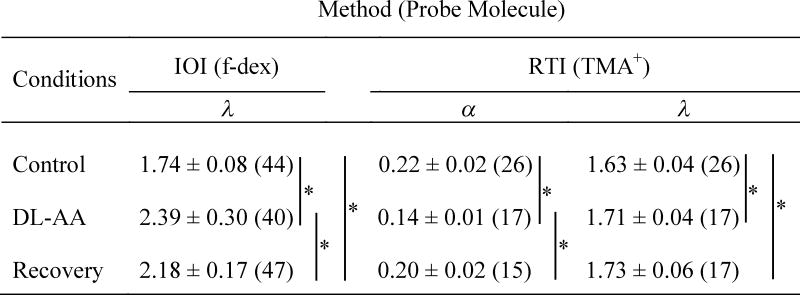
Representative time-series of f-dex images with corresponding intensity profiles are presented in Fig. 2A. In Fig. 2B, intensity profiles taken at a single time point (t = 48 s) in all three conditions were superimposed, and they show that while f-dex spread was increased during the recovery, f-dex continued to be hindered more than under control conditions. Correspondingly, the linear regression line for the recovery condition was steeper than in 3 mM DL-AA but not as steep as in the control conditions (Fig. 2C). Statistical analysis showed that while λ measured during the recovery [2.18 ± 0.17 (47)] was significantly lower than λ obtained during 3 mM DL-AA treatment [2.39 ± 0.30 (40)], it remained significantly higher compared to λ obtained under control conditions [1.74 ± 0.08 (44)] (Fig. 2D; p < 0.05, mixed linear model). Data are summarized in Table 1.
Fig. 2.

Tortuosity in the somatosensory neocortex during recovery. (A) Representative time-series of f-dex images obtained with the IOI method in the the somatosensory neocortex under control conditions (top panel), during 3 mM DL-AA application (middle panel), and during recovery (bottom panel). The images shown here were taken immediately after the f-dex release (labeled t = 0 s) and at the times indicated. The concentration of f-dex in the tissue is shown in pseudo color (red is the highest concentration and blue is the lowest concentration). Intensity profiles (yellow, red and green lines) extracted along the horizontal axis running through the center of the image (white dashed line) are superimposed with theoretical curves (black dotted lines). Scale bar is 100 μm. (B) Intensity profiles extracted from images taken at t = 48 s under three experimental conditions. (C) Linear regression line applied to a time series of γ2/4 values extracted from each image provided D* = 6.60 × 10⁻⁷ cm2s−1 for control conditions (open circles), D* = 3.82 × 10⁻⁷ cm2s−1 during 3 mM DL-AA application (closed circles) and D* = 4.25 × 10⁻⁷ cm2s−1 during the recovery (cross symbols) at 34°C. Tortuosity values were 1.76 (control), 2.31 (3 mM DL-AA), and 2.19 (recovery). (D) A summary of λ values obtained with f-dex in three experimental conditions. Statistically significant differences are marked with asterisks (see Results section for details).
TABLE 1.
ECS parameters measured in the somatosensory neocortex in rat brain slices using the IOI method and the RTI method.
|
Data are expressed as mean ± SD (n) where n = number of observations.
In conclusion, we found that gliotoxin-induced increase of λ persisted into the recovery period. We also found that λcontrol < λrecovery < λDL-AA indicating partial restoration during recovery in gliotoxin-free ACSF.
Previous studies showed that the changes in astrocytic morphology frequently associate with changes in a glial-specific intermediate filament protein, the glial fibrillary acidic protein (GFAP; Weinstein et al., 1991). Wang and Hatton (2009) reported a reduced GFAP immunostaining in the supraoptic nucleus of hypothalamic slices treated with an L-enantiomer of α-Aminoadipic acid. Here we immunolabeled the GFAP and another intermediate filament protein vimentin (Eliasson et al., 1999) in the somatosensory neocortex of brain slices under control conditions, during 3 mM DL-AA application, and during recovery. In line with Wang and Hatton (2009) report, we found that the GFAP immunostaining was reduced in the slices treated with 3 mM DL-AA in comparison with control slices, and we also observed that the GFAP immunostaining remained reduced in the recovery (Fig. 3A). GFAP immunostaining was reduced to 61% of control in 3 mM DL-AA (n = 14), and to 73% of control in recovery (n = 10) (p < 0.001, ANOVA; control: n = 17; there was no statistically significant difference between the DL-AA group and the recovery group). We did not observe any changes in vimentin immunolabeling among the three conditions (Fig. 3B).
Fig. 3.

Representative confocal images showing immunostaining for intermediate filament proteins GFAP (A) and vimentin (B) in the somatosensory neocortex under control conditions, during 3 mM DL-AA application, and during recovery. Scale bar is 20 μm.
Volume fraction measured with RTI method and TMA+ probe molecule decreases during 3 mM DL-AA treatment but restores during recovery
The experimental results obtained with the IOI method revealed that astrocytic swelling induced by DL-AA increases λ in the somatosensory neocortex. We expected that the volume of ECS (α) would decrease under this condition. Because the IOI method does not quantify α, we employed another diffusion-based technique, the Real-Time Iontophoretic (RTI) method, and we used tetramethylammonium (MW 74; TMA+) as a probe molecule. The RTI method quantifies α and it also measures λ. ECS parameters were first quantified under control conditions. Then, DL-AA was added to ACSF superfusing a brain slice, and after 0.5 hr of equilibration, α and λ were measured during 1 hour of DL-AA superfusion.
Representative TMA+ diffusion curves recorded under control conditions and during 3 mM DL-AA treatment are presented in Fig. 4A. The TMA+ curve recorded during DL-AA treatment has higher amplitude but rising and falling phases are less steep in comparison with a TMA+ curve recorded under control conditions. These features suggest lower α and higher λ during DL-AA treatment. Analysis of diffusion curves revealed a significant decrease (p < 0.05, mixed linear model) in α from 0.22 ± 0.02 (26) measured under control conditions to 0.14 ± 0.01 (17) during 3 mM DL-AA treatment (Fig. 4B). Tortuosity increased significantly (p < 0.05, mixed linear model) from 1.63 ± 0.04 (26) measured under control conditions to 1.71 ± 0.04 (17) during 3 mM DL-AA treatment (Fig. 4C). We established that in the somatosensory neocortex, α decreases while λ increases during 3 mM DL-AA treatment. The finding on the λ increase agrees with the results from diffusion experiments employing the IOI method.
Fig. 4.

Volume fraction and tortuosity in the somatosensory neocortex during DL-AA application and during recovery. (A) Representative TMA+ diffusion curves obtained with the RTI method under control condition, during 3 mM DL-AA treatment, and during recovery. The TMA+ diffusion curves (black solid lines) are superimposed with theoretical curves (grey dashed lines). TMA+-ISM measured the concentration of TMA+ released from an iontophoretic microelectrode (horizontal bar) placed 120 μm away. Records were taken at 34°C and nt was 0.29. The values of k′ were 0.017 s−1, 0.011 s−1 and 0.009 s−1 for control, 3 mM DL-AA, and recovery conditions, respectively. (B–C) A summary of α (B) and λ (C) values obtained under control conditions, during 3 mM DL-AA, and during the recovery. Statistically significant differences are marked with asterisks (see Results section for details).
Next, we quantified α and λ during a recovery phase. A representative TMA+ diffusion curve obtained during the recovery phase is presented along with the curves measured under control conditions and during 3 mM DL-AA treatment (Fig. 4A). The amplitude of TMA+ curve recorded during the recovery phase is smaller in comparison with the TMA+ curve recorded during DL-AA treatment but similar in comparison with the TMA+ curve recorded under control conditions suggesting that α was restored to its control value during the recovery phase. In contrast, rising and falling phases of TMA+ curve recorded during the recovery phase remained similar to the TMA+ curve recorded during DL-AA treatment suggesting that λ elevation persisted in the recovery phase. Analysis of diffusion curves revealed that α measured in the recovery phase, 0.20 ± 0.02 (15), was significantly higher than 0.14 ± 0.01 (17) measured during 3 mM DL-AA treatment (Fig. 4B; p < 0.05, mixed linear model), while there was no statistically significant difference between α measured in the recovery phase and α = 0.22 ± 0.02 (26) measured under control conditions (Fig. 4B; p > 0.05, mixed linear model). In contrast, λ remained significantly elevated (p < 0.05, mixed linear model) at 1.73 ± 0.06 (17) during the recovery phase compared to a control value of λ (Fig. 4C).
The RTI method also quantifies a non-specific clearance parameter k′ (s−1) that represents the loss of TMA+ molecules from the ECS (Nicholson, 1992). Values of k′ were 0.013 ± 0.003 s−1 (26) under control conditions, 0.010 ± 0.003 s−1 (17) during 3 mM DL-AA treatment, and 0.007 ± 0.003 s−1 (17) in the recovery phase. The k′ values measured during 3 mM DL-AA treatment and in the recovery phase were significantly lower than the value of k′ under control conditions (p < 0.05, mixed linear model) while no significant difference was found between 3 mM DL-AA and recovery conditions (p > 0.05, mixed linear model).
Table 1 summarizes the values of α and λ obtained under control conditions, during 3 mM DL-AA treatment, and in the recovery phase. We found that both α and λ significantly change during astrocytic swelling induced by the DL-AA, but they behaved differently in the recovery phase. Volume fraction decreased during astrocytic swelling but it was restored to its control value during the recovery phase. In contrast, tortuosity increased during astrocytic swelling and it remained elevated during the recovery phase indicating that some of the effects of astrocytic swelling on ECS structure persist, leading to a compromised extracellular diffusion in the recovery phase.
Extracellular potassium level is not elevated during DL-AA treatment
Diffusion measurements were complemented by measurements of [K+] in the ECS during DL-AA application using potassium-selective microelectrodes. This experiment tested whether DL-AA that acts on a sodium-dependent glutamate transporter induced a buildup of extracellular glutamate causing a significant release of potassium that was shown to increase λ (Syková et al., 1999).
A representative time course of [K+]ECS measurement is shown in Fig. 5. After obtaining a baseline recording of [K+]ECS for 10 minutes, 3 mM DL-AA was added to the ACSF superfusing the slice and [K+]ECS was continuously recorded for 90 minutes. Immediately after DL-AA application, a transient small increase (< 1 mM) followed by a transient small undershoot (< 0.5 mM) were observed. By 30 minutes after DL-AA application when diffusion measurements are typically started, [K+]ECS stabilized at ~ 5mM. Ninety minutes after 3 mM DL-AA application, [K+]ECS was 5.52 ± 0.25 mM (3), which was not significantly different from the baseline obtained prior to DL-AA application (p > 0.05, Wilcoxon sign rank test).
Fig. 5.

Time course of [K+]ECS in the somatosensory neocortex during DL-AA application. A representative time course of [K+]ECS measured with K+-ISM under control conditions (10 min) and during 3 mM DL-AA application (90 min). A small transient increase in [K+]ECS was observed immediately after the application of 3 mM DL-AA followed by a transient undershoot and a stabilization. [K+]ECS was 5.37 mM at 90 minutes of DL-AA application.
DISCUSSION
In this study, we selectively swelled astrocytes in the somatosensory neocortex of rat brain slices with the gliotoxin DL-AA, and we quantified the ECS parameters using two independent diffusion methods. We found that λ increased while α decreased in the somatosensory neocortex treated with DL-AA. We also found that during recovery, α returned to the control value while λ remained significantly elevated. Gliotoxin DL-AA thus increased the ECS hindrance and, unexpectedly, it remained elevated even when astrocytes restored their volume during the recovery. Our study has important implications for therapeutic interventions in brain pathologies associated with the acute swelling of astrocytes. First, the extracellular transport of substances and drugs is impaired not only when astrocytes swell but it may remain impaired during the recovery. Second, therapeutic strategies need to target the underlying mechanism of increased hindrance, in addition to limiting the swelling of astrocytes. Possible mechanisms of increased extracellular hindrance are discussed in the following section.
Gliotoxin-induced increase in tortuosity is consistent with DS microdomain mechanism
We reported that λ measured with TMA+ increased while α decreased in rat somatosensory neocortex treated with gliotoxin DL-AA. While α was restored during the recovery, λ remained elevated. It is not surprising that the swelling of astrocytes would cause a reversible reduction of the ECS volume but how would swelling of astrocytes cause a lasting increase in λ? Two possible models are considered here: 1) the dead-space (DS) microdomains model and 2) the extracellular matrix (ECM) model (Fig. 6).
Fig. 6.

A schematic diagram of two models explaining an increase in tortuosity in the somatosensory neocortex during DL-AA application and during the recovery. See Discussion section for details.
In the DS microdomain model, a core assumption is that when the astrocytic processes swell, they not only get thicker but also elongate (Fig. 6A). Elongation of concave astrocytic processes would enlarge the DS microdomains. Diffusing molecules would spend more time in these enlarged DS microdomains during their transit through the ECS, and as a result λ would increase (Hrabe et al., 2004; Hrabetova et al., 2003). As the swelling is reversed during the recovery, the astrocytic processes would become thinner but their geometry would remain altered, preserving enlarged DS microdomains and increased λ. Taken together, the DS microdomain model predicts that λ increases and α decreases when DL-AA swells astrocytes, and during the recovery, λ remains elevated while α returns to a control value (Fig. 6A).
In the ECM model, a core assumption is that when astrocytic processes swell, they get thicker and compress ECM macromolecules (Fig. 6B). Here we also have to assume that the concentration of ECM macromolecules is substantial, and if it is the case, compressed matrix would increase the viscosity of the extracellular fluid. Diffusing molecules would move more slowly through the dense matrix, and as a result λ would increase (Rusakov and Kullmann, 1998). As the swelling is reversed during the recovery, the astrocytic processes would become thinner and the matrix would loosen, causing λ to return back to the control value. Taken together, the ECM model predicts that λ increases and α decreases when DL-AA swells astrocytes while during the recovery, both λ and α return to a control value (Fig 6B).
Considering our results, we argue that the DS microdomain model is consistent with our diffusion data obtained with the RTI method during DL-AA application as well as during the recovery. A sustained altered shape of astrocytic processes rather than just a simple volume enlargement can explain both why λ increased during gliotoxin application and why λ was not restored to a control value during the recovery. The altered astrocytic geometry preserves the elevated λ while shrinkage of astrocytic processes returns α to a control value during the recovery (Fig. 6A). The plausibility of our interpretation is supported by literature reporting changes in morphology of astrocytic processes in brain slices exposed to hypotonic stress (Chvátal et al., 2007).
The ECM model is consistent with our data obtained during DL-AA application (given that the concentration of ECM macromolecules is substantial under control conditions) but not during the recovery. The ECM model predicts that λ returns to a control value as α recovers. In this scenario, the compressed matrix would expand as the ECS volume recovers, resulting in a decrease in extracellular fluid viscosity and therefore a decrease in λ. Our data did not show this; instead we observed that λ continued to remain elevated during recovery (Fig. 4C).
Taken together, our study suggests that the elevated λ during acute astrocytic swelling induced by gliotoxin is likely due to the formation of DS microdomain. While a significant contribution of ECM to the elevated λ appears to be less likely, further experimental studies are needed to address long-standing questions about the quantity and the turnover of ECM in the ECS.
Size dependent effect of probe molecule on tortuosity
In this study, two probe molecules were used to quantify λ in the somatosensory neocortex of rat brain slices. The value of λ measured with f-dex (MW 3000) using the IOI method was higher than the value of λ measured with TMA+ (MW 74) using the RTI method. These results are in a good agreement with previous studies reporting increased hindrance for larger probe molecules in in vitro and in vivo preparations of rat and mouse brain and in an isolated turtle cerebellum (Hrabetova, 2005; Nicholson and Tao, 1993; Thorne and Nicholson, 2006; Xiao and Hrabetova, 2009; Xiao et al. 2008). This is likely due to a drag imposed on bigger probe molecules by the narrow passages of the ECS microenvironment. These passages may be the gaps between cellular membranes or the pores in the ECM (Nicholson and Tao, 1993; Thorne and Nicholson, 2006).
Previous studies also reported that λf-dex and λTMA differ more when the ECS hindrance is increased by experimental or pathological conditions associated with the ECS volume decrease such as hypotonic stress or ischemia (Hrabetova et al., 2003; Hrabetova and Nicholson, 2000; Kume-Kick et al., 2002; Tao, 1999). Here we found that the difference between λf-dex (1.74) and λTMA (1.63) under control conditions was enhanced (λf-dex = 2.39 ≫ λTMA = 1.71) during the 3 mM DL-AA treatment, as the ECS volume decreased and the ECS pores narrowed. As the ECS volume was restored and the ECS pores widened during the recovery, we saw a significant decrease in λf-dex (2.18).
Effects of DL-AA on astrocytes
Gliotoxin α-AA, a structural analog of glutamate (McBean, 1994), is a useful experimental tool because it selectively swells astrocytes. Huck and co-workers (1984a) found that DL-AA applied to cultured cerebellar cells induced a rapid cytoplasmic and nuclear swelling of astrocytes while no such effects were observed in neurons. Olney and co-workers (1971) reported transient morphological changes in astrocytes, but not neurons, of retinas injected with DL-AA. The mechanism of DL-AA induced gliotoxicity is not well understood. It has been shown that DL-AA was taken up by cultured astrocytes before inducing gliotoxicity (Huck et al., 1984b). McBean (1994) reported that DL-AA inhibits the sodium-dependent glutamate transporter as well as two enzymes participating in glutamate metabolism, glutamine synthetase and γ–glutamylcysteine synthetase. In our experiments, astrocytic swelling induced by DL-AA caused a reversible decrease in the ECS volume fraction in the somatosensory neocortex.
Wang and Hatton (2009) reported a reduced GFAP immunostaining in the supraoptic nucleus of hypothalamic slices treated with an L-enantiomer of α-Aminoadipic acid. Wang and Hatton (2009) proposed that the reduced GFAP immunostaining may reflect a depolymerization or a degradation of GFAP filaments associated with morphological changes of astrocytes. In agreement with their finding, we also observed a significant reduction in GFAP immunostaining in 3 mM DL-AA treated conditions suggestive of a change in astrocytic morphology.
Potassium mechanism does not contribute to gliotoxin-induced increase in tortuosity
Since DL-AA inhibits the sodium-dependent glutamate transporter (McBean, 1994), it is plausible that DL-AA may cause a buildup of glutamate in the ECS that would depolarize neurons and cause a massive K+ release into the ECS. It was reported previously (Syková et al., 1999) that application of 50 mM potassium to an isolated rat spinal cord evoked glial swelling and a significant increase in λ. Our measurements did not show any significant increase in [K+] ECS during 3 mM DL-AA treatment (Fig. 5), implying that DL-AA does not perturb K+ homeostasis and that K+ mechanism does not contribute to gliotoxin-induced changes in the ECS parameters.
DS microdomains and brain pathological states
Our RTI experiments showed that during gliotoxin treatment, λ rose from a control value of 1.63 to 1.71 and α decreased from a control value of 0.22 to 0.14. Similar changes in the ECS parameters were observed in various brain pathologies associated with cell swelling. Voříšek and Syková (1997) reported that λ increased to 2.0 while α decreased to 0.06 during ischemia in a rat neocortex in vivo. Hrabetova and Nicholson (2000) found that λ increased to 1.99 and α decreased to 0.12 in a rat neocortex thick-slice ischemia model. Kume-Kick and co-workers (2002) reported an increase in λ to 1.86 and a decrease in α to 0.12 during hypotonic stress in a rat neocortex in vitro.
The DS microdomain mechanism was shown to increase λ in ischemic conditions and during hypotonic stress in a rat neocortex (Hrabetova and Nicholson, 2000; Hrabetova et al. 2003). Astrocytic swelling is one of the hallmarks of these pathological conditions (Aschner et al., 1999). Our study suggests that the astrocytes swollen by a gliotoxin form DS microdomains. It is therefore plausible, that the elevation of λ in brain pathologies associated with cellular edema arises from DS microdomains formed by swollen astrocytic processes.
Conclusions
We found that the hindrance for the extracellular diffusion increases under conditions of acute astrocytic swelling. This increased hindrance persists into the recovery phase although the astrocytes restore their volume. Drastically compromised diffusion in the ECS augments brain dysfunction and hinders recovery by impacting the traffic of signaling molecules, ions, nutrients and metabolites. Our results have implications for the development of novel and effective treatment approaches for brain pathologies, particularly those associated with acute astrocytic swelling such as cerebral ischemia, traumatic brain injury, and hyponatremia. This is highly relevant for clinical care since traditionally treatment approaches for pathologies like cerebral ischemia have been mostly based on the neuronal mechanism of injury (Nedergaard et al, 2005). Our study indicates that extracellular extracellular diffusion can be improved by reducing astrocytic swelling and by disrupting DS microdomains formed by astrocytic processes.
Acknowledgments
The authors thank Dr. Susanna Popp for assistance with immunohistochemistry experiments. The authors are grateful to Prof. C. Nicholson and Dr. D. Lewis for critical reading of the manuscript. This work was supported by Post Doctoral Supplement award from the College of Medicine’s Research Investment Initiative Program SUNY Downstate Medical Center (FX) and the NIH NINDS grants R56 NS047557 and R01 NS047557 (SH). Matlab-based software for diffusion experiments (DEVIDA, IDA, WANDA, WALTER) used in this study was developed by Prof. L. Tao and Prof. C. Nicholson at NYU School of Medicine, and their work was supported by NIH NINDS grant R01 NS028642 to Prof. C. Nicholson.
References
- Alonso G. Proliferation of progenitor cells in the adult rat brain correlates with the presence of vimentin-expressing astrocytes. Glia. 2001;34:253–266. doi: 10.1002/glia.1059. [DOI] [PubMed] [Google Scholar]
- Aschner M, Allen JW, Kimelberg HK, LoPachin RM, Streit WJ. Glial cells in neurotoxicity development. Annu Rev Pharmacol Toxicol. 1999;39:151–173. doi: 10.1146/annurev.pharmtox.39.1.151. [DOI] [PubMed] [Google Scholar]
- Chvátal A, Anděrová H, Hock M, Prajerová I, Neprašová H, Chvátal V, Kirchhoff F, Syková E. Three-dimensional confocal morphometry reveals structural changes in astrocyte morphology in situ. J Neurosci Res. 2007;85:260–271. doi: 10.1002/jnr.21113. [DOI] [PubMed] [Google Scholar]
- Eliasson C, Sahlgren C, Berthold CH, Stakeberg J, Celis JE, Betsholtz C, Eriksson JE, Pekny M. Intermediate filament protein partnership in astrocytes. J Biol Chem. 1999;274:23996–24006. doi: 10.1074/jbc.274.34.23996. [DOI] [PubMed] [Google Scholar]
- El-Kareh AW, Braunstein SL, Secomb TW. Effect of cell arrangement and interstitial volume fraction on the diffusivity of monoclonal antibodies in tissue. Biophys J. 1993;64:1638–1646. doi: 10.1016/S0006-3495(93)81532-7. [DOI] [PMC free article] [PubMed] [Google Scholar]
- Fellows LK, Boutelle MG, Fillenz M. Extracellular brain glucose levels reflect local neuronal activity-a microdialysis study in awake, freely moving rat. J Neurochem. 1992;59:2141–2147. doi: 10.1111/j.1471-4159.1992.tb10105.x. [DOI] [PubMed] [Google Scholar]
- Fleming TM, Scott V, Naskar K, Joe N, Brown CH, Stern JE. State-dependent changes in astrocyte regulation of extrasynaptic NMDA receptor signaling in neurosecretory neurons. J Physiol. 2011;589:3929–3941. doi: 10.1113/jphysiol.2011.207340. [DOI] [PMC free article] [PubMed] [Google Scholar]
- Grosche J, Matyash V, Möller T, Verkhratsky A, Reichenbach A, Kettenmann H. Microdomains for neuron-glia interaction: parallel fiber signaling to Bergmann glial cells. Nat Neurosci. 1999;2:139–143. doi: 10.1038/5692. [DOI] [PubMed] [Google Scholar]
- Hrabe J, Hrabetova S, Segeth K. A model of effective diffusion and tortuosity in the extracellular space of the brain. Biophys J. 2004;87:1606–1617. doi: 10.1529/biophysj.103.039495. [DOI] [PMC free article] [PubMed] [Google Scholar]
- Hrabetova S. Extracellular diffusion is fast and isotropic in the stratum radiatum of hippocampal CA1 region in rat brain slices. Hippocampus. 2005;15:441–450. doi: 10.1002/hipo.20068. [DOI] [PubMed] [Google Scholar]
- Hrabetova S, Chen KC, Masri D, Nicholson C. Water compartmentalization and spread of ischemic injury in thick-slice ischemia model. J Cereb Blood Flow Metab. 2002;22:80–88. doi: 10.1097/00004647-200201000-00010. [DOI] [PubMed] [Google Scholar]
- Hrabetova S, Hrabe J, Nicholson C. Dead-space microdomains hinder extracellular diffusion in rat neocortex during ischemia. J Neurosci. 2003;23:8351–8359. doi: 10.1523/JNEUROSCI.23-23-08351.2003. [DOI] [PMC free article] [PubMed] [Google Scholar]
- Hrabetova S, Nicholson C. Dextran decreases extracellular tortuosity in thick–slice ischemia model. J Cereb Blood Flow Metab. 2000;20:1306–1310. doi: 10.1097/00004647-200009000-00005. [DOI] [PubMed] [Google Scholar]
- Hrabetova S, Nicholson C. Contribution of dead-space microdomains to tortuosity of brain extracellular space. Neurochem Int. 2004;45:467–477. doi: 10.1016/j.neuint.2003.11.011. [DOI] [PubMed] [Google Scholar]
- Hrabetova S, Nicholson C. Biophysical properties of brain extracellular space explored with ion-selective microelectrodes, integrative optical imaging and related techniques. In: Michael AC, Borland LM, editors. Electrochemical Methods for Neuroscience. Florida: CRC Press; 2007. pp. 167–204. [PubMed] [Google Scholar]
- Huck S, Grass F, Hatten ME. Gliotoxic effects of alpha-aminoadipic acid on monolayer cultures of dissociated postnatal mouse cerebellum. Neuroscience. 1984a;12:783–91. doi: 10.1016/0306-4522(84)90170-2. [DOI] [PubMed] [Google Scholar]
- Huck S, Grass F, Hörtnagl H. The glutamate analogue alpha-aminoadipic acid is taken up by astrocytes before exerting its gliotoxic effect in vitro. J Neurosci. 1984b;4:2650–2657. doi: 10.1523/JNEUROSCI.04-10-02650.1984. [DOI] [PMC free article] [PubMed] [Google Scholar]
- Kosaka T, Hama K. Three-dimensional structure of astrocytes in the rat dentate gyrus. J Comp Neurol. 1986;249:242–260. doi: 10.1002/cne.902490209. [DOI] [PubMed] [Google Scholar]
- Kume-Kick J, Mazel T, Voříšek I, Hrabetova S, Tao L, Nicholson C. Independence of extracellular tortuosity and volume fraction during osmotic challenge in rat neocortex. J Physiol (Lond) 2002;542:515–527. doi: 10.1113/jphysiol.2002.017541. [DOI] [PMC free article] [PubMed] [Google Scholar]
- McBean GJ. Inhibition of the glutamate transporter and glial enzymes in rat striatum by the gliotoxin, alpha aminoadipate. Br J Pharmacol. 1994;113:536–540. doi: 10.1111/j.1476-5381.1994.tb17022.x. [DOI] [PMC free article] [PubMed] [Google Scholar]
- Nedergaard M, Dirnagl U. Role of glial cells in cerebral ischemia. Glia. 2005;50:281–286. doi: 10.1002/glia.20205. [DOI] [PubMed] [Google Scholar]
- Nicholson C. Brain cell microenvironment as a communication channel. In: Schmitt FO, Worden FG, editors. The Neurosciences Fourth Study Program. Cambridge: MIT Press; 1979. pp. 457–476. [Google Scholar]
- Nicholson C. Quantitative analysis of extracellular space using the method of TMA+ iontophoresis and the issue of TMA+ uptake. J Physiol Pharmacol (Can) 1992;70:S314–S322. doi: 10.1139/y92-278. [DOI] [PubMed] [Google Scholar]
- Nicholson C. Ion-selective microelectrodes and diffusion measurements as tools to explore the brain cell microenvironment. J Neurosci Methods. 1993;48:199–213. doi: 10.1016/0165-0270(93)90092-6. [DOI] [PubMed] [Google Scholar]
- Nicholson C. Diffusion and related transport mechanisms in brain tissue. Rep Prog Phys. 2001;64:815–884. [Google Scholar]
- Nicholson C, Kamali-Zare P, Tao L. Brain extracellular space as a diffusion barrier. Comput Visual Sci. 2011;14:309–325. doi: 10.1007/s00791-012-0185-9. [DOI] [PMC free article] [PubMed] [Google Scholar]
- Nicholson C, Phillips JM. Ion diffusion modified by tortuosity and volume fraction in the extracellular microenvironment of the rat cerebellum. J Physiol (Lond) 1981;321:225–257. doi: 10.1113/jphysiol.1981.sp013981. [DOI] [PMC free article] [PubMed] [Google Scholar]
- Nicholson C, Tao L. Hindred diffusion of high molecular weight compounds in brain extracellular microenvironment measured with integrative optical imaging. Biophys J. 1993;65:2277–2290. doi: 10.1016/S0006-3495(93)81324-9. [DOI] [PMC free article] [PubMed] [Google Scholar]
- Olney JW, Ho OL, Rhee V. Cytotoxic effects of acidic and sulphur containing amino acids on the infant mouse central nervous system. Exp Brain Res. 1971;14:61–76. doi: 10.1007/BF00234911. [DOI] [PubMed] [Google Scholar]
- Pérez-Pinzón MA, Tao L, Nicholson C. Extracellular potassium, volume fraction, and tortuosity in rat hippocampal CA1, CA3, and cortical slices during ischemia. J Neurophysiol. 1995;74:565–573. doi: 10.1152/jn.1995.74.2.565. [DOI] [PubMed] [Google Scholar]
- Piet R, Vargová L, Syková E, Poulain DA, Oliet SH. Physiological contribution of the astrocytic environment of neurons to intersynaptic crosstalk. Proc Natl Acad Sci USA. 2004;101:2151–2155. doi: 10.1073/pnas.0308408100. [DOI] [PMC free article] [PubMed] [Google Scholar]
- Rusakov DA, Kullmann DM. Geometeric and viscous components of the tortuosity of the extracellular space in the brain. Proc Natl Acad Sci USA. 1998;95:8975–8980. doi: 10.1073/pnas.95.15.8975. [DOI] [PMC free article] [PubMed] [Google Scholar]
- Špaček J. Three-dimensional analysis of dendritic spines. Anat Embryol (Berl) 1985;171:245–252. doi: 10.1007/BF00341419. [DOI] [PubMed] [Google Scholar]
- Syková E, Svoboda J, Polák J, Chvátal A. Extracellular volume fraction and diffusion characteristics during progressive ischemia and terminal anoxia in the spinal cord of the rat. J Cereb Blood Flow Metab. 1994;14:301–311. doi: 10.1038/jcbfm.1994.37. [DOI] [PubMed] [Google Scholar]
- Syková E, Vargová L, Prokopová S, Šimonová Z. Glial swelling and astrogliosis produce diffusion barriers in the rat spinal cord. Glia. 1999;25:56–70. doi: 10.1002/(sici)1098-1136(19990101)25:1<56::aid-glia6>3.0.co;2-4. [DOI] [PubMed] [Google Scholar]
- Tao L. Effects of osmotic stress on dextran diffusion in rat neocortex studied with integrative optical imaging. J Neurophysiol. 1999;81:2501–2507. doi: 10.1152/jn.1999.81.5.2501. [DOI] [PubMed] [Google Scholar]
- Tao L, Nicholson C. The three-dimensional point spread functions of a microscope objective in image and object space. J Microsc. 1995;178:267–271. doi: 10.1111/j.1365-2818.1995.tb03604.x. [DOI] [PubMed] [Google Scholar]
- Tao L, Nicholson C. Maximum geometrical hindrance to diffusion in brain extracellular space surrounding uniformly spaced convex cells. J Theor Biol. 2004;229:59–68. doi: 10.1016/j.jtbi.2004.03.003. [DOI] [PubMed] [Google Scholar]
- Thorne RG, Nicholson C. In vivo diffusion analysis with quantum dots and dextrans predicts the width of brain extracellular space. Proc Natl Acad Sci USA. 2006;103:5567–5572. doi: 10.1073/pnas.0509425103. [DOI] [PMC free article] [PubMed] [Google Scholar]
- Ulbrich K, Pechar M, Strohalm J, Subr V, Rihova B. Synthesis of biodegradable polymers for controlled drug release. Ann NY Acad Sci. 1997;831:47–56. doi: 10.1111/j.1749-6632.1997.tb52183.x. [DOI] [PubMed] [Google Scholar]
- Voříšek I, Syková E. Ischemia-induced changes in the extracellular space diffusion parameters, K+, pH in the developing rat cortex and corpus callosum. J Cereb Blood Flow Metab. 1997;17:191–203. doi: 10.1097/00004647-199702000-00009. [DOI] [PubMed] [Google Scholar]
- Wang YF, Hatton GI. Astrocytic plasticity and patterned oxytocin neuronal activity: dynamic interactions. J Neurosci. 2009;29:1743–1754. doi: 10.1523/JNEUROSCI.4669-08.2009. [DOI] [PMC free article] [PubMed] [Google Scholar]
- Weinstein DE, Shelanski ML, Liem RKH. Suppression by antisense mRNA demonstrates a requirement for the glial fibrillary acidic protein in the formation of stable astrocytic processes in response to neurons. J Cell Biol. 1991;112:1205–1213. doi: 10.1083/jcb.112.6.1205. [DOI] [PMC free article] [PubMed] [Google Scholar]
- Xiao F, Hrabetova S. Enlarged extracellular space of aquaporin-4-deficient mice does not enhance diffusion of Alexa Fluor 488 or dextran polymers. Neuroscience. 2009;161:39–45. doi: 10.1016/j.neuroscience.2009.03.017. [DOI] [PMC free article] [PubMed] [Google Scholar]
- Xiao F, Nicholson C, Hrabe J, Hrabetova S. Diffusion of flexible random-coil dextran polymers measured in anisotropic brain extracellular space by Integrative Optical Imaging. Biophys J. 2008;95:1382–1392. doi: 10.1529/biophysj.107.124743. [DOI] [PMC free article] [PubMed] [Google Scholar]