Abstract
The aims of this study were to determine whether combining features of a western lifestyle in mice with trans fats in a high-fat diet, high-fructose corn syrup in the water, and interventions designed to promote sedentary behavior would cause the hepatic histopathological and metabolic abnormalities that characterize nonalcoholic steatohepatitis (NASH). Male C57BL/6 mice fed ad libitum high-fat chow containing trans fats (partially hydrogenated vegetable oil) and relevant amounts of a high-fructose corn syrup (HFCS) equivalent for 1–16 wk were compared with mice fed standard chow or mice with trans fats or HFCS omitted. Cage racks were removed from western diet mice to promote sedentary behavior. By 16 wk, trans fat-fed mice became obese and developed severe hepatic steatosis with associated necroinflammatory changes. Plasma alanine aminotransferase levels increased, as did liver TNF-α and procollagen mRNA, indicating an inflammatory and profibrogenic response to injury. Glucose intolerance and impaired fasting glucose developed within 2 and 4 wk, respectively. Plasma insulin, resistin, and leptin levels increased in a profile similar to that seen in patients with NASH. The individual components of this diet contributed to the phenotype independently; isocaloric replacement of trans fats with lard established that trans fats played a major role in promoting hepatic steatosis and injury, whereas inclusion of HFCS promoted food consumption, obesity, and impaired insulin sensitivity. Combining risk factors for the metabolic syndrome by feeding mice trans fats and HFCS induced histological features of NASH in the context of a metabolic profile similar to patients with this disease. Because dietary trans fats promoted liver steatosis and injury, their role in the epidemic of NASH needs further evaluation.
Keywords: nonalcoholic steatohepatitis, insulin resistance, obesity
the prevalence of obesity in the United States is rising, and with it the frequency of fatty liver disease, nonalcoholic steatohepatitis (NASH), and type 2 diabetes mellitus. Large-cohort studies indicate that up to 30% of adults and 13% of children have excessive hepatic steatosis (>5% fat), while NASH is present in ∼3% of adults. NASH is a necroinflammatory disease that can progress to cirrhosis, with subsequent liver failure and an increased risk of hepatocellular carcinoma. To gain insights into the pathogenesis of NASH and develop effective therapy, animal models have been developed that typically rely on genetic manipulation (e.g., ob/ob mouse), toxic injury [e.g., methionine- and choline-deficient (MCD) diet], or dietary extremes (e.g., abnormally high-fat or high-fructose diets) (3), none of which fully reflects the characteristics of the American fast-food diet. Although some of the histological changes that develop in these models exhibit features of human nonalcoholic fatty liver disease (NAFLD), the underlying pathogenesis of fat accumulation and consequent cellular injury may not reflect the mechanisms of human disease. For example, the frequently used MCD diet model induces many histological abnormalities described as similar to human NASH, but the model is not associated with insulin resistance, and rodents treated with this diet typically lose, rather than gain, weight (23, 32). Although much has been learned from this model, its relevance to human NASH has been questioned (3). The hyperphagic leptin-deficient ob/ob mouse develops fatty liver and has provided important insights into the pathogenesis of NAFLD, but leptin plays an important role in regulating inflammation and fibrosis, and its absence may compromise the ultimate utility of this as an appropriate model for identifying effective therapy. The fact that leptin deficiency is a rare human disorder raises additional questions about the relevance of this model to human disease. Similarly, models that utilize dietary extremes, such as 60% of calories from fat or 60% of calories from fructose, do not reflect commonly encountered dietary habits, and such dietary models typically focus on just one dietary component without including the recognized sedentary behaviors that may be common in patients with NASH (4, 26, 29). None of the models developed to date has included trans fats. Little is known about the role of trans fats in promoting liver injury in the setting of NASH, yet the consumption of trans fats has escalated in parallel with the epidemic of fatty liver disease. Because consumption of trans fats has been associated with an increased risk of developing insulin resistance (17), this relatively recent dietary aberration could be playing a role in the expanding number of NASH patients being identified.
We sought to develop and characterize a mouse model of NASH based on the nutritional makeup of commonly consumed fast food, using non-genetically altered mice kept in conditions designed to promote sedentary behavior. We hypothesized that combining dietary and lifestyle risk factors for NASH would lead to significant liver pathology, and we designed experiments that would allow us to identify the relative contributions of each component of the diet to the development of obesity and liver disease. Our results indicate that mice kept in cages without wire racks and fed ad libitum a high-fat chow that included trans fats and relevant amounts of high-fructose corn syrup (HFCS) in their drinking water became obese and developed reduced glucose tolerance, hyperinsulinemia, and substantial hepatic steatosis associated with a necroinflammatory and profibrogenic response. While fructose contributed to the development of obesity, the consumption of trans fats contributed substantially to the development of hepatic steatosis and injury. Because the diet was similar to commonly consumed fast food and the mice were kept in conditions designed to promote sedentary behavior, this model was termed the American Lifestyle-Induced Obesity Syndrome (ALIOS) model.
MATERIALS AND METHODS
Animal treatment.
Male C57BL/6 mice ∼5 or 6 wk old (Harlan, Indianapolis, IN) were handled and cared for in accordance with a protocol approved by the Animal Care Committee of Saint Louis University. This strain was chosen because of its predisposition to developing insulin resistance (2, 14, 18) and the availability of genetically manipulated mice on this background for future studies. Mice were kept on a 12:12-h light-dark schedule at 23°C, housed in cages of five, and weighed weekly.
ALIOS mice were fed a diet similar in composition to an American fast-food diet, with 45% calories in the chow from fat and 30% of the fat in the form of partially hydrogenated vegetable oil [28% saturated, 57% monounsaturated fatty acids (MUFA), 13% polyunsaturated fatty acids (PUFA); trans fat custom diet TD06303, Harlan Teklad, Madison, WI]. Control mice were fed standard rodent chow containing 13.6% of calories from fat in the form of soybean oil (15% saturated, 23% MUFA, 61% PUFA; 2018S, Harlan Teklad). ALIOS mice were also given HFCS equivalent (55% fructose, 45% glucose by weight) in drinking water at a concentration of 42 g/l. The drinking water was provided as gel-water [93% water, 2.8% gelatin (pork skin gelatin, type A, Sigma, St. Louis, MO) and 4.2% HFCS] in dishes on the cage floor. This allowed removal of cage racks in order to discourage physical activity in the ALIOS mice. Control mice fed standard chow were kept in cages with wire racks and given gel-water without HFCS. Food and water consumption was measured by weighing new and remaining food and water three times weekly.
A total of 50 mice were treated with ALIOS conditions and compared with 40 mice treated with control conditions; groups of 8–10 mice from each treatment group were killed at time points from 1 wk to 16 wk of treatment, except that control mice were not killed at 2 wk. Mice were killed by carbon dioxide inhalation at 1, 2, 4, and 8 wk. Because of stress-induced metabolic changes observed with carbon dioxide inhalation, mice treated for 16 wk were killed after ketamine and xylazine anesthesia.
To examine the roles of individual components of the ALIOS diet, groups of 5-wk-old mice (n = 10/group) treated for 16 wk were kept in cages without wire racks and studied by omitting single components of the diet: one group was fed the regular ALIOS diet; a second group had trans fats omitted and was instead fed chow containing 45% of calories as lard (39% saturated, 50% MUFA, 11% PUFA) along with HFCS; a third group had HFCS omitted and was given control gel-water along with the trans fat chow. A group fed standard chow but without cage racks was not included to examine the role of this intervention.
Plasma prepared with EDTA was separated and frozen at −80°C. Livers were removed, weighed, and divided into sections that were fixed in phosphate-buffered formalin (Sigma Aldrich, St. Louis, MO), frozen in liquid nitrogen, or submersed in RNA stabilization solution (RNAlater, Ambion, Austin, TX).
Glucose tolerance test and insulin resistance.
Glucose tolerance testing (GTT) was performed in mice fasted for 8–12 h by measuring tail vein glucose levels after intraperitoneal administration of glucose (1 mg/kg) as a sterile 20% solution with a 27-gauge insulin syringe (20). Glucose levels were measured by tail vein sampling with a portable glucometer (Freestyle Flash, Abbott Laboratories, Abbott Park, IL) at 0, 20, 40, 60, and 150 min. The area under the curve (AUC) for the GTT was calculated by the trapezoidal method. After a 6-h fast, insulin tolerance testing was performed by injecting intraperitoneally 0.6 U/kg human regular insulin (Novalin, Abbott Laboratories) at a concentration of 0.2 U/ml with a 27-gauge insulin syringe. Glucose was measured as described above at 0, 20, 40, and 60 min. As an additional estimate of insulin resistance, the quantitative insulin sensitivity check index (QUICKI) of ALIOS and control mice was calculated [1/log(glucose × insulin)] with the fasting values (21).
Chemistry.
Plasma alanine aminotransferase (ALT), aspartate aminotransferase (AST), cholesterol, and triglycerides were measured with a calibrated clinical analyzer (Cobas Mira Plus Chemistry Analyzer, Roche Diagnostics, Indianapolis, IN). Plasma insulin and adipokines were measured by multiplexed immunoassay (Linco Diagnostics, St. Charles, MO), and adiponectin was measured by radioimmunoassay (Linco Diagnostics). Liver triglyceride content was measured by a glycerol phosphate oxidase method after enzymatic lipolysis (GPO reagent set, Pointe Scientific, Lincoln Park, MI). Tissue was prepared for the assay by first agitating 50 mg of previously frozen liver in 1 ml of a buffer containing 0.25 M sucrose, 2 mM EDTA, and 10 mM Tris, pH 7.4 in a glass vial with a 3-mm steel bead at room temperature for 2 h. The samples were taken through two freeze-thaw cycles and aspirated three times through a 25-gauge needle.
RNA analysis.
To isolate total RNA, tissue was homogenized within 48 h of death in a phenol-guanidine-isothiocyanate reagent (TRIzol, Life Technologies, Grand Island, NY), extracted with phenol-chloroform-isoamyl alcohol (25:24:1), precipitated with isopropyl alcohol, and washed with ethanol. The concentration of RNA was measured by microspectrophotometry (NanoDrop Technologies, Wilmington, DE). Tumor necrosis factor (TNF)-α and procollagen α1I (PCA) mRNA were measured and normalized to 18S RNA by real-time RT-PCR (MyiQ, Bio-Rad, Hercules, CA) using SYBR Green. The primer sequences used were PCA forward: gctcctcttaggggccact, PCA reverse: ccccaatggtgagacgtgg; TNF-α forward: ccctcacactcagatcatcttct, TNF-α reverse: ctgtagcccacgtcgtagc; and 18S forward: tcgaggccctgtaattggaa, 18S reverse: ggtaattccagctccaatagcg.
Pathology.
Formalin-fixed portions of livers were paraffin-embedded and sectioned (5 μm). Stains evaluated were hematoxylin and eosin to examine morphological features, Sirius red, and Masson's trichrome to assess fibrosis.
Statistical analysis.
Paired data were analyzed for statistical significance with t-tests, with significance being P < 0.05. Comparisons among groups were performed with one-way ANOVA followed by post hoc pairwise multiple-comparison procedures (Holm-Sidak method) to identify significant differences between groups (P < 0.05) with SigmaPlot 9.0 (Systat, Chicago, IL).
RESULTS
Experimental groups gained weight quickly; by 1 wk the ALIOS mice had already gained 4.3% more weight than the control mice (P < 0.01). By 8 wk the accelerated weight gain of the ALIOS mice began to slow, and subsequent weight gain paralleled that of the control mice (Fig. 1). At 16 wk ALIOS mice weighed 42% more than control mice and 10% more than those without HFCS (P < 0.05); omission of trans fats from the high-fat diet did not significantly alter the weight gain compared with ALIOS mice (Table 1).
Fig. 1.
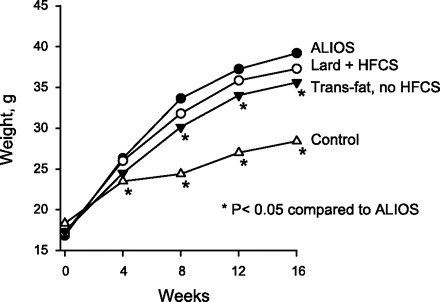
Mean weights of male C57BL/6 mice kept in cages without wire racks and fed high-trans fat chow and high-fructose corn syrup (HFCS) equivalent in amounts relevant to frequent consumers of fast food for 16 wk [American Lifestyle-Induced Obesity Syndrome (ALIOS) model]. ALIOS mice gained weight at a faster rate than control mice fed standard rodent chow and water and allowed unrestricted activity. The difference between the ALIOS and control groups was significant at all time points by the 1st week of treatment (P < 0.01). Mice kept under conditions identical to the ALIOS mice except for being fed chow containing lard instead of trans fats (Lard + HFCS) exhibited weight gain similar to the ALIOS mice. Mice kept under conditions identical to those of ALIOS mice except that they were not given HFCS weighed less than ALIOS mice by week 8.
Table 1.
Contribution of trans fats and high-fructose corn syrup to morphological, biochemical, and histological abnormalities of the ALIOS model at 16 wk
| Control | ALIOS | ALIOS Minus Trans Fats | ALIOS Minus HFCS | |
|---|---|---|---|---|
| Weight, g | 27.7±2.9a | 39.2±2.5b | 37.3±2.6b,c | 35.6±3.4c |
| Liver weight, g | 0.91±0.08a | 1.67±0.23b | 1.19±0.09c | 1.41±0.29d |
| Liver triglyceride, mg/g | 43±9a | 123±72b | 69±25a,b | 100±53b |
| ALT, U/l | 31±6a | 83±34b | 41±15a | 83±32b |
| Plasma cholesterol, mg/dl | 80±6a | 143±12b | 136±19b | 138±21b |
| Plasma triglycerides | 59±8a | 70±12a | 106±14b | 66±17a |
| GTT AUC | 2,098±632a | 1,876±234a | 1,709±461a | |
| GTT glucose at 80 min, mM | 15.2±4.1a | 14.9±3.6a | 11.2±1.8b |
Variance statistic is SD. Glucose tolerance testing (GTT) was not performed on control mice at the same time as the other 3 treatment groups. ALIOS, American Lifestyle-Induced Obesity Syndrome; HFCS, high-fructose corn syrup; ALT, alanine aminotransferase; AUC, area under the curve. Superscript letters denote significant differences among the treatment groups (i.e., there is no difference among values annotated with the same letter), P < 0.05 by ANOVA.
Food and water consumption were measured from week 10 to week 16 in all groups. ALIOS mice consumed the same amount of food by weight as control mice, but because of the higher caloric density of the high-fat chow, the daily caloric consumption per mouse was 30% greater than that of control mice (Table 2). Water consumption was equal in all groups, indicating that there was neither a preference for nor an aversion to the HFCS water. The amount of fructose consumed by the ALIOS mice was the equivalent of a 70-kg person consuming about eight cans of HFCS-sweetened soda daily, a relevant amount for some individuals. The HFCS gel-water contained 0.28 kcal/ml from both carbohydrate and protein, whereas control gel-water contained 0.112 kcal/ml from protein; the average consumption was 3.9 ml/day. The presence of HFCS in the diet of ALIOS mice contributed 5.7% of their caloric intake, thus accounting for only 24% of their excess caloric consumption compared with control mice. The role of HFCS in causing increased solid chow consumption was confirmed when HFCS was omitted from the ALIOS conditions (Fig. 2). ALIOS mice ate 8.2% more calories from solid chow and 13.7% more total calories than mice with HFCS omitted from the ALIOS diet (P < 0.05, Table 2). The mice fed lard as an isocaloric replacement for trans fats had the same caloric consumption as the ALIOS mice, indicating that, unlike inclusion of HFCS in the diet, the presence of trans fats did not alter food intake (Table 2). The ALIOS mice consumed 10 g/kg of trans fat per day, which is an ∼20-fold higher amount than a person eating five servings of common snack foods (39).
Table 2.
Energy and food component consumption
| Control | ALIOS | ALIOS Minus Trans Fats | ALIOS Minus HFCS | |
|---|---|---|---|---|
| Total kcal/day | 8.9±0.7a | 11.6±1.1b | 12.0±1.1b | 10.2±1.0a |
| Food kcal/day | 8.4±0.7a | 10.5±1.1b | 10.9±1.1b | 9.7±1.0c |
| Gel-water kcal/day | 0.49±0.05a | 1.10±0.18b | 1.13±0.15b | 0.43±0.09a |
Variance statistic is SD. Superscript letters denote significant differences among the treatment groups (i.e., there is no difference among values annotated with the same letter), P < 0.05 by ANOVA.
Fig. 2.
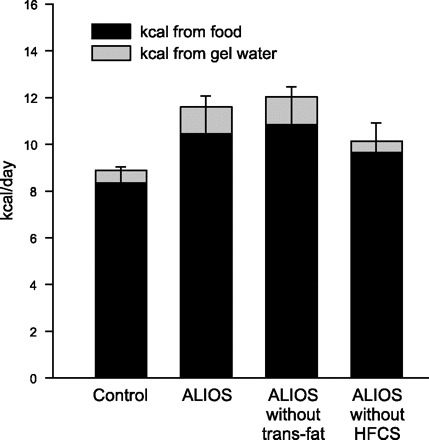
Food and gel-water consumption expressed in terms of daily energy provided. The presence of HFCS in the gel-water was associated with an 8.2% increase in chow consumption compared with ALIOS mice not given HFCS (P < 0.05). Caloric intake was similar when trans fats were replaced by lard, indicating that fat substitution did not alter eating behavior. The number of calories provided by the gel-water is shown in the gray stacked bar and demonstrates the relative proportion of calories consumed compared with chow. The calories provided by gel-water not containing HFCS were derived from the collagen used to make the gel-water. Error bars denote SD for calories derived from chow. Significance of differences among groups is shown in Table 2.
Histological examination of livers from ALIOS mice demonstrated the progressive development of substantial steatosis with necroinflammatory changes. Small fat droplets were present in zone 1 hepatocytes at 1 wk (Fig. 3), but these did not fill the cytoplasm. The amount of fat and size of the droplets increased in zone 1 hepatocytes over time such that by 8 wk predominant macrovesicular steatosis filled the periportal zone 1 hepatocytes (Fig. 4). Also by 8 wk, but not at earlier time points examined, small-droplet fat accrued in perivenous zone 3 hepatocytes, and this was more pronounced at 16 wk. At 16 wk the entire cytoplasm of most hepatocytes was distorted by steatosis, and a distinct demarcation of zone 1 and 2 macrovesicular steatosis from zone 3 true microvesicular steatosis was present. Replacing trans fats with lard resulted in a markedly different distribution of steatosis, with macrovesicular steatosis in zone 2 but near-complete sparing of zones 1 and 3 at 16 wk (Fig. 4, E and F). Omission of HFCS from the diet resulted in no difference in the scoring of the extensive accumulation of steatosis and its distribution compared with ALIOS mice (not shown), although total liver triglyceride content trended to be less with the omission of HFCS (Table 1). Interestingly, in many ALIOS mice at the various time points examined, the histological findings were most pronounced in the peripheral portions of the liver parenchyma, whereas the deeper regions had relative “sparing.” In the 16-wk ALIOS mice, some lacked zone 3 microvesicular steatosis and had only zone 1 macrosteatosis in the deeper regions but with the complete findings described above peripherally. Inflammatory foci were scattered across the lobule, and no portal inflammation was seen. Some cytoplasm alterations and clumping suggestive of “ballooning” and possible Mallory hyaline were noted in zone 3. No fibrosis was seen at any time point by Masson's trichrome, Sirius red, or α-smooth muscle actin immunohistochemistry by 16 wk (not shown).
Fig. 3.
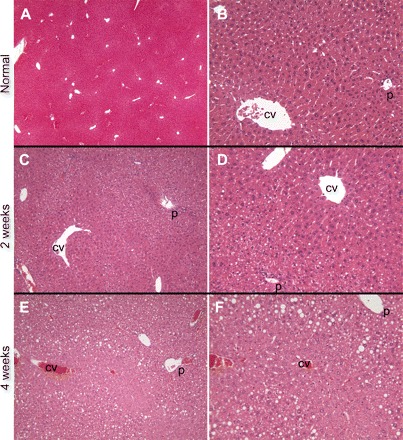
Livers from control mice fed standard rodent chow demonstrated no evidence of steatosis at any time point (A and B, ×4 and ×20 images, respectively, from 16-wk mice). ALIOS mice at 1 wk had a few hepatocytes with areas of cytoplasmic clearing suggestive of steatosis that was accentuated in zone 1; on higher power some of these could be identified as fat droplets (not shown). At 2 wk, zone 1 small-droplet steatosis was more apparent, and there was continued sparing of zone 3 (C and D, ×10 and ×20, respectively). At 4 wk, larger fat droplets (macrovesicular steatosis) could be appreciated in zone 1 but zone 3 remained uninvolved (E and F, ×10 and ×20, respectively). Hematoxylin and eosin-stained sections. P, portal tract; CV, central vein.
Fig. 4.
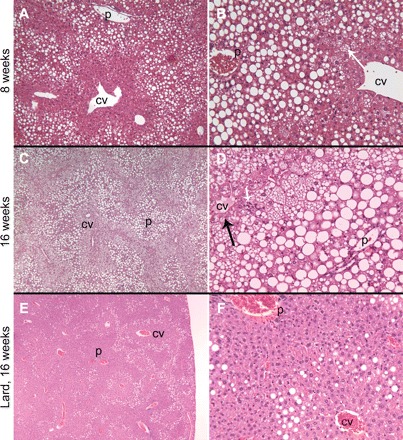
At 8 wk, zone 1 hepatocytes were markedly expanded by macrovesicular steatosis. A distinct border between zone 1 and uninvolved zone 3 was created by hepatocytes with tiny-droplet (microvesicular, arrow) steatosis (A and B, ×10 and ×20, respectively). At 16 wk, zone 1 remained expanded with macrovesicular steatosis while the foamy, microvesicular steatosis expanded to involve all of zones 2 and 3 except a 1-cell layer rim of perivenular hepatocytes (C and D, ×4 and ×20, respectively, arrow). Scattered parenchymal foci of mixed inflammation were seen with increasing time of exposure to ALIOS conditions (arrowhead, D). Sedentary mice treated for 16 wk with lard and HFCS instead of trans fats and HFCS had substantially less steatosis. In the lard-fed mice, steatosis was macrovesicular and present in a distinctly midzonal (zone 2) pattern. None of the tiny-droplet (microvesicular) steatosis was present (E and F, ×4 and ×20, respectively). Hematoxylin and eosin-stained sections. P, portal tract; CV, central vein.
Confirming the histological impressions, the weights of the livers of ALIOS mice progressively increased from 4 wk to 16 wk (Fig. 5A) and liver triglyceride content determined biochemically also increased progressively (Fig. 5B). The weights of the ALIOS livers were significantly higher compared with mice without trans fats or HFCS (Table 1). Similarly, the liver triglyceride content was elevated threefold in ALIOS mice and elevated twofold in mice fed lard instead of trans fats (Table 1).
Fig. 5.
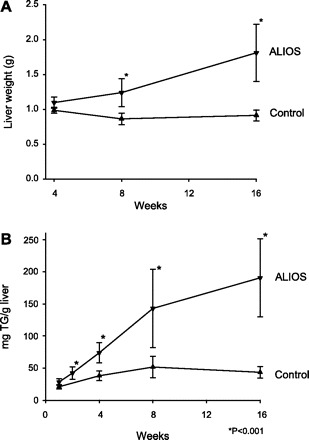
A: liver weight progressively increased in ALIOS mice from 11% above control at 4 wk to double the weight of control livers at 16 wk. B: liver triglyceride (TG) content progressively increased in ALIOS mice. Week 2 ALIOS liver TG content was greater than week 1 control liver TG content. TG content of ALIOS livers was >4-fold higher than control mice by week 16. Error bars denote SD, n = 8–10 mice/group.
Plasma ALT and AST levels progressively increased in ALIOS mice compared with control mice (Fig. 6). AST in the mouse has a high basal level, possibly originating from nonhepatic sources, and the proportional increase over time was less than the increase seen in ALT. Mice fed lard instead of trans fats had nearly normal ALT levels, indicating that the inclusion of trans fats in the diet could play a role in hepatocellular injury in NASH (Table 1). Omission of HFCS had no effect on the ALT elevation in ALIOS mice (Table 1).
Fig. 6.
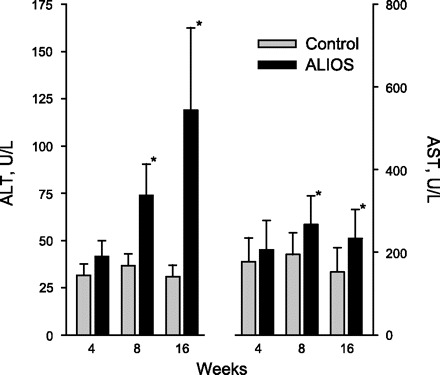
Plasma alanine aminotransferase (ALT) was substantially elevated at 8 wk and further increased at 16 wk. Aspartate aminotransferase (AST) was also elevated above a relatively high baseline. Error bars denote SD; n = 8–10 mice/group. *P < 0.01.
Although hypercholesterolemia is unusual in rodents not fed a cholesterol-enriched diet, in ALIOS mice plasma cholesterol levels were significantly increased by 42% and 65% at 8 and 16 wk, respectively, compared with control mice (Fig. 7). Omission of trans fats or HFCS had no effect on the elevated cholesterol levels (Table 1). Plasma triglyceride levels were unchanged in ALIOS mice compared with control mice (Fig. 7). However, in the lard-fed mice, plasma triglyceride levels were significantly elevated (52%) compared with ALIOS and control mice (Table 1), indicating that while consuming dietary trans fats contributes to fat accumulation in the liver, it is not associated with hypertriglyceridemia in this model.
Fig. 7.
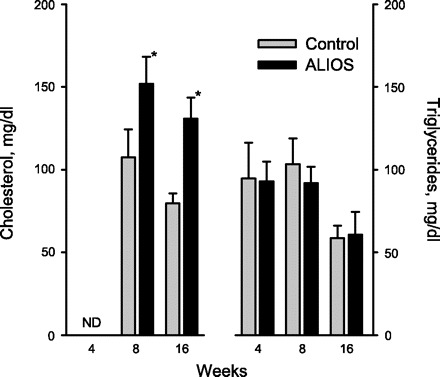
Plasma cholesterol levels were significantly elevated at 8 and 16 wk, whereas triglyceride levels remained unchanged. The differences between the groups killed at 16 wk compared with earlier time points may be related to the different techniques used to kill animals at these time points (see materials and methods). Error bars denote SD; n = 8–10 mice/group; *P < 0.01. ND, not done.
To determine whether the obesity and hepatic steatosis that developed in ALIOS mice were associated with reduced glucose tolerance, multiple GTTs were performed over 15 wk. Glucose tolerance was reduced within 2 wk, and by 4 wk the fasting glucose levels in ALIOS mice were also significantly higher than in control mice. Shown in Fig. 8A are the results of a typical GTT demonstrating elevated fasting glucose levels and substantially higher levels than normal following a glucose challenge. Plotting the GTT AUC as a function of duration on diet demonstrates that glucose tolerance was reduced early in the course of treatment and remained at this level throughout the treatment period (Fig. 8B) despite progressively worsening hepatic steatosis. A GTT performed at 14 wk on the mice with dietary components omitted showed better glucose tolerance in the mice lacking HFCS, suggesting that HFCS contributes to the impaired glucose tolerance in ALIOS mice (Table 1). Although the areas under the glucose curves were not significantly different (Table 1), there was significant divergence midway through the 150-min measurement period, when the mean plasma glucose was significantly higher in ALIOS mice compared with ALIOS minus HFCS (P < 0.05 at 80 min; Table 1). Insulin tolerance testing at 13 wk confirmed the effect of HFCS on insulin sensitivity. Omission of HFCS from the ALIOS conditions was associated with improved insulin sensitivity (Fig. 9), whereas isocalorically replacing trans fats with lard had an intermediate statistically nonsignificant effect (not shown).
Fig. 8.
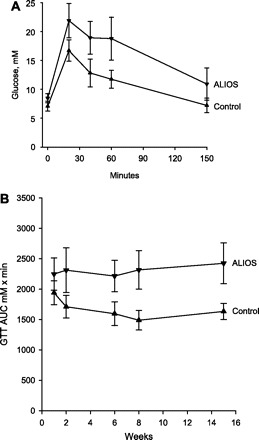
A: glucose tolerance test (GTT) after 15 wk of ALIOS conditions. Mice received 1 mg/kg glucose by intraperitoneal injection at time 0. Blood glucose was greater in ALIOS mice compared with control mice at all time points, including fasting glucose levels (P < 0.01). B: GTTs were performed at multiple time points, and the areas under the curves (AUCs) are shown as a function of duration of treatment. Reduced glucose tolerance was noted within 2 wk of treatment, and impaired fasting glucose was evident by 6 wk. GTT AUC was greater in ALIOS mice compared with control mice at all time points measured (P < 0.01). Error bars denote SD; n = 10 mice/group.
Fig. 9.
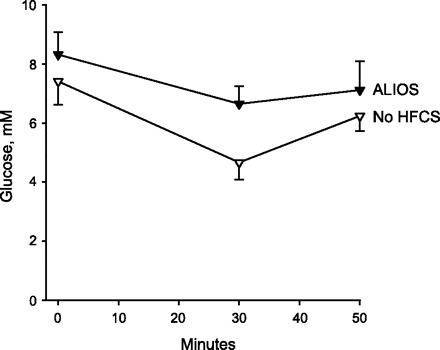
Insulin tolerance in ALIOS mice compared with ALIOS mice with HFCS omitted from the water. Mice received 0.6 U/kg insulin by intraperitoneal injection, and blood glucose was measured at 0, 30, and 50 min. Omission of HFCS resulted in both improved fasting glucose levels (time 0) and improved response to insulin at 30 and 50 min (P < 0.01 at all time points).
Hyperinsulinemia is a compensatory mechanism for insulin resistance. At 8 wk, ALIOS mice had marked hyperinsulinemia compared with control mice (Table 3). Additionally, leptin and resistin were also elevated at 8 wk, as is common in patients, with NASH but adiponectin was unchanged. Tissue plasminogen activator inhibitor-1 (tPAI-1) showed a trend toward elevation, yet the change was not statistically significant. The elevated fasting insulin and impaired insulin-mediated glucose disposal suggest the presence of hepatic and peripheral insulin resistance, respectively. Single-time point parameters are also used to estimate insulin resistance in the clinical setting. Although these have not been validated in mice, the QUICKI was 0.308 ± 0.010 in ALIOS mice versus 0.330 ± 0.021 in control mice (P < 0.05) at 16 wk. This magnitude of difference is similar to that associated with NASH in humans, with lower values reflecting more severe insulin resistance.
Table 3.
Insulin and adipokines in mice treated for 8 wk
| Insulin, pg/ml | Leptin, pg/ml | Resistin, pg/ml | Adiponectin, pg/ml | tPAI-1, pg/ml | |
|---|---|---|---|---|---|
| ALIOS | 1,157±337* | 3,335±637* | 3,431±961* | 11.7±1.9 | 2,494±1,490 |
| Control | 388±104 | 805±547 | 1,575±386 | 11.8±3.0 | 1,469±489 |
tPAI-1, tissue plasminogen activator inhibitor-1.
P < 0.05 compared to control.
Evidence for an inflammatory and fibrogenic response in the liver was sought at the molecular level. Hepatic TNF-α mRNA in ALIOS mice was increased 4.4-fold compared with control mice (P < 0.05), and the abundance of liver PCA mRNA was 3.5-fold higher than that of the control mice at 8 wk (P < 0.05). The increased PCA mRNA abundance suggests early stages of fibrogenesis at the molecular level.
DISCUSSION
Maintaining a sedentary lifestyle and consuming excessive portions of food dense in calories and trans fats while drinking beverages that contain substantial amounts of fructose have been identified as major contributing factors in the burgeoning epidemic of obesity and its comorbidities. NAFLD is one such outcome. The pathogenesis of this common disorder, however, remains poorly understood. Moreover, the role of increasing trans fat consumption in promoting the development of NASH has not been explored. In this study, we combined the major dietary and behavioral factors proposed to be contributors to the metabolic syndrome and its comorbidities with the aim of developing a rodent model of NAFLD that closely mimics the American diet and lifestyle.
How NAFLD and NASH should be defined in rodents has not been established, but the development of substantial steatosis with associated necroinflammatory changes in the setting of obesity, insulin resistance, and plasma ALT elevations as seen in this model suggests that the ALIOS model induces important phenotypic features of NASH. The combination of risk factors used in this model led to rapid accumulation of substantial amounts of hepatic steatosis in a pattern initially suggestive of type 2, or pediatric, NAFLD. In contrast to adult NAFLD, in which fat accumulation and injury is often initially localized to zone 3, pediatric NAFLD has been described as accumulation of macrovesicular steatosis in zone 1 with a lack of Mallory bodies or ballooned hepatocytes (37). At the early time points in the ALIOS model, a striking histological feature was the sharp demarcation that developed between the fat droplets in zone 1 and the sparing of zone 3 of hepatic acini. At later time points, macrovesicular fat droplets filled zone 1 hepatocytes to distension, while there was progressive accumulation of small-droplet fat, microvesicular steatosis, or both in zone 3 hepatocytes. A distinct “border” of macrosteatosis remained between the two zones. Interestingly, these findings were most accentuated in the peripheral areas of the hepatic parenchyma. Inclusion of trans fats in the diet in commonly consumed partially hydrogenated vegetable oil played a major role in the development of steatosis.
The basis for the striking demarcations between macrovesicular and microvesicular fat in this model is unknown. Possibilities include differences of lipid metabolism or glucose metabolism or differential responsiveness of hepatocytes to insulin signaling. Zonal hepatocellular differences in Krebs cycle and cytochrome P-450s are well known (30). Additionally, one study has raised the possibility that small-droplet fat could represent abnormal vesicles of smooth endoplasmic reticulum, whereas large-droplet fat is the intended sequestration form of excess hepatocyte triglyceride (7). Common to other C57BL/6 mouse models that use short-term obesity-inducing diets, our model did not result in histologically detectable fibrosis by 16 wk; however, by mRNA analysis evidence of profibrogenic processes was found with increased expression of procollagen mRNA. Whether the length of exposure to the diet was insufficient to observe increased collagen accumulation or robust antifibrotic mechanisms inherent to the mouse are at play is not known.
The consequences of exposure in humans to the individual components of the ALIOS model are well documented. From 1970 to 2003, the United States saw an average increase of 216 calories from fat per person per day (ERS Food Consumption Data System). The caloric distribution of the food consumed by mice in this model was similar to a fast-food meal with 40% of calories derived from fat. In this model, ∼30% of the fat was trans fats, which is an amount not unlike that in some snack foods (1). Although the use of trans fats is now being reduced by some segments of the food industry because of an unfavorable cardiovascular risk profile (28), they continue to be used to prepare fast foods and baked goods (38), and their consumption has been shown to correlate with insulin resistance and obesity (33). Whether the current regulations allowing foods to contain up to 0.5 g of trans fats per serving yet be labeled as trans fat free is sufficient to prevent these pathological changes in the liver is unknown. The ALIOS model uses far more trans fat on a per-kilogram basis than would be seen with typical human consumption, so further work is needed to establish where in this spectrum of consumption liver disease might develop. It is worrisome that a recent study of a group of young people eating a fast-food diet for just 4 wk while maintaining a sedentary lifestyle demonstrated marked ALT elevations (22). The authors of that study could only speculate as to the cause, especially since the increase in liver triglyceride was relatively minor, but Marchesini et al. (25) raised the possibility that trans fats could be playing a role.
The mechanisms of cellular dysfunction caused by trans fats continue to be debated. One study demonstrated that trans fats inhibit Δ6-desaturase, an enzyme necessary for converting fatty acids to prostaglandins, thus altering the regulation of cell growth, muscle function, and inflammation (24). Although another study found that trans fats induce zone 3 hepatic steatosis in rats (6), the role of trans fats in promoting hepatocellular injury in NASH has not been examined. In ALIOS mice, the amount of steatosis seen was substantially greater than in the mice fed lard rather than trans fats, as was the plasma ALT level, indicating greater hepatocellular injury related to trans fat consumption compared with an isocaloric diet containing lard (a combination of saturated and natural cis-unsaturated fats). These findings raise the possibility that injury in human NAFLD could be worsened by the consumption of synthetic trans fats.
Plasma hypertriglyceridemia did not develop in the ALIOS mice even though there was substantial fat accumulation in the liver. Because plasma triglycerides in the fasting state largely originate from the liver, this observation may reflect impaired hepatic secretion of very low-density lipoprotein. Interestingly, elevations of plasma triglycerides were found when trans fats were eliminated, further suggesting that trans fats may have a role in causing a secretory block of triglyceride secretion from the liver. The cause of the hypercholesterolemia without excessive cholesterol feeding also warrants further exploration, as it may reflect impaired hepatic uptake of low-density lipoproteins by the liver or altered gene expression with increased cholesterol synthesis.
The ALIOS model also included consumption of a HFCS in amounts relevant to that consumed by some Americans. The most commonly used HFCS in soft drinks and other carbohydrate-sweetened beverages is a blend composed of 55% fructose, 41% glucose, and 4% complex polysaccharides, and thus this proportion of fructose was included in the HFCS equivalent in the ALIOS model. Consumption of fructose is associated with adverse alterations of plasma lipid profiles and metabolic changes (10, 12). Fructose was originally touted as a beneficial dietary component because it does not stimulate insulin secretion. But since insulin signaling plays an important role in central mechanisms of satiety, this property of fructose may be undesirable (11, 40). One study has also suggested that, unlike other sugars, fructose may prevent suppression of ghrelin secretion, resulting in impaired satiety mechanisms (40). The observation that the ALIOS mice indeed consumed a greater quantity of food beyond the additional calories consumed from the HFCS when fed HFCS compared with control water supports this observation and reinforces the concerns about the role of fructose in the obesity epidemic (19). In large quantities, fructose can also stress the liver by depleting hepatic energy supplies (41). In one study, normal subjects and patients with NASH exhibited similar depletion of hepatic ATP levels after an injection of fructose, but recovery of ATP levels after depletion was slower in NASH patients compared with healthy patients (8). Why a mixture of the monosaccharides fructose and glucose might induce metabolic abnormalities that differ from sucrose, a disaccharide cleaved to fructose and glucose in the small intestine, is a source of ongoing debate.
The progressively increasing sedentary behavior of children and adults worldwide over the past several decades is well documented. This increasingly inactive lifestyle has been associated with the increasing prevalence of obesity and also a rise in the prevalence of NASH, type 2 diabetes mellitus, insulin resistance, and other components of the metabolic syndrome (15, 16, 34). In one study, rats were shown to improve hepatic steatosis with physical activity (31); exercise has also been shown to prevent hepatic steatosis in rats on a diet that induced steatosis (13). Although formal measurements of exercise were not made in this study, ALIOS mice were likely restricted in their ability to exercise by the removal of the wire racks from their cages and were subjectively found to be sedentary. Additional studies will now be needed to quantify the activity of ALIOS mice and to examine the effects of promoting increased physical activity in this model.
Reduced glucose tolerance in the ALIOS mice was evident by the second week of treatment. Although some investigators have suggested that hepatic steatosis causes insulin resistance (9, 36), our observations are in line with others (5, 27) and suggest that metabolic abnormalities precede the development of steatosis, and may thus be responsible for subsequent hepatic steatosis. Fasting elevations of blood glucose are a marker of hepatic insulin resistance with resulting inappropriate gluconeogenesis (35). In this model, elevated fasting glucose levels were evident early in the course of treatment when liver fat accumulation was relatively minor, suggesting that hepatic insulin resistance develops before the accumulation of much fat.
In summary, mice treated with a combination of factors that have been associated with the development of obesity and NASH develop a severe phenotype of fatty liver disease with necroinflammatory changes and a profibrogenic response at the molecular level in the setting of obesity, hepatic insulin resistance, impaired insulin responsiveness, and hyperinsulinemia. Inclusion of HFCS promoted increased food intake and contributed to impaired insulin sensitivity. Importantly, the presence of trans fats promoted fat retention in the liver and contributed substantially to hepatocellular injury. This clinically relevant model sets the stage for the study of interventions to treat or prevent NAFLD and further the understanding of the role of trans fats in the pathogenesis of NASH.
GRANTS
This work was fully supported by the Saint Louis University Liver Center.
Acknowledgments
The authors acknowledge the technical expertise of Vanita Talkad and the administrative assistance of Lou Ann Biermann.
Footnotes
The costs of publication of this article were defrayed in part by the payment of page charges. The article must therefore be hereby marked “advertisement” in accordance with 18 U.S.C. Section 1734 solely to indicate this fact.
REFERENCES
- 1.Albers MJ, Harnack LJ, Steffen LM, Jacobs DR. 2006 Marketplace survey of trans-fatty acid content of margarines and butters, cookies and snack cakes, and savory snacks. J Am Diet Assoc 108: 367–370, 2008 [DOI] [PubMed] [Google Scholar]
- 2.Almind K, Kahn CR. Genetic determinants of energy expenditure and insulin resistance in diet-induced obesity in mice. Diabetes 53: 3274–3285, 2004 [DOI] [PubMed] [Google Scholar]
- 3.Anstee QM, Goldin RD. Mouse models in non-alcoholic fatty liver disease and steatohepatitis research. Int J Exp Pathol 87: 1–16, 2006 [DOI] [PMC free article] [PubMed] [Google Scholar]
- 4.Bezerra RM, Ueno M, Silva MS, Tavares DQ, Carvalho CR, Saad MJ. A high fructose diet affects the early steps of insulin action in muscle and liver of rats. J Nutr 130: 1531–1535, 2000 [DOI] [PubMed] [Google Scholar]
- 5.Buettner R, Ottinger I, Scholmerich J, Bollheimer LC. Preserved direct hepatic insulin action in rats with diet-induced hepatic steatosis. Am J Physiol Endocrinol Metab 286: E828–E833, 2004 [DOI] [PubMed] [Google Scholar]
- 6.Buettner R, Parhofer KG, Woenckhaus M, Wrede CE, Kunz-Schughart LA, Schölmerich J, Bollheimer LC. Defining high-fat-diet rat models: metabolic and molecular effects of different fat types. J Mol Endocrinol 36: 485–501, 2006 [DOI] [PubMed] [Google Scholar]
- 7.Chang BHJ, Li L, Paul A, Taniguchi S, Nannegari V, Heird WC, Chan L. Protection against fatty liver but normal adipogenesis in mice lacking adipose differentiation-related protein. Mol Cell Biol 26: 1063–1076, 2006 [DOI] [PMC free article] [PubMed] [Google Scholar]
- 8.Cortez-Pinto H, Chatham J, Chacko VP, Arnold C, Rashid A, Diehl AM. Alterations in liver ATP homeostasis in human nonalcoholic steatohepatitis: a pilot study. JAMA 282: 1659–1664, 1999 [DOI] [PubMed] [Google Scholar]
- 9.den Boer M, Voshol PJ, Kuipers F, Havekes LM, Romijn JA. Hepatic steatosis: a mediator of the metabolic syndrome. Lessons from animal models. Arterioscler Thromb Vasc Biol 24: 644–649, 2004 [DOI] [PubMed] [Google Scholar]
- 10.Dhingra R, Sullivan L, Jacques PF, Wang TJ, Fox CS, Meigs JB, D'Agostino RB, Gaziano JM, Vasan RS. Soft drink consumption and risk of developing cardiometabolic risk factors and the metabolic syndrome in middle-aged adults in the community. Circulation 116: 480–488, 2007 [DOI] [PubMed] [Google Scholar]
- 11.Elliott SS, Keim NL, Stern JS, Teff K, Havel PJ. Fructose, weight gain, and the insulin resistance syndrome. Am J Clin Nutr 76: 911–922, 2002 [DOI] [PubMed] [Google Scholar]
- 12.Faeh D, Minehira K, Schwarz JM, Periasami R, Seongsu P, Tappy L. Effect of fructose overfeeding and fish oil administration on hepatic de novo lipogenesis and insulin sensitivity in healthy men. Diabetes 54: 1907–1913, 2005 [DOI] [PubMed] [Google Scholar]
- 13.Gauthier MS, Couturier K, Latour JG, Lavoie JM. Concurrent exercise prevents high-fat-diet-induced macrovesicular hepatic steatosis. J Appl Physiol 94: 2127–2134, 2003 [DOI] [PubMed] [Google Scholar]
- 14.Haluzik M, Colombo C, Gavrilova O, Chua S, Wolf N, Chen M, Stannard B, Dietz KR, Le Roith D, Reitman ML. Genetic background (C57BL/6J versus FVB/N) strongly influences the severity of diabetes and insulin resistance in ob/ob mice. Endocrinology 145: 3258–3264, 2004 [DOI] [PubMed] [Google Scholar]
- 15.Hu FB, Li TY, Colditz GA, Willett WC, Manson JE. Television watching and other sedentary behaviors in relation to risk of obesity and type 2 diabetes mellitus in women. JAMA 289: 1785–1791, 2003 [DOI] [PubMed] [Google Scholar]
- 16.Hwu CM, Hsiao CF, Kuo SW, Wu KD, Ting CT, Quertermous T, Rodriguez B, Chen I, Grove J, Chen PY, Hoo LT. Physical inactivity is an important lifestyle determinant of insulin resistance in hypertensive patients. Blood Press 13: 355–361, 2004 [DOI] [PubMed] [Google Scholar]
- 17.Ibrahim A, Natrajan S, Ghafoorunissa R. Dietary trans-fatty acids alter adipocyte plasma membrane fatty acid composition and insulin sensitivity in rats. Metabolism 54: 240–246, 2005 [DOI] [PubMed] [Google Scholar]
- 18.Ip E, Farrell GC, Robertson G, Hall P, Kirsch R, Leclercq I. Central role of PPARα-dependent hepatic lipid turnover in dietary steatohepatitis in mice. Hepatology 38: 123–132, 2003 [DOI] [PubMed] [Google Scholar]
- 19.James J, Thomas P, Cavan D, Kerr D. Preventing childhood obesity by reducing consumption of carbonated drinks: cluster randomised controlled trial. BMJ 328: 1237, 2004 [DOI] [PMC free article] [PubMed] [Google Scholar]
- 20.Jürgens H, Haass W, Castañeda TR, Schürmann A, Koebnick C, Dombrowski F, Otto B, Nawrocki AR, Scherer PE, Spranger J, Ristow M, Joost HG, Havel PJ, Tschöp MH. Consuming fructose-sweetened beverages increases body adiposity in mice. Obes Res 13: 1146–1156, 2005 [DOI] [PubMed] [Google Scholar]
- 21.Katz A, Nambi SS, Mather K, Baron AD, Follmann DA, Sullivan G, Quon MJ. Quantitative insulin sensitivity check index: a simple, accurate method for assessing insulin sensitivity in humans. J Clin Endocrinol Metab 85: 2402–2410, 2000 [DOI] [PubMed] [Google Scholar]
- 22.Kechagias S, Ernersson A, Dahlqvist O, Lundberg P, Lindstrom T, Nystrom FH, Fast Food Study Group. Fast-food-based hyper-alimentation can induce rapid and profound elevation of serum alanine aminotransferase in healthy subjects. Gut 57: 649–654, 2008 [DOI] [PMC free article] [PubMed] [Google Scholar]
- 23.Koteish A, Diehl AM. Animal models of steatosis. Semin Liver Dis 21: 89–104, 2001 [DOI] [PubMed] [Google Scholar]
- 24.Mahfouz M. Effect of dietary trans fatty acids on the Δ5, Δ6 and Δ9 desaturases of rat liver microsomes in vivo. Acta Biol Med Ger 40: 1699–1705, 1981 [PubMed] [Google Scholar]
- 25.Marchesini G, Ridolfi V, Nepoti V. Hepatotoxicity of fast food? Gut 57: 568–570, 2008 [DOI] [PubMed] [Google Scholar]
- 26.Milagro FI, Campion J, Martinez JA. Weight gain induced by high-fat feeding involves increased liver oxidative stress. Obesity (Silver Spring) 14: 1118–1123, 2006 [DOI] [PubMed] [Google Scholar]
- 27.Monetti M, Levin MC, Watt MJ, Sajan MP, Marmor S, Hubbard BK, Stevens RD, Bain JR, Newgard CB, Farese RV Sr, Hevener AL, Farese RV Jr. Dissociation of hepatic steatosis and insulin resistance in mice overexpressing DGAT in the liver. Cell Metab 6: 69–78, 2007 [DOI] [PubMed] [Google Scholar]
- 28.Mozaffarian D, Katan MB, Ascherio A, Stampfer MJ, Willett WC. Trans fatty acids and cardiovascular disease. N Engl J Med 354: 1601–1613, 2006 [DOI] [PubMed] [Google Scholar]
- 29.Nan L, Wu Y, Bardag-Gorce F, Li J, French BA, Fu AN, Francis T, Vu J, French SW. p62 is involved in the mechanism of Mallory body formation. Exp Mol Pathol 77: 168–175, 2004 [DOI] [PubMed] [Google Scholar]
- 30.Oinonen T, Lindros KO. Zonation of hepatic cytochrome P-450 expression and regulation. Biochem J 329: 17–35, 1998 [DOI] [PMC free article] [PubMed] [Google Scholar]
- 31.Rector RS, Thyfault JP, Morris RT, Laye MJ, Borengasser SJ, Booth FW, Ibdah JA. Daily exercise increases hepatic fatty acid oxidation and prevents steatosis in Otsuka Long-Evans Tokushima Fatty rats. Am J Physiol Gastrointest Liver Physiol 294: G619–G626, 2008 [DOI] [PubMed] [Google Scholar]
- 32.Rinella ME, Green RM. The methionine-choline deficient dietary model of steatohepatitis does not exhibit insulin resistance. J Hepatol 40: 47–51, 2004 [DOI] [PubMed] [Google Scholar]
- 33.Riserus U. Trans fatty acids and insulin resistance. Atheroscler Suppl 7: 37–39, 2006 [DOI] [PubMed] [Google Scholar]
- 34.Ross R, Dagnone D, Jones PJ, Smith H, Paddags A, Hudson R, Janssen I. Reduction in obesity and related comorbid conditions after diet-induced weight loss or exercise-induced weight loss in men. A randomized, controlled trial. Ann Intern Med 133: 92–103, 2000 [DOI] [PubMed] [Google Scholar]
- 35.Rossetti L, Giaccari A, Barzilai N, Howard K, Sebel G, Hu M. Mechanism by which hyperglycemia inhibits hepatic glucose production in conscious rats: implications for the pathophysiology of fasting hyperglycemia in diabetes. J Clin Invest 92: 1126–1134, 1993 [DOI] [PMC free article] [PubMed] [Google Scholar]
- 36.Ryysy L, Häkkinen AM, Goto T, Vehkavaara S, Westerbacka J, Halavaara J, Yki-Järvinen H. Hepatic fat content and insulin action on free fatty acids and glucose metabolism rather than insulin absorption are associated with insulin requirements during insulin therapy in type 2 diabetic patients. Diabetes 49: 749–758, 2000 [DOI] [PubMed] [Google Scholar]
- 37.Schwimmer JB, Behling C, Newbury R, Deutsch R, Nievergelt C, Schork NJ, Lavine JE. Histopathology of pediatric nonalcoholic fatty liver disease. Hepatology 42: 641–649, 2005 [DOI] [PubMed] [Google Scholar]
- 38.Stender S, Dyerberg J, Astrup A. High levels of industrially produced trans fat in popular fast foods. N Engl J Med 354: 1650–1652, 2006 [DOI] [PubMed] [Google Scholar]
- 39.Stender S, Dyerberg J, Bysted A, Leth T, Astrup A. A trans world journey. Atheroscler Suppl 7: 47–52, 2006 [DOI] [PubMed] [Google Scholar]
- 40.Teff KL, Elliott SS, Tschop M, Kieffer TJ, Rader D, Heiman M, Townsend RR, Keim NL, D'Alessio D, Havel PJ. Dietary fructose reduces circulating insulin and leptin, attenuates postprandial suppression of ghrelin, and increases triglycerides in women. J Clin Endocrinol Metab 89: 2963–2972, 2004 [DOI] [PubMed] [Google Scholar]
- 41.Terrier F, Vock P, Cotting J, Ladebeck R, Reichen J, Hentschel D. Effect of intravenous fructose on the P-31 MR spectrum of the liver: dose response in healthy volunteers. Radiology 171: 557–563, 1989. [Erratum. Radiology 173 (Oct): 286, 1989.] [DOI] [PubMed] [Google Scholar]


