

Abstract
Executive functions refer to a constellation of higher-level cognitive abilities that enable goal-oriented behavior. The NIH EXAMINER battery was designed to assess executive functions comprehensively and efficiently. Performance can be summarized by a single score, the ‘Executive Composite,’ which combines measures of inhibition, set-shifting, fluency, and working memory. We evaluated the ecological validity of the Executive Composite in a sample of 225 mixed neurological patients and controls using the Frontal Systems Behavior Scale (FrSBe), an informant-based measure of real-world executive behavior. In addition, we investigated the neuroanatomical correlates of the Executive Composite using voxel-based morphometry in a sample of 37 participants diagnosed with dementia, mild cognitive impairment, or as neurologically healthy. The Executive Composite accounted for 28% of the variance in FrSBe scores beyond age. Even after including two widely-used executive function tests (Trails B and Stroop) as covariates, the Executive Composite remained a significant predictor of real-world behavior. Anatomically, poorer scores on the Executive Composite were associated with smaller right and left dorsolateral prefrontal volumes, brain regions critical for good executive control. Taken together, these results suggest that the Executive Composite measures important aspects of executive function not captured by standard measures and reflects the integrity of frontal systems.
Keywords: executive function, magnetic resonance imaging, validity of results, neurological disorders, prefrontal cortex, neurodegenerative disorders
Introduction
Executive functions refer to a constellation of cognitive abilities that allow us to engage in goal-oriented behavior. They include the ability to generate and organize thought, to think flexibly, to mentally manipulate information, to self-monitor, and to adjust behavior as appropriate to the current context (Cummings & Miller, 2007; Lezak, Howieson, Bigler, & Tranel, 2012). Deficits in executive functions are prominent in a multitude of neurological conditions, including Alzheimer’s disease (Bondi et al., 2008), frontotemporal dementia (Possin et al., 2013; Torralva et al., 2007), Parkinson’s disease (Muslimovic, Post, Speelman, & Schmand, 2005), Huntington’s disease (Peinemann et al., 2005), multiple sclerosis (Parmenter, Shucard, & Shucard, 2007), traumatic brain injury (Caeyenberghs et al., 2012; McDonald, Flashman, & Saykin, 2002), brain tumors (Correa, 2010), and vascular disease of the brain (Hayes, Donnellan, & Stokes, 2012; Sachdev et al., 2004). Executive dysfunction can devastate a patient’s level of functioning (Farias et al., 2009), predicting functional decline beyond memory or global cognition (Boyle, Paul, Moser, & Cohen, 2004; Cahn-Weiner et al., 2007). Executive functions rely heavily on the integrity of the frontal lobes, which represent over 30% of the cortical surface of the brain and play a major role in the organization of behavior and cognition (Clark, Cools, & Robbins, 2004; Diamond, 2002; Rolls, 2004; Stuss & Levine, 2002). The intactness of posterior cortical structures such as the parietal lobes (Champod & Petrides, 2010; Yin et al., 2012), deep gray matter (e.g., dorsal head of the caudate nucleus and the thalamus (Little et al., 2010; Provost, Petrides, & Monchi, 2010; Schmahmann & Pandya, 2008; Van der Werf et al., 2003), and the cerebellum (Stoodley & Schmahmann, 2010) are also necessary for good executive control.
In spite of the high frequency of executive dysfunction in neurological disorders and its impact on daily living, executive deficits are rarely measured comprehensively or consistently. This is often true of clinical trials, which vary in their selection of executive measures or do not include them at all even when the treatment targets cognitive disorders with prominent executive dysfunction (Brown et al., 2003; Coles et al., 2012; Vercelletto et al., 2011; Willmott & Ponsford, 2009). For example, using the search term: frontotemporal dementia on www.clinicaltrials.gov brings back 14 studies that investigate therapeutic pharmaceutical agents for the treatment of frontotemporal dementia. Of those 14, 10 include standardized neuropsychological measures of cognition, while only four include specific measures of executive function, with inconsistent selection (Clinicaltrials.gov Identifier: NCT00545974; NCT00127114; NCT00604591; NCT00187525). There remains a compelling need to have a battery of executive function tests that can be routinely integrated into neurobehavioral research and that will reliably and validly measure constructs that clinical investigators agree are important. The NIH EXAMINER battery was developed to address this need.
The NIH EXAMINER generates 11 indices to capture important aspects of executive functions including inhibition, set-shifting, working memory, and fluency. Verbal, visual, and spatial stimuli are used. The ‘Executive Composite’ is calculated to summarize performance across the 11 indices. It has excellent reliability (test-retest = .93; Kramer et al., this series) and provides a comprehensive estimate of an individual’s executive functions that is not specific to a single test or type of stimuli. Although sometimes measures of discreet executive functions are indicated, the Executive Composite could be useful for research and clinical applications when a global and reliable estimate of executive function is needed, for example, in clinical trials.
We investigated the validity of the NIH EXAMINER Executive Composite score via two studies. In Study 1, we investigated the ecological validity of the Executive Composite with an informant-based measure of real-world executive behavior, the Frontal Systems Behavior Scale™ (FrSBe) (Grace & Malloy, 2001), in a sample of patients with a variety of neurological disorders and neurologically healthy controls. The FrSBe has been validated as a measure of executive behavior by several studies (Basso et al., 2008; Chiaravalloti & DeLuca, 2003; Hellmuth et al., 2012; Lane-Brown & Tate, 2009; Malloy & Grace, 2005; Malloy, Tremont, Grace, & Frakey, 2007; Velligan, Ritch, Sui, DiCocco, & Huntzinger, 2002). The Composite was considered to have good ecological validity if it was a significant predictor of the FrSBe in regression models. In Study 2, we investigated the neuroanatomical correlates of the Executive Composite using voxel-based morphometry in a sample of patients with neurodegenerative disease and control participants to determine if the Composite correlated with brain volumes in regions known to be important for executive control.
Method
Study 1: Ecological Validity
Participants
All participants from the NIH EXAMINER validation sample who were administered the Trail Making Test (Reitan, 1955), the Stroop Test (Kramer et al., 2003), and the FrSBe, and who were 18 years of age or older, were included in ‘Study 1: Concurrent Validity.’ The sample included 136 patients with neurological disorders and 89 neurologically healthy controls (HC). Fifty-four patients were diagnosed with a neurodegenerative disorder by a board-certified neurologist using probable research criteria, as follows: Alzheimer’s disease (N= 24; AD) (McKhann et al., 2011), behavioral variant frontotemporal dementia (N = 17; bvFTD) (Rascovsky et al., 2011), Parkinson’s disease (N = 7; PD), progressive supranuclear palsy (N = 3; PSP) (Litvan et al., 1996), and Huntington’s disease (N = 3; HD). The HD patients showed unequivocal motor signs with genetic confirmation of the disease. Thirty-one patients were diagnosed with mild cognitive impairment (Winblad et al., 2004). Thirty suffered a focal lesion due to ischemic stroke, tumor, or focal injury at least 3 months prior to participation, and 15 suffered a moderate to severe traumatic brain injury as defined by a Glasgow Coma Scale < 12 at least 6 months prior to testing. Five patients were diagnosed with multiple sclerosis (Polman et al., 2005). On average, the patients and the controls were similar in age (patients: 65 +/− 18, HC: 64 +/− 19), p = .66, and years of education (patients: 15.4 +/− 2.7, HC: 15.6 +/− 3.0), p = .67; however, there were more females in the control group (56%) than the patient group (41%), p = .03 (Table 1). Participants were evaluated at six separate sites: Mayo Clinic Alzheimer’s Disease Research Center (N=85), University of California – San Francisco Memory and Aging Center (N = 68), University of Iowa (N=38), University of Texas Southwestern Medical Center (N = 29), University of California – Davis (N = 4) and University of Colorado – Denver (N = 1). Neurologically healthy controls underwent neurological and cognitive screening to verify health status. Patients and controls were excluded if they had current major psychiatric illness or substance abuse disorder, ongoing cancer treatment, known HIV, or history of metabolic abnormalities, major systemic medical illness, traumatic brain injury with > 30 min loss of consciousness, seizure disorder, or diagnosis of developmental learning disability. For both Study 1 and Study 2, written informed consent was obtained from each participant or their legal guardian (with assent from the participant) before testing. The study was approved by the committees on human research of the respective institutions and was completed in accordance with the Helsinki Declaration.
Table 1.
Study 1. Demographic Characteristics and Executive Scores by Diagnostic Group
| Diagnosis | N | Age | Ed | % Male |
EC | FrsBe | Trails B | Stroop |
|---|---|---|---|---|---|---|---|---|
| HC | 89 | 64.2 (19.2) | 15.6 (3.1) | 44 | .99 (.61) | 69.5 (18.4) | 62.3 (34.6) | 53.2 (15.5) |
| MCI | 31 | 74.2 (10.7) | 15.7 (2.3) | 52 | .36 (.49) | 98.1 (36.3) | 102.3 (64.0) | 39.3 (11.2) |
| Lesion | 30 | 63.3 (11.0) | 14.4 (2.8) | 43 | .33 (.55) | 92.2 (24.7) | 88.8 (42.0) | 48.1 (14.1) |
| AD | 24 | 79.7 (9.5) | 16.0 (2.6) | 79 | −.07 (.71) | 93.5 (27.1) | 163.1 (99.2) | 26.3 (14.2) |
| bvFTD | 17 | 66.7 (10.7) | 16.0 (2.1) | 65 | −.43 (.98) | 137.1 (41.9) | 147.8 (94.9) | 31.3 (17.7) |
| TBI | 16 | 31.2 (9.0) | 13.6 (2.6) | 56 | .61 (.88) | 113.5 (26.3) | 61.9 (37.1) | 59.9 (16.5) |
| PD | 7 | 70.4 (7.8) | 15.6 (2.2) | 71 | .18 (.70) | 95.1 (14.6) | 114.4 (83.3) | 41.7 (10.5) |
| MS | 5 | 49.6 (10.7) | 16.8 (2.3) | 80 | .59 (.31) | 104.0 (33.7) | 69.2 (22.9) | 54.4 (19.3) |
| PSP | 3 | 74.7 (5.5) | 18.3 (5.1) | 100 | −1.11 (.87) | 128.7 (26.8) | 233.0 (116.0) | 16.3 (10.7) |
| HD | 3 | 55.0 (10.8) | 16.7 (3.1) | 0 | −.26 (.31) | 127.7 (54.3) | 112.7 (62.4) | 36.0 (11.5) |
Values represent mean (standard deviation)
Abbreviations: Ed = Education, EC = Executive Composite, FrSBe = Frontal Systems Behavior Scale, HC = healthy control, MCI = mild cognitive impairment, Lesion = focal lesion due to stroke, AD = Alzheimer’s disease, bvFTD = behavioral variant frontotemporal dementia, TBI = traumatic brain injury, PD = Parkinson’s disease, MS = multiple sclerosis, PSP = progressive supranuclear palsy, HD = Huntington’s disease
Executive Function Assessment
Participants were administered the NIH EXAMINER battery in a quiet room using a standard 15.4” Dell Latitude D830 laptop. The tests and the methods for generating the Executive Composite are described in Kramer et al. (this series). The Trail Making Test and the Stroop test are widely-used executive measures (Rabin, Barr, & Burton, 2005) and were administered during the same session. Completion time on Trails B and number correct on the Stroop Interference condition were used to operationalize executive performance on these tests. To evaluate for real-world executive behavior, the FrSBe was completed by an informant who knew the participant well, in most cases the spouse or other close relative, either in-person during the visit or at home and then sent back by mail. Total raw scores were used to operationalize real-world executive behavior.
Data Analysis
Statistical analyses were performed using PASW 17.0 for Windows (SPSS Inc., Chicago, IL). Using hierarchical regression, we evaluated how well the Executive Composite predicts real-world executive behavior after accounting for the variance explained by age and gender. Next, we performed a second regression to evaluate whether the Executive Composite predicts real-world executive behavior after accounting for variance predicted by Trails B, Stroop, age and gender. In order to address the possible confounding effects of motor dysfunction, the regressions were repeated after removing patients diagnosed with Parkinson’s disease, multiple sclerosis, progressive supranuclear palsy, or Huntington’s disease. P-values less than .05 were considered to be significant.
Study 2: Neuroanatomical Correlates
Participants
MRI data were available on a sample of 18 patients and 19 HCs evaluated at the UCSF Neuroscience Imaging Center. The patients included 8 patients diagnosed with bvFTD, 6 patients diagnosed with PSP, 3 patients diagnosed with AD, and 1 patient diagnosed with MCI using the same research criteria as in Study 1. The combined patients and the controls did not differ significantly in age, gender, or education, all p values > .05 (Table 2).
Table 2.
Study 2. Demographic Characteristics, Mini Mental State Exam Scores, Clinical Dementia Rating Scale Scores, and Executive Composite Scores by Diagnostic Group
| Diagnosis | N | Age | Education | % Male |
MMSE | CDR-G | CDR-Box | EC |
|---|---|---|---|---|---|---|---|---|
| HC | 19 | 68.1 (9.7) | 15.9 (1.9) | 47 | 29.7 (0.5) | 0.0 (0.0) | 29.7 (0.5) | 1.18 (0.4) |
| bvFTD | 8 | 63.2 (4.7) | 15.3 (2.1) | 38 | 26.3 (2.9) | 1.1 (0.4) | 26.3 (2.9) | −0.06 (0.6) |
| PSP | 6 | 66.6 (5.4) | 14.7 (1.8) | 83 | 27.5 (1.2) | 1.0 (0.5) | 27.5 (1.2) | −1.12 (0.5) |
| AD | 3 | 68.3 (7.7) | 14.0 (2) | 67 | 25.7 (3.5) | 1.0 (0.0) | 25.7 (3.5) | −0.01 (0.5) |
| MCI | 1 | 64.4 | 14.0 | 0 | 28 | 0.5 | 28 | 0.32 |
Values represent mean (standard deviation)
Abbreviations: MMSE = Mini Mental State Examination, CDR-G = Clinical Dementia Rating Scale Global Score, CDR-Box = Clinical Dementia Rating Scale Box Score, EC = Executive Composite, HC = normal control, bvFTD = behavioral variant frontotemporal dementia, AD = Alzheimer’s disease, PSP = progressive supranuclear palsy, MCI = mild cognitive impairment
An additional sample of 50 healthy age-matched normal controls was used to create a template for inter-subject normalization and voxel-based morphometry.
Neuroimaging Data Acquisition
MRI scans were obtained on all Study 2 participants using a 3.0 Tesla Siemens (Siemens, Iselin, NJ) TIM Trio scanner equipped with a 12-channel head coil. Whole brain images were acquired using volumetric magnetization prepared rapid gradient-echo sequence (MPRAGE; TR/TE/TI = 2300/2.98/900 ms, α = 9°). The field of view was 240 × 256 mm, with 1 × 1 mm in-plane resolution and 1 mm slice thickness.
Voxel-Based Morphometry
We investigated the neuroanatomical correlates of the Executive Composite. Structural T1 images were corrected for bias field, segmented into gray matter, white matter, and CSF, and initially normalized into Montreal Neurological Institute (MNI) space using the Unified Segmentation procedure (Ashburner & Friston, 2005) implemented in SPM 5 (Friston, Ashburner, Kiebel, Nichols, & Penny, 2007), running under MATLAB 8.0. More anatomically precise inter-subject registration was then performed with the DARTEL toolbox (Ashburner, 2007) by warping each subject’s image to a template created from the 50 normal control subjects. Modulated grey and white matter probability maps were scaled by Jacobians, smoothed to a Gaussian kernel of 8mm full-width at half maximum, then summed together to obtain a map of brain parenchyma (Wilson et al., 2010).
The Executive Composite was correlated voxel-wise with the summed gray and white matter probabilities for the 37 subjects as a single group using the voxel-based lesion-symptom mapping toolbox (Bates et al., 2003); neuroling.arizona.edu/resources.html). Statistical maps were thresholded at voxelwise p<0.001 and then corrected for multiple comparisons by permutation analysis. Statistical maps were calculated for 1000 random assignments of normally distributed behavioral scores to patients, with the maximum cluster size recorded each time. The fifth percentile maximum cluster size was 454 mm3, so applying this as the minimum cluster size ensured corrected significance of p<0.05. Age and total intracranial volume were included as nuisance covariates in all VBM analyses.
Two secondary VBM analyses were conducted with all subjects except those with bvFTD, and then with all subjects except those with PSP. The purpose of these analyses was to determine whether our primary VBM findings were specific to either of our largest diagnostic groups; i.e., if the findings were no longer significant with either bvFTD or PSP removed. This was important because PSP patients display motor dysfunction and because bvFTD and PSP are each associated with characteristic patterns of atrophy. BvFTD causes atrophy in medial and orbital prefrontal cortex that extends to lateral prefrontal cortex with disease progression; early targets also include insula, medial temporal, and striatal-thalamic structures (Seeley et al., 2008). PSP causes atrophy of supplementary motor area, premotor cortex, caudate, thalamus, anterior insula, and brainstem (Whitwell et al., 2012). By emphasizing only findings that are significant in both of these secondary VBMs, we reduce the impact of any one diagnostic group. We restricted our secondary analyses within a mask of our full sample results thresholded at voxelwise p<0.05 with permutation correction and thresholded clusterwise at p<0.05. For each of these two analyses within this mask, statistical maps were thresholded at voxelwise p<0.001 with permutation correction, and then a clusterwise threshold of p<0.05 was applied, which was 495 voxels for the analysis without the bvFTD subjects and 499 voxels without the PSP subjects.
Results
Study 1: Ecological Validity
The regression model with age, gender, and the Executive Composite entered as predictors significantly predicted real-world executive behavior, F (3, 221) = 33.43, p < .001, (Table 3). Using hierarchical regression, the Executive Composite accounted for 28% of the variance in FrSBe scores beyond age and gender, p < .001.When Trails B and Stroop scores were entered simultaneously with age and gender, the Executive Composite remained a significant predictor, p < .001, predicting an additional 4% of the variance after accounting for the other covariates (Table 4). Trails B was also a significant unique predictor, p = .001, but the Stroop did not predict significant unique variance, p = .44.
Table 3.
Regression Results Predicting FrSBe Scores from Age, Gender, and the Executive Composite
| Predictor Variables | ϐ | 95% CI for ϐ | p value |
|---|---|---|---|
| Age | −.16 | (−.36, −.10) | .005 |
| Gender | −.11 | (−.24, .02) | .052 |
| Executive Composite | −.54 | (−.67, −.41) | <.001 |
Table 4.
Regression Results Predicting FrSBe Scores from Age, Gender, Trails B, Stroop, and the Executive Composite
| Predictor Variables | ϐ | 95% CI for ϐ | p value |
|---|---|---|---|
| Age | −.23 | (−.36, −.10) | .001 |
| Gender | −.08 | (−.21, .06) | .176 |
| Trails B | .27 | (.13, .40) | .001 |
| Stroop | −.07 | (−.20, .06) | .443 |
| Executive Composite | −.32 | (−.45, −.19) | <.001 |
These regressions were repeated after removing patients with motor dysfunction from the sample. The Executive Composite accounted for 27% of the variance in FrsBe scores beyond age and gender, p < .001, and 5% of the variance beyond Trails B, Stroop, age, and gender, p < .001.
Study 2: Neuroanatomical Correlates
Lower Executive Composite scores were associated with smaller brain volumes covering a large extent of frontal regions in a lateral and medial pattern. The largest and most significant cluster included the bilateral superior, middle, and inferior frontal gyri, the supplementary motor area, the precentral gyrus, and the anterior and middle cingulate. This cluster extended to the left rolandic operculum, the left postcentral gyrus, the left superior temporal gyrus, the brainstem and the bilateral antero-ventrolateral thalamus. Smaller volumes of the right and left cerebellum were also associated with lower Executive Composite scores (Table 5).
Table 5.
Neuroantomical correlates of the Executive Composite in the full sample
| Region | MNI coordinates | Max T | ||
|---|---|---|---|---|
| x | y | z | ||
| Cluster 1 (15,583 mm3; p = .003, corrected) | −6 | 4 | 31 | 5.24 |
| Right Frontal Regions | ||||
| middle frontal gyrus | 34 | 6 | 40 | 4.45 |
| superior frontal gyrus | 29 | −3 | 68 | 4.34 |
| precentral gyrus | 38 | 2 | 44 | 4.11 |
| supplementary motor area | 10 | −1 | 54 | 3.69 |
| mid cingulate | 10 | 13 | 42 | 3.67 |
| inferior frontal gyrus | 47 | 15 | 37 | 3.66 |
| anterior cingulate | 8 | 36 | 24 | 3.53 |
| Left Frontal Regions | ||||
| superior frontal gyrus | −12 | 13 | 55 | 5.08 |
| supplementary motor area | −11 | 15 | 56 | 5.01 |
| Inferior frontal gyrus | −34 | 17 | 34 | 4.37 |
| middle frontal gyrus | −38 | 17 | 35 | 4.12 |
| precentral gyrus | −39 | 4 | 34 | 4.10 |
| mid cingulate | −13 | −11 | 48 | 3.94 |
| rolandic operculum | −54 | 4 | 4 | 3.66 |
| anterior cingulate | −11 | 30 | 30 | 3.44 |
| Left Parietal Regions | ||||
| Left postcentral gyrus | −61 | −4 | 28 | 4.38 |
| Left Temporal Regions | ||||
| Left superior temporal gyrus | −50 | −23 | 6 | 4.40 |
| Subcortical and Brainstem | ||||
| Brainstem | −4 | −20 | −10 | 5.24 |
| Left thalamus | −14 | −13 | 0 | 4.19 |
| Right thalamus | 14 | −15 | −1 | 3.56 |
| Cluster 2 (1,095 mm3; p = .02, corrected) | 22 | −47 | −31 | 4.08 |
| Right Cerebellum | 22 | −44 | −30 | 4.08 |
| Cluster 3 (975 mm3; p = .03, corrected) | −19 | −49 | −34 | 4.28 |
| Left Cerebellum | −20 | −44 | −32 | 4.28 |
Results were thresholded at voxelwise p<.001 and corrected for multiple comparisons by permutation analysis. Cluster size was thresholded at p<.05; only clusters greater than 454 mm3 were considered significant. MNI coordinates for the clusters are the center of the mass, whereas MNI coordinates for the regions are the local maxima.
To determine whether the neuroanatomical correlates were specific to bvFTD or PSP, the analyses were repeated twice, once with the bvFTD subjects removed (Table 6) and once with the PSP subjects removed (Table 7). Regions that were significant across all 3 analyses were one cluster in the right middle and superior frontal gyri that extended into the inferior frontal gyrus and middle cingulate, and one cluster in the left middle frontal gyrus that extended into the inferior frontal gyrus. This overlap of the three analyses is depicted in Figure 1.
Table 6.
Neuroantomical correlates of the Executive Composite without the bvFTD subjects
| Region | MNI coordinates | Max T | ||
|---|---|---|---|---|
| x | y | z | ||
| Cluster 1 (11,373 mm3; p < .01) | −6 | 3 | 38 | 5.03 |
| Right Frontal Regions | ||||
| middle frontal gyrus | 35 | 9 | 42 | 4.88 |
| precentral gyrus | 42 | 9 | 47 | 4.85 |
| superior frontal gyrus | 28 | −3 | 68 | 4.20 |
| supplementary motor area | 1 | −1 | 56 | 4.41 |
| mid cingulate | 13 | −7 | 45 | 3.96 |
| inferior frontal gyrus | 32 | 9 | 35 | 4.66 |
| Left Frontal Regions | ||||
| anterior cingulate | −12 | 31 | 30 | 3.81 |
| mid cingulate | −11 | 1 | 46 | 4.83 |
| precentral gyrus | −36 | 3 | 34 | 4.08 |
| middle frontal gyrus | −30 | 17 | 35 | 4.22 |
| supplementary motor area | −10 | 13 | 48 | 4.91 |
| superior frontal gyrus | −14 | 9 | 49 | 4.71 |
| rolandic operculum | −61 | 0 | 10 | 4.39 |
| inferior frontal gyrus | −61 | 9 | 9 | 3.61 |
| Left Parietal Regions | ||||
| postcentral gyrus | −62 | −5 | 26 | 5.03 |
| Left Temporal Regions | ||||
| superior temporal gyrus | −50 | −24 | 9 | 4.37 |
| Cluster 2 (1,544 mm3; p = .02) | −4 | −18 | −8 | 5.00 |
| Brainstem | −2 | −22 | −10 | 5.00 |
| Right thalamus | 15 | −12 | 0 | 3.46 |
| Left thalamus | −13 | −13 | −1 | 4.01 |
| Cluster 3 (913 mm3; p = .03) | 24 | −44 | −32 | 4.27 |
| Right cerebellum | 26 | −42 | −30 | 4.27 |
| Cluster 4 (672 mm3; p = .04) | −22 | −43 | −34 | 4.81 |
| Left cerebellum | −28 | −36 | −40 | 4.81 |
Results were thresholded at voxelwise p<.001 and corrected for multiple comparisons by permutation analysis. Cluster size was thresholded at p<.05; only clusters greater than 495 mm3 were considered significant. MNI coordinates for the clusters are the center of the mass, whereas MNI coordinates for the regions are the local maxima.
Table 7.
Neuroanatomical Correlates of the Executive Composite without the PSP subjects
| Region | MNI coordinates |
Max T | ||
|---|---|---|---|---|
| x | y | z | ||
| Cluster 1 (2,574 mm3; p<.01) | 24 | 31 | 35 | 5.36 |
| Right Frontal | ||||
| middle frontal gyrus | 36 | 36 | 44 | 5.36 |
| superior frontal gyrus | 22 | 33 | 39 | 4.80 |
| anterior cingulate | 6 | 37 | 25 | 4.30 |
| inferior frontal gyrus | 34 | 19 | 31 | 3.77 |
| mid cingulate | 9 | 26 | 34 | 3.61 |
| Cluster 2 (1,049 mm3; p = .02) | −30 | 32 | 29 | 4.11 |
| Left Frontal | ||||
| inferior frontal gyrus, pars triangularis | −38 | 16 | 30 | 4.11 |
| middle frontal gyrus | −27 | 29 | 38 | 3.91 |
| superior frontal gyrus | −24 | 32 | 36 | 3.90 |
| Cluster 3 (769 mm3; p = .03) | −26 | 8 | −36 | 4.04 |
| Left Temporal | ||||
| temporal pole | −22 | 6 | −36 | 4.01 |
| fusiform | −22 | 4 | −41 | 4.01 |
| inferior temporal gyrus | −27 | 4 | −42 | 3.90 |
| Left Frontal | ||||
| inferior frontal gyrus, pars orbitalis | −31 | 27 | −14 | 3.48 |
Results were thresholded at voxelwise p<.001 and corrected for multiple comparisons by permutation analysis. Cluster size was thresholded at p<.05; only clusters greater than 495 mm3 were considered significant. MNI coordinates for the clusters are the center of the mass, whereas MNI coordinates for the regions are the local maxima.
Figure 1.
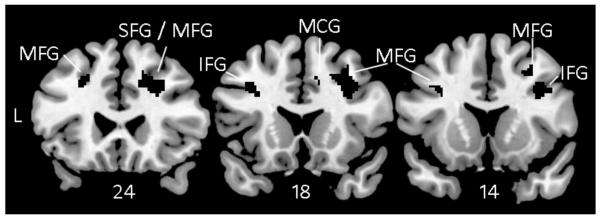
Voxel-based morphometry showing brain regions where atrophy correlated with lower scores on the Executive Composite consistently across all three analyses: Full sample (Table 5), No bvFTD (Table 6), and No PSP (Table 7). These results are not specific to any one diagnostic group. All results were thresholded voxelwise at p<.001 and corrected for multiple comparisons using permutation analysis with p<.05.
Discussion
We investigated the concurrent validity and neuroanatomical correlates of the NIH EXAMINER Executive Composite score. The Executive Composite was a robust predictor of real-world executive behavior, even after accounting for performance on the commonly-used executive function tests Trails B and Stroop. Poor performance on the Executive Composite correlated with atrophy in brain regions important for executive control, including the right middle and superior frontal gyri and the left middle frontal gyri.
The Executive Composite is measured using objective testing, and the FrSBe is an informant-based rating scale. These methods have different limitations as measures of behavior. Objective testing captures the patient’s behavior during one structured visit and may not capture intermittent behaviors or behaviors that emerge in less structured environments. Informant scales can address these limitations, but are dependent on the quality of the informant’s report. Because the Executive Composite and the FrSBe utilize distinct methods, their shared variance can be attributed to a shared construct. The unique contribution of the Executive Composite to FrSBe after accounting for performance on Trails B and Stroop indicates that the Composite is sensitive to components of executive function not tapped by these classic measures. Additional research will be needed to evaluate the Executive Composite’s validity beyond other executive measures, such as measures of planning.
We did not control for speed in the Executive Composite, Trails B, or Stroop because speed is closely related to executive functions (Salthouse, 2005). The purpose of this study was to validate a measure that is optimally sensitive to executive functions, and controlling for speed would have removed meaningful variance. The analyses were repeated after removing patients diagnosed with disorders that cause motor dysfunction, and a similar pattern of results was found, suggesting that the relationship to real-world executive behavior was not driven by motor dysfunction.
The Executive Composite scores correlated with brain volume in regions important for executive control. In the full sample, the largest extent of the correlations was in the lateral and medial aspects of the frontal lobes bilaterally. Thalamic volumes corresponding to the ventral anterior and ventrolateral nuclei were also significant; these are regions important for higher cognitive and motor functions via circuits with the frontal lobes (Royall et al., 2002). Correlations with the supplementary motor area, the precentral gyrus, the midbrain and dorsal pons, and the cerebellum might reflect the speeded measures included in the composite score. The extent of correlations with the cerebellum subsumed subregions important for cognitive, sensorimotor, and limbic functions (Stoodley & Schmahmann, 2010). Volumes of the left superior temporal and the left postcentral gyri were the only temporal and parietal regions to reach significance. The limited extent of correlations within posterior regions could be explained by the multi-faceted nature of the Executive Composite. That is, posterior regions important for fundamental cognitive skills such as processing verbal or visual information were central to some tasks but not others, and so the impact of these brain regions on the multi-domain composite was diminished. These findings suggest that the multi-domain Executive Composite may emphasize higher-level processes not specific to any one domain. It is also likely that the lack of significant correlations with posterior regions reflects the atrophy patterns of the patient sample. Atrophy patterns in PSP and bvFTD are frontally-predominant (Seeley et al., 2008; Whitwell et al., 2012). If we had included a sample of subjects with greater posterior disease, our findings may have been different. The extent to which the present findings generalize to other patient samples will need to be tested in future research.
To minimize the specific impact of bvFTD or PSP atrophy patterns on the neuroanatomical correlates, we repeated the voxel-based morphometry analyses once with the bvFTD patients removed and once with the PSP patients removed. Voxels that were significant in the full sample and in these subsidiary analyses were primarily in the right middle and superior frontal gyri and the left middle frontal gyri, but also in the right and left inferior frontal gyri and the right middle cingulate (Figure 1). We are most confident that these regions were important for Executive Composite performance irrespective of diagnosis. Prefrontal lesions have been associated with real world executive behavior decrements as measured by the FrSBe (Robinson, Calamia, Glascher, Bruss, & Tranel, this series), suggesting a common neural mechanism for executive impairments on testing and in everyday life.
The NIH EXAMINER Executive Composite is a single score that represents performance across 11 indices of executive functions including measures of inhibition, set-shifting, fluency, and working memory that rely to varying degrees on verbal, spatial, or visual stimuli. In this study, we found that the Executive Composite is a robust predictor of executive behavior in the real world and correlates with atrophy in frontal brain regions important for executive control. The Executive Composite is not the appropriate choice for all clinical and research questions about executive functions, for example, when time is limited (it is based on a 30 minute test battery) and a shorter test like Trails B is adequate. Furthermore, differential diagnosis and inferences about affected brain function is often better guided by the separate evaluation of discreet executive functions. It is, however, an appropriate choice when a single comprehensive score with high reliability, sensitivity to real-world executive dysfunction, linear measurement across the ability spectrum, or multiple alternate forms is needed.
Acknowledgements
This work was supported by NINDS (J.K., HHSN271200623661C); NIA (K.P., K23AG037566), (J.K., P01AG019724 and P50AG023501); and by the Hellman Family Foundation (K.P.). We thank Stephen Wilson, Ph.D., for his guidance on the voxel-based morphometry methods, and our research participants for their generous time and efforts. We have no conflicts of interest to report.
Abbreviations
- MFG
middle frontal gyrus
- SFG
superior frontal gyrus
- IFG
inferior frontal gyrus
- MCG
middle cingulate gyrus
References
- Ashburner J. A fast diffeomorphic image registration algorithm. Neuroimage. 2007;38(1):95–113. doi: 10.1016/j.neuroimage.2007.07.007. [DOI] [PubMed] [Google Scholar]
- Ashburner J, Friston KJ. Unified segmentation. Neuroimage. 2005;26(3):839–851. doi: 10.1016/j.neuroimage.2005.02.018. [DOI] [PubMed] [Google Scholar]
- Basso MR, Shields IS, Lowery N, Ghormley C, Combs D, Arnett PA, Johnson J. Self-reported executive dysfunction, neuropsychological impairment, and functional outcomes in multiple sclerosis. Journal of Clinical and Experimental Neuropsychology. 2008;30(8):920–930. doi: 10.1080/13803390801888733. [DOI] [PMC free article] [PubMed] [Google Scholar]
- Bates E, Wilson SM, Saygin AP, Dick F, Sereno MI, Knight RT, Dronkers NF. Voxel-based lesion-symptom mapping. Nature Neuroscience. 2003;6(5):448–450. doi: 10.1038/nn1050. [DOI] [PubMed] [Google Scholar]
- Bondi MW, Jak AJ, Delano-Wood L, Jacobson MW, Delis DC, Salmon DP. Neuropsychological contributions to the early identification of Alzheimer’s disease. Neuropsychology Review. 2008;18(1):73–90. doi: 10.1007/s11065-008-9054-1. [DOI] [PMC free article] [PubMed] [Google Scholar]
- Boyle PA, Paul RH, Moser DJ, Cohen RA. Executive impairments predict functional declines in vascular dementia. Clinical Neuropsychologist. 2004;18(1):75–82. doi: 10.1080/13854040490507172. [DOI] [PubMed] [Google Scholar]
- Brown PD, Buckner JC, O’Fallon JR, Iturria NL, Brown CA, O’Neill BP, Shaw EG. Effects of radiotherapy on cognitive function in patients with low-grade glioma measured by the folstein mini-mental state examination. Journal of Clinical Oncology. 2003;21(13):2519–2524. doi: 10.1200/JCO.2003.04.172. [DOI] [PubMed] [Google Scholar]
- Caeyenberghs K, Leemans A, Leunissen I, Gooijers J, Michiels K, Sunaert S, Swinnen SP. Altered structural networks and executive deficits in traumatic brain injury patients. Brain Structure & Function. 2012 doi: 10.1007/s00429-012-0494-2. Retrieved from http://link.springer.com/article/10.1007/s00429-012-0494-2/fulltext.html. [DOI] [PubMed] [Google Scholar]
- Cahn-Weiner DA, Farias ST, Julian L, Harvey DJ, Kramer JH, Reed BR, Chui H. Cognitive and neuroimaging predictors of instrumental activities of daily living. Journal of the International Neuropsychological Society. 2007;13(5):747–757. doi: 10.1017/S1355617707070853. [DOI] [PMC free article] [PubMed] [Google Scholar]
- Champod AS, Petrides M. Dissociation within the frontoparietal network in verbal working memory: a parametric functional magnetic resonance imaging study. Journal of Neuroscience. 2010;30(10):3849–3856. doi: 10.1523/JNEUROSCI.0097-10.2010. [DOI] [PMC free article] [PubMed] [Google Scholar]
- Chiaravalloti ND, DeLuca J. Assessing the behavioral consequences of multiple sclerosis: an application of the Frontal Systems Behavior Scale (FrSBe) Cognitive and Behavioral Neurology. 2003;16(1):54–67. doi: 10.1097/00146965-200303000-00007. [DOI] [PubMed] [Google Scholar]
- Clark L, Cools R, Robbins TW. The neuropsychology of ventral prefrontal cortex: decision-making and reversal learning. Brain and Cognition. 2004;55(1):41–53. doi: 10.1016/S0278-2626(03)00284-7. [DOI] [PubMed] [Google Scholar]
- Coles AJ, Twyman CL, Arnold DL, Cohen JA, Confavreux C, Fox EJ, Compston DA. Alemtuzumab for patients with relapsing multiple sclerosis after disease-modifying therapy: a randomised controlled phase 3 trial. Lancet. 2012;380(9856):1829–1839. doi: 10.1016/S0140-6736(12)61768-1. [DOI] [PubMed] [Google Scholar]
- Correa DD. Neurocognitive function in brain tumors. Current Neurology and Neuroscience Reports. 2010;10(3):232–239. doi: 10.1007/s11910-010-0108-4. [DOI] [PubMed] [Google Scholar]
- Cummings J, Miller BL. Conceptual and clinical aspects of the frontal lobes. In: Miller BL, Cummings JL, editors. The Human Frontal Lobes. The Guilford Press; New York: 2007. pp. 12–24. [Google Scholar]
- Diamond A. Normal development of prefrontal cortex from birth to young adulthood: Cognitive functions, anatomy, and biochemistry. In: Knight DTSRT, editor. Principles of Frontal Lobe Function. Oxford University Press; London, UK: 2002. pp. 466–503. [Google Scholar]
- Farias ST, Cahn-Weiner DA, Harvey DJ, Reed BR, Mungas D, Kramer JH, Chui H. Longitudinal changes in memory and executive functioning are associated with longitudinal change in instrumental activities of daily living in older adults. Clinical Neuropsychologist. 2009;23(3):446–461. doi: 10.1080/13854040802360558. [DOI] [PMC free article] [PubMed] [Google Scholar]
- Friston KJ, Ashburner J, Kiebel S, Nichols T, Penny W. Statistical parametric mapping. Academic Press; London: 2007. [Google Scholar]
- Grace J, Malloy PF. Frontal systems behavior scale (FrSBe): professional manual. Psychological Assessment Resources; Lutz, FL: 2001. [Google Scholar]
- Hayes S, Donnellan C, Stokes E. Associations between executive function and physical function poststroke: a pilot study. Physiotherapy. 2012;99(2):165–71. doi: 10.1016/j.physio.2012.05.002. [DOI] [PubMed] [Google Scholar]
- Hellmuth J, Mirsky J, Heuer HW, Matlin A, Jafari A, Garbutt S, Boxer AL. Multicenter validation of a bedside antisaccade task as a measure of executive function. Neurology. 2012;78(23):1824–1831. doi: 10.1212/WNL.0b013e318258f785. [DOI] [PMC free article] [PubMed] [Google Scholar]
- Kramer JH, Jurik J, Sha SJ, Rankin KP, Rosen HJ, Johnson JK, Miller BL. Distinctive neuropsychological patterns in frontotemporal dementia, semantic dementia, and Alzheimer disease. Cognitive and Behavioral Neurology. 2003;16(4):211–218. doi: 10.1097/00146965-200312000-00002. [DOI] [PubMed] [Google Scholar]
- Kramer JH, Mungas D, Possin KL, Rankin KP, Boxer AL, Rosen HJ, Windmeyer M. NIH EXAMINER: Conceptualization and Development of an Executive Function Battery. doi: 10.1017/S1355617713001094. This series. [DOI] [PMC free article] [PubMed] [Google Scholar]
- Lane-Brown AT, Tate RL. Measuring apathy after traumatic brain injury: Psychometric properties of the Apathy Evaluation Scale and the Frontal Systems Behavior Scale. Brain Injury. 2009;23(13-14):999–1007. doi: 10.3109/02699050903379347. [DOI] [PubMed] [Google Scholar]
- Lezak MD, Howieson DB, Bigler ED, Tranel D. Neuropsychological Assessment. 5th ed Oxford University Press; 2012. [Google Scholar]
- Little DM, Kraus MF, Joseph J, Geary EK, Susmaras T, Zhou XJ, Gorelick PB. Thalamic integrity underlies executive dysfunction in traumatic brain injury. Neurology. 2010;74(7):558–564. doi: 10.1212/WNL.0b013e3181cff5d5. [DOI] [PMC free article] [PubMed] [Google Scholar]
- Litvan I, Agid Y, Calne D, Campbell G, Dubois B, Duvoisin RC, Zee DS. Clinical research criteria for the diagnosis of progressive supranuclear palsy (Steele-Richardson-Olszewski syndrome): report of the NINDS-SPSP international workshop. Neurology. 1996;47(1):1–9. doi: 10.1212/wnl.47.1.1. [DOI] [PubMed] [Google Scholar]
- Malloy P, Grace J. A review of rating scales for measuring behavior change due to frontal systems damage. Cognitive and Behavioral Neurology. 2005;18(1):18–27. doi: 10.1097/01.wnn.0000152232.47901.88. [DOI] [PubMed] [Google Scholar]
- Malloy P, Tremont G, Grace J, Frakey L. The Frontal Systems Behavior Scale discriminates frontotemporal dementia from Alzheimer’s disease. Alzheimer’s & Dementia: the Journal of the Alzheimer’s Association. 2007;3(3):200–203. doi: 10.1016/j.jalz.2007.04.374. [DOI] [PubMed] [Google Scholar]
- McDonald BC, Flashman LA, Saykin AJ. Executive dysfunction following traumatic brain injury: neural substrates and treatment strategies. NeuroRehabilitation. 2002;17(4):333–344. [PubMed] [Google Scholar]
- McKhann GM, Knopman DS, Chertkow H, Hyman BT, Jack CR, Jr., Kawas CH, Phelps CH. The diagnosis of dementia due to Alzheimer’s disease: recommendations from the National Institute on Aging-Alzheimer’s Association workgroups on diagnostic guidelines for Alzheimer’s disease. Alzheimer’s & Dementia: the Journal of the Alzheimer’s Association. 2011;7(3):263–269. doi: 10.1016/j.jalz.2011.03.005. [DOI] [PMC free article] [PubMed] [Google Scholar]
- Muslimovic D, Post B, Speelman JD, Schmand B. Cognitive profile of patients with newly diagnosed Parkinson disease. Neurology. 2005;65(8):1239–1245. doi: 10.1212/01.wnl.0000180516.69442.95. [DOI] [PubMed] [Google Scholar]
- Parmenter BA, Shucard JL, Shucard DW. Information processing deficits in multiple sclerosis: a matter of complexity. Journal of the International Neuropsychological Society. 2007;13(3):417–423. doi: 10.1017/S1355617707070580. [DOI] [PubMed] [Google Scholar]
- Peinemann A, Schuller S, Pohl C, Jahn T, Weindl A, Kassubek J. Executive dysfunction in early stages of Huntington’s disease is associated with striatal and insular atrophy: a neuropsychological and voxel-based morphometric study. Journal of the Neurological Sciences. 2005;239(1):11–19. doi: 10.1016/j.jns.2005.07.007. [DOI] [PubMed] [Google Scholar]
- Polman CH, Reingold SC, Edan G, Filippi M, Hartung HP, Kappos L, Wolinsky JS. Diagnostic criteria for multiple sclerosis: 2005 revisions to the “McDonald Criteria”. Annals of Neurology. 2005;58(6):840–846. doi: 10.1002/ana.20703. [DOI] [PubMed] [Google Scholar]
- Possin KL, Feigenbaum D, Rankin KP, Smith GE, Boxer AL, Wood K, Kramer JH. Dissociable executive functions in behavioral variant frontotemporal and Alzheimer’s dementias. Neurology. 2013 doi: 10.1212/WNL.0b013e318296e940. http://www.neurology.org/content/early/2013/05/08/WNL.0b013e318296e940.abstract. [DOI] [PMC free article] [PubMed] [Google Scholar]
- Provost JS, Petrides M, Monchi O. Dissociating the role of the caudate nucleus and dorsolateral prefrontal cortex in the monitoring of events within human working memory. European Journal of Neuroscience. 2010;32(5):873–880. doi: 10.1111/j.1460-9568.2010.07333.x. [DOI] [PubMed] [Google Scholar]
- Rabin LA, Barr WB, Burton LA. Assessment practices of clinical neuropsychologists in the United States and Canada: a survey of INS, NAN, and APA Division 40 members. Archives of Clinical Neuropsychology. 2005;20(1):33–65. doi: 10.1016/j.acn.2004.02.005. [DOI] [PubMed] [Google Scholar]
- Rascovsky K, Hodges JR, Knopman D, Mendez MF, Kramer JH, Neuhaus J, Miller BL. Sensitivity of revised diagnostic criteria for the behavioural variant of frontotemporal dementia. Brain. 2011;134(Pt 9):2456–77. doi: 10.1093/brain/awr179. [DOI] [PMC free article] [PubMed] [Google Scholar]
- Reitan RM. The relation of the trail making test to organic brain damage. Journal of Consulting Psychology. 1955;19(5):393–394. doi: 10.1037/h0044509. [DOI] [PubMed] [Google Scholar]
- Robinson H, Calamia M, Glascher J, Bruss J, Tranel D. Neuroanatomical correlates of executive functions: A neuropsychological approach using the EXAMINER battery. Journal of the International Neuropsychological Society. doi: 10.1017/S135561771300060X. (this series) [DOI] [PMC free article] [PubMed] [Google Scholar]
- Rolls ET. The functions of the orbitofrontal cortex. Brain and Cognition. 2004;55(1):11–29. doi: 10.1016/S0278-2626(03)00277-X. [DOI] [PubMed] [Google Scholar]
- Royall DR, Lauterbach EC, Cummings JL, Reeve A, Rummans TA, Kaufer DI, Coffey CE. Executive control function: a review of its promise and challenges for clinical research. A report from the Committee on Research of the American Neuropsychiatric Association. Journal of Neuropsychiatry and Clinical Neurosciences. 2002;14(4):377–405. doi: 10.1176/jnp.14.4.377. [DOI] [PubMed] [Google Scholar]
- Sachdev PS, Brodaty H, Valenzuela MJ, Lorentz L, Looi JC, Wen W, Zagami AS. The neuropsychological profile of vascular cognitive impairment in stroke and TIA patients. Neurology. 2004;62(6):912–919. doi: 10.1212/01.wnl.0000115108.65264.4b. [DOI] [PubMed] [Google Scholar]
- Salthouse TA. Relations between cognitive abilities and measures of executive functioning. Neuropsychology. 2005;19(4):532–545. doi: 10.1037/0894-4105.19.4.532. [DOI] [PubMed] [Google Scholar]
- Schmahmann JD, Pandya DN. Disconnection syndromes of basal ganglia, thalamus, and cerebrocerebellar systems. Cortex. 2008;44(8):1037–1066. doi: 10.1016/j.cortex.2008.04.004. [DOI] [PMC free article] [PubMed] [Google Scholar]
- Seeley WW, Crawford R, Rascovsky K, Kramer JH, Weiner M, Miller BL, Gorno-Tempini ML. Frontal paralimbic network atrophy in very mild behavioral variant frontotemporal dementia. Archives of Neurology. 2008;65(2):249–255. doi: 10.1001/archneurol.2007.38. [DOI] [PMC free article] [PubMed] [Google Scholar]
- Stoodley CJ, Schmahmann JD. Evidence for topographic organization in the cerebellum of motor control versus cognitive and affective processing. Cortex. 2010;46(7):831–844. doi: 10.1016/j.cortex.2009.11.008. [DOI] [PMC free article] [PubMed] [Google Scholar]
- Stuss DT, Levine B. Adult clinical neuropsychology: lessons from studies of the frontal lobes. Annual Review of Psychology. 2002;53:401–433. doi: 10.1146/annurev.psych.53.100901.135220. [DOI] [PubMed] [Google Scholar]
- Torralva T, Kipps CM, Hodges JR, Clark L, Bekinschtein T, Roca M, Manes F. The relationship between affective decision-making and theory of mind in the frontal variant of fronto-temporal dementia. Neuropsychologia. 2007;45(2):342–349. doi: 10.1016/j.neuropsychologia.2006.05.031. [DOI] [PubMed] [Google Scholar]
- Van der Werf YD, Scheltens P, Lindeboom J, Witter MP, Uylings HB, Jolles J. Deficits of memory, executive functioning and attention following infarction in the thalamus; a study of 22 cases with localised lesions. Neuropsychologia. 2003;41(10):1330–1344. doi: 10.1016/s0028-3932(03)00059-9. [DOI] [PubMed] [Google Scholar]
- Velligan DI, Ritch JL, Sui D, DiCocco M, Huntzinger CD. Frontal Systems Behavior Scale in schizophrenia: relationships with psychiatric symptomatology, cognition and adaptive function. Psychiatry Research. 2002;113(3):227–236. doi: 10.1016/s0165-1781(02)00264-0. [DOI] [PubMed] [Google Scholar]
- Vercelletto M, Boutoleau-Bretonniere C, Volteau C, Puel M, Auriacombe S, Sarazin M, Lacomblez L. Memantine in behavioral variant frontotemporal dementia: negative results. Journal of Alzheimer’s Disease. 2011;23(4):749–759. doi: 10.3233/JAD-2010-101632. [DOI] [PubMed] [Google Scholar]
- Whitwell JL, Duffy JR, Strand EA, Machulda MM, Senjem ML, Gunter JL, Josephs KA. Neuroimaging comparison of primary progressive apraxia of speech and progressive supranuclear palsy. European Journal of Neurology. 2012;20(4):629–37. doi: 10.1111/ene.12004. [DOI] [PMC free article] [PubMed] [Google Scholar]
- Willmott C, Ponsford J. Efficacy of methylphenidate in the rehabilitation of attention following traumatic brain injury: a randomised, crossover, double blind, placebo controlled inpatient trial. Journal of Neurology, Neurosurgery and Psychiatry. 2009;80(5):552–557. doi: 10.1136/jnnp.2008.159632. [DOI] [PubMed] [Google Scholar]
- Wilson SM, Henry ML, Besbris M, Ogar JM, Dronkers NF, Jarrold W, Gorno-Tempini ML. Connected speech production in three variants of primary progressive aphasia. Brain. 2010;133(Pt 7):2069–88. doi: 10.1093/brain/awq129. [DOI] [PMC free article] [PubMed] [Google Scholar]
- Winblad B, Palmer K, Kivipelto M, Jelic V, Fratiglioni L, Wahlund LO, Petersen RC. Mild cognitive impairment--beyond controversies, towards a consensus: report of the International Working Group on Mild Cognitive Impairment. Journal of Internal Medicine. 2004;256(3):240–246. doi: 10.1111/j.1365-2796.2004.01380.x. [DOI] [PubMed] [Google Scholar]
- Yin X, Zhao L, Xu J, Evans AC, Fan L, Ge H, Liu S. Anatomical substrates of the alerting, orienting and executive control components of attention: focus on the posterior parietal lobe. PloS One. 2012;7(11):e50590. doi: 10.1371/journal.pone.0050590. [DOI] [PMC free article] [PubMed] [Google Scholar]