Fig. 3.
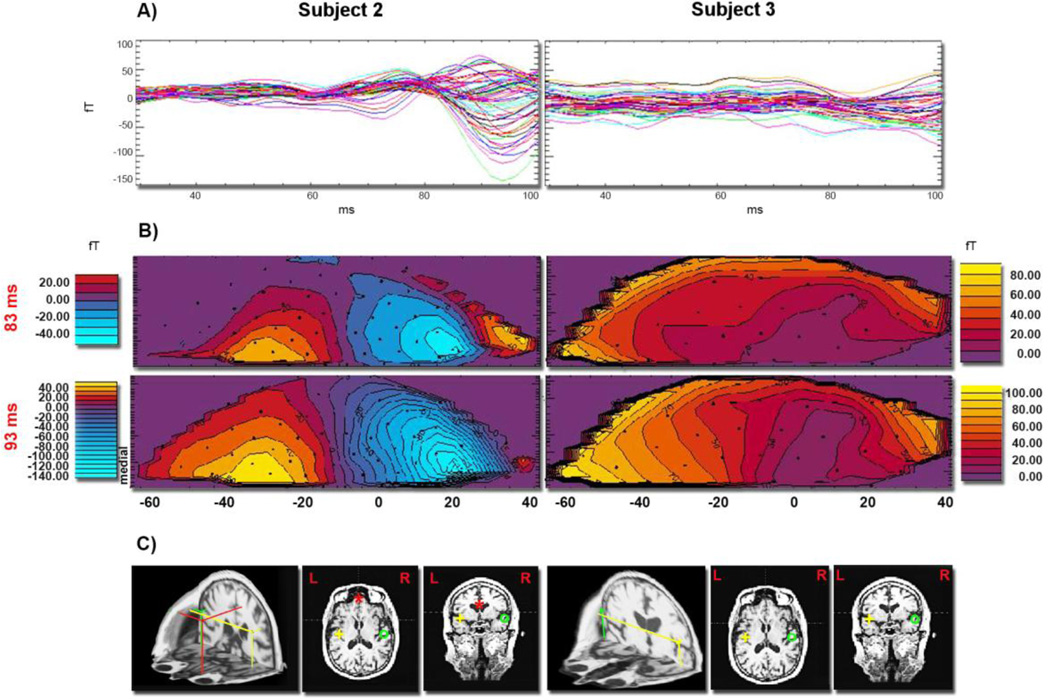
A) AEFs from the standard tone are shown superimposed from the frontal MEG channels (from MLF11 to MLF64) during the 30–100 ms time interval for two representative subjects, S2 and S3. Each tracing represents an average of 400 individual evoked responses. AEF waveforms obtained from the frontal sensors of subject S2 have a characteristic multi-peak pattern in contrast to the waveforms obtained from the same sensors of subject S3. Panel B) shows iso-field color-coded maps of the neuromagnetic responses recorded at frontal gradiometers evoked by the standard tone at two time points showing the Mb2 component of the M50 complex (around 85 ms), for two subjects. Black dots indicate sensor positions. The formation of a dipolar pattern in frontal regions of subject S2 is clearly missing in the corresponding iso-field maps of subject S3. Fragments of right STG activity are also visible in the field maps of subject S2. In panel C) the best fitting sources estimated in the 30–100 ms time interval evoked by the standard tone are shown for subjects S2 and S3 in 3-D and horizontal and coronal 2-D views. While both subjects revealed activation of bilateral STG generators, the frontal source localized in subject S2 was lacking in subject S3.

