Abstract
Previous experiments performed in recombinant systems have suggested that protein–protein interactions occur between the UGTs and may play a significant role in modulating enzyme activity. However, evidence of UGT protein–protein interactions either in vivo or in more physiologically relevant in vitro systems has yet to be demonstrated. In this study, we examined oligomerization and its ability to affect glucuronidation in plated human hepatocytes. siRNA down regulation experiments and activity studies were used to examine changes in metabolite formation of one UGT isoform due to down regulation of a second UGT isoform. Selective siRNA directed towards UGT1A9 or UGT2B7 resulted in significant and selective decreases in their respective mRNA levels. As expected, the metabolism of the UGT1A9 substrate propofol decreased with UGT1A9 down regulation. Interestingly, UGT1A9 activity, but not UGT1A9 mRNA expression, was also diminished when UGT2B7 expression was selectively inhibited, implying potential interactions between the two isoforms. Minor changes to UGT1A4, UGT2B4 and UGT2B7 activity were also observed when UGT1A9 expression was selectively down regulated. To our knowledge, this represents the first piece of evidence that UGT protein–protein interactions occur in human hepatocytes and suggests that expression levels of UGT2B7 may directly impact the glucuronidation activity of selective UGT1A9 substrates.
Keywords: UDP-Glucuronosyltransferase, siRNA, Protein interactions, Hepatocytes
Introduction
The UDP-Glucuronosyltransferases (UGTs)2 are membrane bound proteins localized to the endoplasmic reticulum. This super-family of enzymes catalyzes the formation of glucuronides by the transfer of glucuronic acid from the co-substrate uridine 5′-diphosphoglucuronic acid (UDPGA) to many endogenous and exogenous substrates, making them more suitable for excretion into the urine or bile [1,2]. UGTs often work in concert with other key enzymes involved in drug metabolism, such as the cytochrome P450s (CYP). The CYPs perform oxidation or reduction reactions to either activate or detoxify the parent compound. These metabolites can then be further detoxified through conjugation reactions, carried out by the UGTs or other Phase II drug metabolizing enzymes, including the N-acetyltransferases, sulfotransferases, and glutathione S-transferases. There is accumulating evidence suggesting that protein–protein interactions occur between these enzymes and that these interactions play a significant role in modulating enzyme activity [3–12]. Co-localization and protein–protein interactions between drug metabolizing enzymes allows concerted metabolism to occur more efficiently [13]. Several studies also suggest that the UGTs themselves dimerize and are functional as dimers in monoglucuronide formation or as tetramers in diglucuronide formation [14]. It is the highly variable, substrate binding N-terminus that has generally been implicated in these protein–protein interactions, though evidence exists that the C-terminus may also have a role [15,16]. Disrupting these interactions has been known to alter Km values and substrate binding specificity [17]. However, while dimerization has been studied extensively utilizing recombinant systems, it has yet to be examined in a more physiologically relevant in vitro system. The ability to study UGT protein–protein interactions in human hepatocytes may be valuable in identifying potential disconnects between UGT enzymology in single enzyme versus whole cell systems and in evaluating whether UGT dimerization is a physiologically relevant phenomena or simply an in vitro artifact.
The objective of this current work was to utilize selective siRNA down regulation to study the effects of UGT1A9-UGT2B7 protein interactions on glucuronidation activity in human hepatocytes. In the absence of selective UGT inhibitors, the use of siRNA technology provides a tool to selectively silence individual UGT isoforms, which should allow for the assessment of changes in the enzyme activity both of the targeted UGT as well as other UGTs which may interact on a protein level with the silenced UGT. Co-expression of UGT1A9 and UGT2B7 in HEK cells has previously been shown to enhance the activity of both propofol and morphine glucuronidation when compared to singly expressed systems and as such, UGT1A9 and UGT2B7 represent a rational starting point for the evaluation of UGT protein interactions in human hepatocytes. Multiple siRNA primers were evaluated and quantitative PCR analysis was used to verify selective down regulation of two UGT isoforms previously shown to be involved in protein–protein interactions. Finally, changes in metabolite formation in hepatocytes treated with siRNA were measured by LC-MS/MS in order to assess the functional impact of silencing UGT expression on both the UGT isoform of interest as well as on isoforms that may interact with the down regulated UGT.
Experimental
Materials
All chemicals were purchased from Sigma–Aldrich (St. Louis, MO) unless specified otherwise. Recombinant UGT Supersomes were purchased from BD Biosciences (San Jose, CA). Cryopreserved plateable human hepatocytes (Donor 4151, Donor 4199, Donor 4237) were purchased from Life Technologies (Carlsbad, CA). BIO-COAT Cell Environmental Collagen I Cellware 96 well plates were obtained from BD Biosciences (San Jose, CA). In Vitro GRO CP Plating Medium and Torpedo antibiotic mix was purchased from Celsis (Chicago, IL). Silencer Select Predesigned siRNA oligos were obtained from Ambion (Austin, TX). Lipofectamine, Dulbecco’s Modified Eagle Medium (DMEM), maintenance media supplements (100 U/mL penicillin and streptomycin, 6.25 μg/mL insulin, 6.25 μg/mL transferrin, 6.25 ng/mL selenous acid, 1.25 mg/mL bovine serum albumin, 5.35 μg/mL linoleic acid, 2 mM GlutaMAX™, 15 mM HEPES, pH 7.4), and RNAiMax Reagent were purchased from Invitrogen (Carlsbad, CA). Propofol glucuronide was purchased from Santa Cruz Biotechnology, Inc. (Santa Cruz, CA).
Assessment of propofol glucuronidation in recombinant UGTs
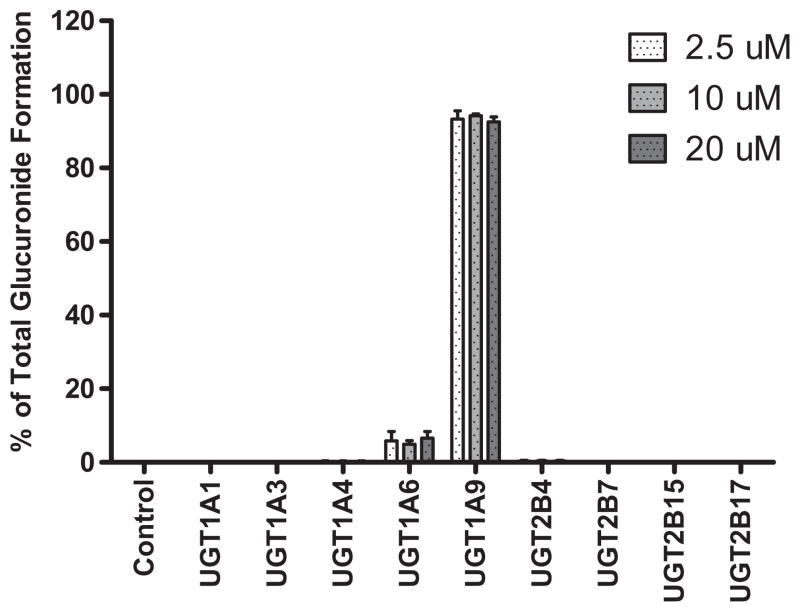
Glucuronidation of propofol was evaluated against recombinantly expressed human hepatic UGT enzymes preparations (1A1, 1A3, 1A4, 1A6, 1A9, 2B4, 2B7, 2B15, 2B17). UGT enzymes (0.05 mg) were activated by pre-incubating with alamethicin (25 μg/mg) in 50 mM Tris buffer on ice for 30 min. At the end of the pre-incubation period, incubation mixtures were diluted with purified water and propofol was added to achieve a final concentration of 2.5, 10 or 20 μM. Following a second pre-incubation period (5 min) at 37 °C, reactions were initiated by addition of UDPGA (1 mM, final concentration) and incubated for 30 min at 37 °C (100 μL final incubation volume). Control incubations with inactive microsomes (prepared from membranes not expressing UGT enzyme) were treated identically as described above. Reactions were terminated by addition of 200 μL acetonitrile containing formic acid (0.1%, v/v) and 0.1 μM tolbutamide as an internal standard. Following centrifugation (10 min × 1460g) the resulting supernatants were transferred to 96-well plates and analyzed for the presence of propofol glucuronide by mass spectrometry (LC-MS/MS). Data is plotted as the percent of total glucuronide formation (amount of glucuronide formation by a single UGT as a fraction of the total glucuronide formation for all UGTs).
Plating and transfection of human hepatocytes
Cryopreserved plateable human hepatocytes from three individual donors (Hu4199, Hu4237, and Hu4151) were placed in a 37 °C water bath until thawed and then quickly transferred to fresh, pre-warmed In Vitro GRO CP media, supplemented with Torpedo antibiotics. Viable cell count was determined using the Trypan Blue exclusion method or by automated cell counting with brightfield and fluorescent cell imaging on a Hepatometer Vision (Triangle Research Labs, Research Triangle Park, NC). Human hepatocytes were then plated on collagen coated, 96-well plates, at a density of 0.7 × 10⁶ viable cells/mL and allowed to attach for 2–4 h.
Prior to performing siRNA transfection experiments in human hepatocytes, multiple siRNA primers were assessed for both down regulation of the target gene as well as for selectivity versus UGT1A9 or UGT2B7. The final siRNA sequences were chosen for their efficient and selective down regulation of the target gene. For transfection, 25 μM UGT2B7 siRNA (Ambion s14651; 5′ → 3′ sequence, CATTGAAGAGTAATTAA) and 50 μM UGT1A9 siRNA (Ambion s29248; 5′ → 3′ sequence, CGATCCTTTTGATAACTGT) stock solutions were prepared and each siRNA stock solution was separately added to conical tubes containing OPTIMEM, yielding working siRNA concentrations of 1.0 μM for UGT1A9 oligos and 0.5 μM for UGT2B7 oligos. Lipofectamine transfection reagent (50×) was diluted in a separate conical tube containing OPTIMEM to achieve a 1× solution. The diluted transfection reagent was added to each siRNA to achieve siRNA concentrations of 0.5 μM for UGT1A9 and 0.25 μM for UGT2B7 and the mixture incubated at room temperature for 1 h with occasional mixing.
Plating media was removed from hepatocytes and cells were washed with maintenance media (DMEM plus maintenance media supplements), prior to the addition of the siRNA and transfection reagent mixture, giving a final siRNA concentration of 100 nM for UGT1A9 and 50 nM for UGT2B7. Cells were transfected with siRNA for a 72 h period, which was previously determined to be optimal in regard to transfection efficiency and cellular integrity (data not shown). Cell media was refreshed every 24 h with pre-warmed maintenance media.
Assessment of siRNA down regulation
RNA was isolated using the Ambion Total RNA Isolation Kit with Applied Biosystems MagMax Express 96 Magnetic Particle Processor. TaqMan® Probe-Based Gene Expression Analysis was used to quantify siRNA oligo efficiency and selectivity. RNA quantity was assessed using a NanoDrop (Thermo Scientific, Wilmington, DE). All RNA samples were then normalized to 5 ng/μL with nuclease free water. cDNA was synthesized using the high capacity cDNA Reverse Transcription kit (Applied Biosystems, Foster City, CA) with a final volume of 20 μL and 66 ng total RNA according to manufacturer’s protocol. After synthesis, the cDNA reactions were diluted to 160 μL total volume with nuclease free water. TaqMan reactions were run on a 7900HT Real-time PCR system in a 384- well optical reaction plate. Each reaction contained 10 μL 2× Gene Expression Master Mix, 5 μL nuclease free water, 1 μL 20× Primer and Probe mix, and 4 μL of cDNA. All reactions were run in duplicate using default cycling parameters. The endogenous control used was 18S1 (TaqMan assay ID Hs03928985_g1). Assay ID numbers for the UGT TaqMan assays are as follows: UGT1A1, Hs02511055_s1; UGT1A3, Hs01592480_m1; UGT1A4, Hs01592480_m1; UGT1A6, Hs01592477_m1; UGT1A9, Hs0251 6855_sH; UGT2B4, Hs00607514_mH; UGT2B7, Hs00426592_m1. UGT expression was normalized to expression of the endogenous control 18S1 in each individual well prior to statistical analysis. Control data (100% of control expression) defines the expression of each respective mRNA in the absence of siRNA treatment and after normalization to the 18S1 control. Standard deviations were calculated from the standard deviations of the expression values for both the target UGT of interest and the 18S1 control as noted in Eq. 1:
| (1) |
UGT activity assays
Following siRNA transfection, hepatocytes were incubated with multiple concentrations of selective UGT probe substrates for 1 h, conditions which had previously been shown to be linear with respect to incubation time and cell count (data not shown). Probe substrates included estradiol (UGT1A1, 0–250 μM), fulvestrant (UGT1A3, 0–250 μM), trifluoperazine (UGT1A4, 0–250 μM), serotonin (UGT1A6, 0–100 μM), propofol (UGT1A9, 0–250 μM), hyodeoxycholic acid (UGT2B4, 0–500 μM) and morphine (UGT2B7, 0– 500 μM) [18–20]. Probe substrates were dissolved in DMSO and subsequently diluted into incubation media prior to addition to the hepatocyte cultures in order to maintain a DMSO concentration of less than 0.1% (v/v). The reaction was then quenched by transferring 100 μL of cell media to a deep well plate containing tolbutamide (0.1 μM) as an internal standard in acetonitrile. Samples were then centrifuged at 3000 rpm for 10 min and transferred to a second 96-well plate for LC-MS/MS analysis. Kinetic parameters were determined using GraphPad Prism (V 5.04; GraphPad Software Inc., San Diego) and fit to either a Michaelis–Menten (Eq. 2) or substrate inhibition model (Eq. 3).
| (2) |
| (3) |
The inhibitory properties of propofol and propofol glucuronide were assessed in human hepatocytes using 2,6-dimethylphenol, a structural analog of propofol and probe substrate for UGT1A9 [21,22]. Following siRNA transfection and successful down regulation of UGT1A9 and UGT2B7, plated human hepatocytes were incubated with 25 μM 2,6-dimethylphenol and varying concentrations of propofol or propofol glucuronide (0–500 μM) for 1 h, experimental conditions which were chosen to assure linear reaction kinetics and a concentration of 2,6-demethylphenol which was below its determined Km value in hepatocytes (data not shown). Reactions were quenched and prepared for LC-MS/MS analysis as described above.
Liquid chromatography/tandem mass spectral analysis of glucuronide formation
Measurement of glucuronide metabolites was performed using LC-MS/MS technology. The LC-MS/MS system consists of an Applied Biosystems 4000 Q-Trap spectrometer (operated in triple quadrupole mode) equipped with an electrospray ionization source (Applied Biosystems, Foster City, CA). The MS/MS system was coupled to two LC-20AD pumps with an in-line CBM-20A controller and DGU-20A5 solvent degasser (Shimadzu, Columbia, MD) and a LEAP CTC HTS PAL autosampler equipped with a dual-solvent self-washing system (CTC Analytics, Carrboro, NC). The injection volume was 20 μl for each analyte. HPLC separation for estradiol, trifluoperazine, propofol, and hyodeoxycholic acid glucuronides was achieved using a Gemini C18 2.0 × 30 mm 5 μm column (Phenomenex, Torrance, CA). Gradient elution (flow rate = 500 μl/min) was performed using a mobile phase system consisting of (A) water with 0.1% formic acid and (B) acetonitrile with 0.1% formic acid. The gradient conditions were 5% B for 1.0 min, increasing to 100% B from 1.0 to 3.0 min, holding at 100% B from 3.0 to 3.75 min, and returning to 5% B from 3.75 to 5.0 min. HPLC separation for fulvestrant, serotonin and morphine glucuronides was achieved using a Luna C18 2.0 × 150 mm 5 μm column (Phenomenex, Torrance, CA) and a flow rate of 300 μL/min. Separation conditions utilized the same mobile phase system as noted above with gradient conditions of 2.5% B for 5.0 min, increasing to 100% B from 5.0 to 6.0 min, holding at 100% B from 6.0 to 7.0 min, returning to 2.5% B from 7.0 to 7.5 min and holding at 2.5% B from 7.5 to 10 min. HPLC flow was diverted from the MS/MS system for the first 20 s to remove any nonvolatile salts. Generic mass spectrometry parameters included the curtain gas (12 arbitrary units), collision-assisted dissociation gas (medium), ion spray voltage (4500 V), source temperature (500 °C), and ion source gas 1 and gas 2 (40 arbitrary units each). Multiple reaction monitoring mass transitions (Q1 → Q3) were 447.0 → 271.1 for estradiol (negative ion), 783.4 → 546.3 for fulvestrant glucuronide (positive ion), 584.6 → 408.9 for trifluoperazine glucuronide (positive ion), 353.2 → 336.1 for serotonin glucuronide (positive ion), 352.9 → 176.9 for propofol glucuronide (negative ion), 567.2 → 175.0 for hyodeoxycholic acid glucuronide (negative ion), 462.2 → 286.2 for morphine glucuronide (positive ion), 271.2 → 91.1 for tolbutamide (positive ion) and 268.9 → 169.7 for tolbutamide (negative ion). Quantitation of propofol glucuronide was achieved by comparing peak areas in unknown samples to a standard curve of propofol glucuronide from 5 to 2000 ng/mL and weighted using 1/x scaling factor. All other probe substrate activities were qualitatively assessed as a ratio of the analyte to internal standard peak areas.
Results
Propofol glucuronidation in recombinant UGTs
Phenotyping experiments designed to characterize the enzymes responsible for the glucuronidation of propofol at therapeutically relevant concentrations were carried out using UGT Supersomes. At final substrate concentrations of 2.5, 10 or 20 μM, incubations with UGT1A9 accounted for the majority of propofol glucuronide formation in vitro. Incubations with UGT1A6 resulted in a minor amount of propofol glucuronide formation, while those with UGT1A1, UGT1A3, UGT1A4, UGT2B4, UGT2B7, UGT2B15 or UGT2B17 did not result in the detectable formation of propofol glucuronide (Fig. 1). Data was normalized to the total glucuronide formed by all UGT isoforms.
Fig. 1.
Glucuronidation of propofol in recombinant UGTs at therapeutically relevant concentrations.
siRNA characterization
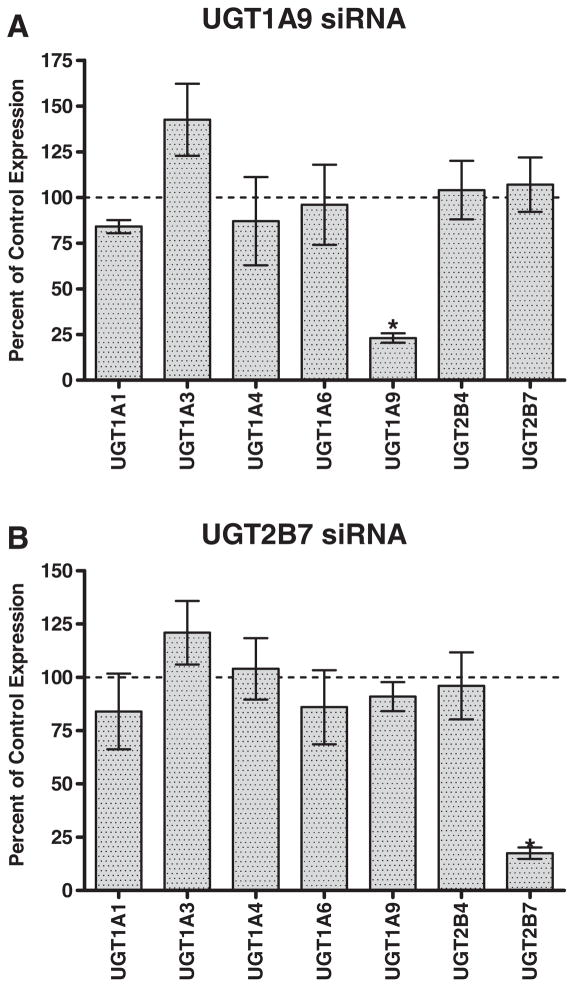
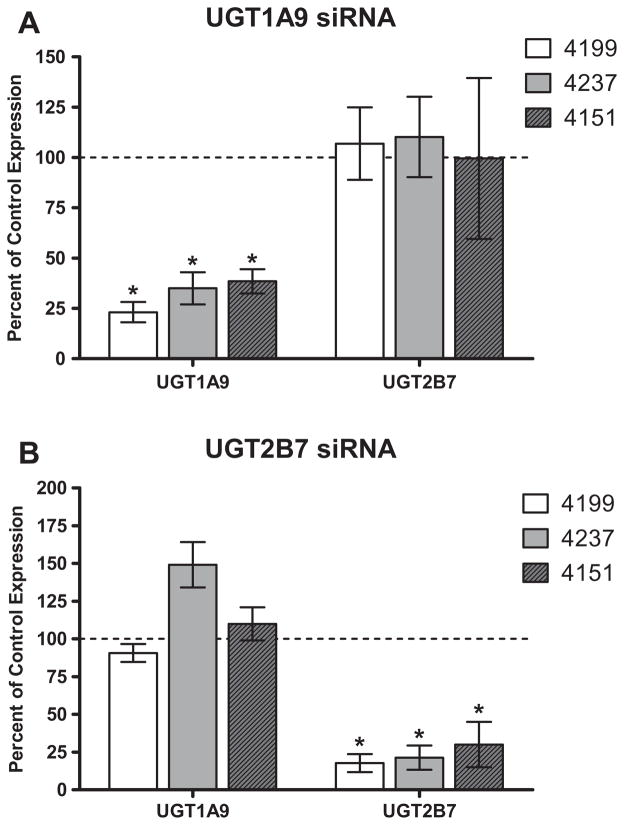
UGT1A9 and UGT2B7 were chosen for selective siRNA down regulation because these isoforms have been previously implicated in several dimerization studies [23]. Three oligo sets for each of the two isoforms were tested for down regulation efficiency and selectivity (data not shown). Quantitative PCR analysis was used to assess relative expression of different UGT isoforms post-transfection and confirmed the successful, selective down regulation of only the desired target gene. In each case, expression of the targeted UGT isoform was reduced to less than 20% of control expression, with minimal changes to the expression of other UGT isoforms (Fig. 2A and B). Individual donor variation in siRNA down regulation was minimal for the three individual donors examined (Fig. 3A and B). Though increased variability in the data was observed due to incorporating the standard deviations of both the UGT of interest as well as the 18S1 endogenous control to calculate the final standard deviation (Eq. 1), changes in UGT mRNA expression did not reach statistical significance except for the expected isoforms (p < 0.0001).
Fig. 2.
siRNA down regulation of UGT1A9 and UGT2B7 in human hepatocytes. Quantitative PCR analysis data for transfection with (a) UGT1A9 or (b) UGT2B7 siRNA indicates selective down regulation of the intended target gene. Control data (100% of control expression) defines the expression of each respective mRNA in the absence of siRNA treatment and after normalization to the 18S1 control. An asterisk (*) indicates a statistically significant difference, where p < 0.0001. Error bars indicate the standard deviation for replicate incubations (n = 3).
Fig. 3.
Individual donor variation in siRNA down regulation for three individual donors examined. Quantitative PCR analysis data for transfection with (a) UGT1A9 or (b) UGT2B7 siRNA, indicates selective down regulation of the intended target gene, with minimal variation among hepatocyte donors (Hu4199, Hu4237, and Hu4151). An asterisk (*) indicates a statistically significant difference, where p < 0.001. Error bars indicate the standard deviation for replicate incubations (n = 3).
Inhibition of UGT glucuronidation by siRNA down regulation in human hepatocytes
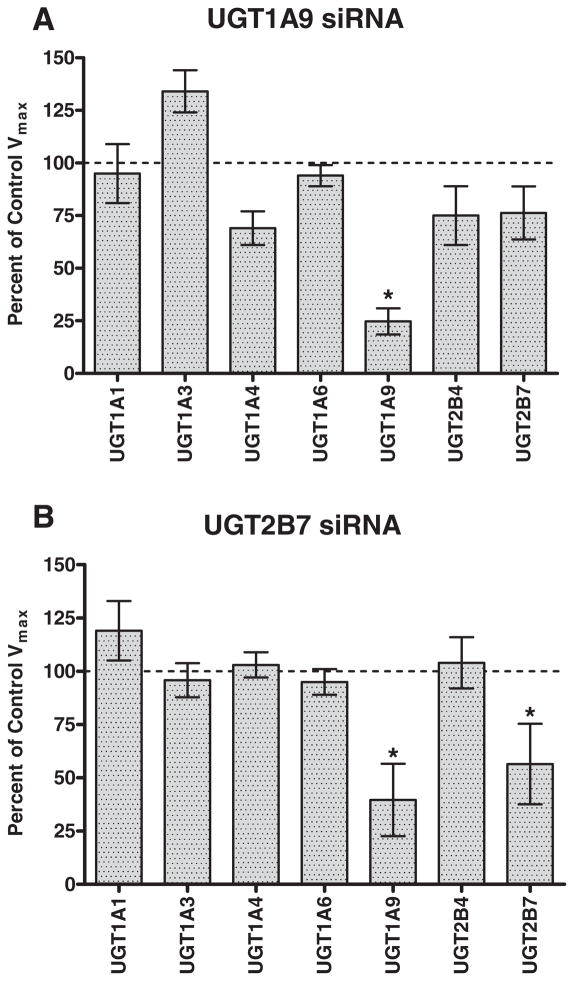
To examine the effect of protein–protein interactions on enzymatic activity, enzyme kinetic assays were performed and changes in metabolite formation were measured by LC-MS/MS. The effect of UGT1A9 and UGT2B7 down regulation on the activity of various UGT probe substrates is shown in Fig. 4. In addition to the expected decrease in propofol glucuronidation, down regulation of UGT1A9 also resulted in modest albeit statistically insignificant decreases in UGT1A4 (trifluoperazine), UGT2B4 (hyodeoxycholic acid) and UGT2B7 (morphine) glucuronidation activities (Fig. 4a). Consistent with the observed increase in UGT1A3 mRNA expression upon UGT1A9 siRNA transfection, an increase in the activity of UGT1A3 (fulvestrant) glucuronidation activity was also observed. When hepatocytes were transfected with UGT2B7 siRNA, a decrease in the activity of UGT1A9 (propofol) and UGT2B7 (morphine) glucuronidation was observed (Fig. 4b). Km values were generally unchanged for each probe substrate across siRNA treatment groups (within 2-fold).
Fig. 4.
Effect of siRNA down regulation of UGT1A9 and UGT2B7 mRNA expression on selective UGT probe substrate activities in human hepatocytes. Control Vmax values represent the maximal velocity achieved for each probe substrate in the absence of siRNA treatment. An asterisk (*) indicates a statistically significant difference, where p < 0.0001. Error bars indicate the standard deviation for replicate incubations (n = 3). The selective probe substrates used were estradiol (UGT1A1), fulvestrant (UGT1A3), trifluoperazine (UGT1A4), serotonin (UGT1A6), propofol (UGT1A9), hyodeoxycholic acid (UGT2B4) and morphine (UGT2B7).
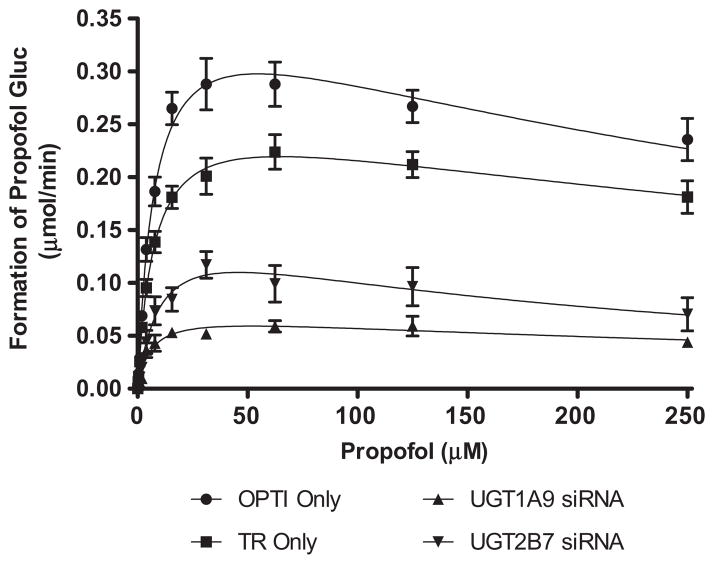
To further explore the effect of UGT1A9 and UGT2B7 down regulation on propofol glucuronidation, siRNA transfected hepatocytes were incubated with increasing concentrations of the UGT1A9 probe substrate propofol (0–250 μM, final concentration). Enzyme kinetic parameters are summarized in Table 1. Propofol glucuronidation in human hepatocytes was fit to a substrate inhibition model. As expected, propofol glucuronidation was significantly reduced relative to control in hepatocytes treated with UGT1A9 siRNA (Fig. 5). The effects of silencing UGT1A9 expression is reflected by a 73.6% reduction in Vmax values for cells transfected with UGT1A9 siRNA (Vmax = 0.073 ± 0.007 μmol/min) compared to the transfection reagent control (Vmax = 0.277 ± 0.005 μmol/min). UGT2B7 down regulation also resulted in a 42.2% reduction in Vmax values for propofol glucuronidation (Vmax = 0.160 ± 0.026 μmol/min). While the Ki values were generally similar for propofol glucuronidation in control hepatocytes and hepatocytes treated with UGT1A9 siRNA, a larger change (approximately 2.6-fold decrease) was observed in the propofol glucuronidation Ki when the hepatocytes were treated with UGT2B7 siRNA as compared to the transfection reagent control. Km values for propofol glucuronidation were generally unchanged in the presence of either UGT1A9 or UGT2B7 siRNA.
Table 1.
Summary of kinetic parameters of propofol glucuronidation in human hepatocytes with and without siRNA treatment. Intrinsic clearance values (Clint) were calculated by dividing the mean Vmax parameter by the mean Km parameter for each treatment group. OPTI Only and TR only refer to control incubations containing only Optimem assay buffer or Optimem buffer plus transfection reagent, respectively. Statistical significance is calculated versus the transfection reagent only control
| Vmax (μmol/min) | Km (μM) | Ki (μM) | Clint (mL/min) | |
|---|---|---|---|---|
| OPTI Only | 0.393 ± 0.009 | 7.99 ± 0.45 | 361.7 ± 31.3 | 49.1 |
| TR Only | 0.277 ± 0.005 | 7.62 ± 0.37 | 521.2 ± 46.3 | 36.3 |
| UGT1A9 siRNA | 0.073 ± 0.007* | 6.02 ± 1.6‡ | 448.4 ± 203.5‡ | 12.1* |
| UGT2B7 siRNA | 0.161 ± 0.027† | 10.5 ± 3.7‡ | 198.5 ± 88.9† | 15.3* |
p < 0.0001;
p < 0.005;
p > 0.1, no significant difference
Fig. 5.
Inhibition of propofol glucuronidation by siRNA in human hepatocytes. OPTI Only and TR only refer to control incubations containing only Optimem assay buffer or Optimem buffer plus transfection reagent, respectively.
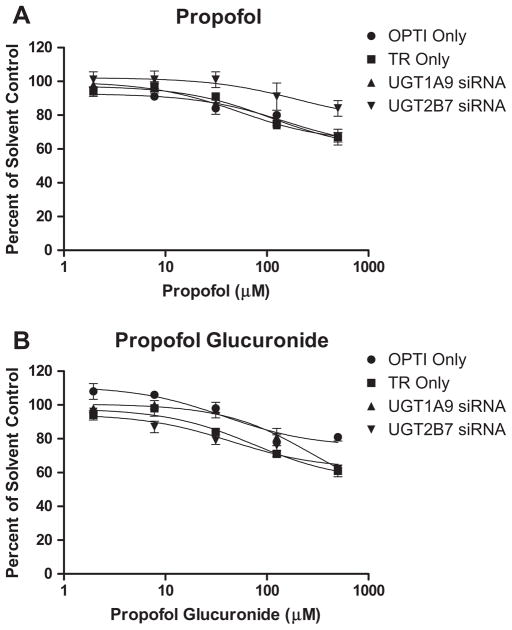
Finally, in light of the inhibition kinetics observed in human hepatocytes, the inhibitory properties of propofol and propofol glucuronide against UGT1A9 were assessed under the various siRNA treatment conditions. Under all conditions tested, both propofol and its glucuronide metabolite exhibited only weak inhibition of 2,6-dimethylphenol glucuronidation. At 500 μM propofol or propofol glucuronide, greater than 60% of UGT1A9 activity remained for all siRNA transfections (Fig. 6). No inhibition of UGT2B7-catalyzed morphine glucuronidation by either propofol or propofol glucuronide was observed (data not shown).
Fig. 6.
Inhibition of UGT1A9-catalyzed 2,6-dimethylphenol glucuronidation in human hepatocytes following down regulation of either UGT1A9 or UGT2B7. OPTI Only and TR only refer to control incubations containing only Optimem assay buffer or Optimem buffer plus transfection reagent, respectively.
Discussion
Glucuronidation is one of the major pathways of metabolism for both endogenous compounds and xenobiotics, accounting for up to 35% of Phase II reactions [24]. With numerous pharmaceuticals such as propofol, irinotecan/SN-38 and opioids as well as many important endogenous compounds such as bilirubin, hormones, and bile acids known to undergo glucuronidation, in vitro systems capable of carrying out glucuronidation reactions have received a significant amount of attention in recent years [25,26].
The systems currently used for studying glucuronidation in vitro include tissue fractions such as human liver microsomes or S9 fractions, fresh or cryopreserved hepatocytes and recombinant UGT enzymes. Human liver microsomes are generally considered the easiest to utilize, and contributions from Phase I and Phase II metabolic enzymes can easily be determined by the selective addition of the necessary cofactors for each pathway [27]. Human hepatocytes are the most physiologically relevant in vitro system in which to study glucuronidation activity and generally result in the most accurate prediction of in vivo glucuronidation parameters from in vitro data [28,29]. Cellular systems that over-express one or multiple UGTs of interest have also been used to study glucuronidation phenomena [8,30,31]. Not only can the artificial environments of recombinant systems result in expression levels of the UGTs that may differ from native cells, but also the enzymatic contribution of each UGT isoform is very difficult to determine, since the interactions may vary depending on UGT isoform, substrate, and expression ratio. Additionally, post-translational modifications to the UGTs, such as phosphorylation and N-glycosylation that have been shown to impact activity, may not occur in cell expression systems [24,32]. Several studies have demonstrated that variation in lipid composition between cellular preparations as well as general membrane characteristics may also contribute to in vitro intrinsic clearances that severely under-predict in vivo hepatic clearance [23,26,29]. Finally, insect-expressed systems such as Supersomes, while being a very commonly used phenotyping tool and perhaps the simplest system in which to study a single UGT isoform, lack the potential to exhibit the heterodimeric protein interactions that the more complex systems are capable of exhibiting.
With increasing evidence confirming discrepancies in UGT activity between recombinant systems and whole cell systems, propofol was chosen as a model compound with which to examine potential changes in glucuronidation activity due to protein interactions. While propofol has previously been shown to be a selective substrate for UGT1A9 [19], recent data has indicated the importance of phenotyping compounds at therapeutically relevant concentrations [33]. As such, a phenotyping assessment of propofol glucuronidation was carried out using concentrations that encompassed the peak plasma concentrations of propofol observed in vivo [34]. At the concentrations tested, propofol was selectively glucuronidated by UGT1A9 with only a minor contribution from UGT1A6, indicating that it was an appropriate choice of model substrates with which to examine UGT activity in more complex in vitro systems.
To date, the use of siRNA to examine drug metabolizing enzyme activity is fairly limited. The technology is more commonly used to target the expression of over-expressed molecular targets in cancer therapy or to discern the importance of an enzymatic pathway in an in vitro pharmacology assay [35]. The use of siRNA to study glucuronidation has been previously reported in both HeLa cells as well as in a Caco-2 cell system [36,37]. Upon down regulation of UGT1A6 expression in Caco-2 cells, a significant decrease in the glucuronidation of apigenin was observed, resulting in UGT1A6 being implicated as the primary UGT isoform involved in the glucuronidation of flavanoids in Caco-2 cells.
While the exact mechanism of the protein interaction between UGT1A9 and UGT2B7 in human hepatocytes remains unknown, it is possible to propose a number of mechanistically feasible scenarios. Previous investigations into the interactions between human UGT2B7 and UGT1A enzymes demonstrated that co-expression of UGT2B7 with UGT1A9 in HEK cells resulted in enhancement of propofol glucuronidation, in comparison with the UGT1A9 single expression system [23]. Using siRNA transfection in human hepatocytes, we have shown that down regulation of UGT2B7 expression also results in a decrease in the glucuronidation rate of propofol, presumably due to disruption of protein interactions between UGT1A9 and UGT2B7. While Km values for propofol glucuronidation remained relatively unchanged when UGT2B7 was targeted, decreases in both the observed Ki and Vmax values for propofol glucuronidation (fit to a substrate inhibition kinetic model) were observed as compared to the transfection reagent control. As Ki is the dissociation constant for an inhibitory enzyme-substrate complex, any modifications to protein structure or confirmation could be expected to result in changes to the binding affinity for the inhibitory ligand in the UGT1A9 active site [38]. As such, one possibility is that a more tightly bound inhibiting species (as defined by the lower Ki value) may account for some of the observed decrease in UGT1A9 activity when UGT2B7 is down regulated in the hepatocyte incubations. The observation that only the Ki (and not the Km) for propofol glucuronidation is altered may suggest that discreet binding sites exist for the substrate and putative inhibitor, and that the inhibition may be due to an allosteric binding site that is dependent upon protein interactions between UGT1A9 and UGT2B7, as has been suggested for other UGT protein interactions [8]. However, the observation that neither propofol nor propofol glucuronide appear to be inhibitors of UGT1A9 activity at the concentrations utilized in vitro lends additional support to a second scenario of a noncompetitive protein interaction mechanism that drives the inhibition kinetics observed for propofol glucuronidation in human hepatocytes. As such, disruption of the noncompetitive interaction through siRNA down regulation of UGT2B7 may account for the observed changes in both Vmax and Ki.
Two additional possibilities may also explain the observed decrease in propofol glucuronidation when UGT2B7 is down regulated. First, it has previously been shown that UGTs form catalytically active dimers through interactions of their amino-terminal domains, an interaction which serves to stabilize the resulting protein complex [15]. Conversely, the lack of such an interaction could conceivably serve to destabilize the UGT1A9 protein in hepatocytes pre-treated with UGT2B7 siRNA, resulting in the observed decrease in Vmax values for propofol glucuronidation when UGT2B7 is down regulated. The second scenario that must be considered is that the incorporation of UGT2B7 siRNA may affect the translation or protein folding properties of UGT1A9, a phenomenon that we are currently investigating.
The minor effects observed on the activities of UGT isoforms such as UGT1A4 are also consistent with data previously generated in various heterologous or stable expression systems. Co-expression of UGT1A9 in HEK293 cell lines expressing UGT1A4 has been shown to increase the activity (Vmax/Km) of UGT1A4-catalyzed imipramine N-glucuronide formation as well as to confer additional thermal stability and resistance to detergent for UGT1A4 [39]. As such, the decrease observed in UGT1A4 activity in hepatocytes when UGT1A9 expression was down regulated may be attributable to the absence of UGT1A9 protein to interact with and stabilize UGT1A4. Interestingly, while the effects of UGT2B7 expression on UGT1A1, UGT1A4, UGT1A6 and UGT1A9 activities have been reported [23], only UGT1A9 activity was altered when UGT2B7 expression was down regulated in human hepatocytes transfected with UGT2B7 siRNA. While the detailed mechanism of UGT protein interactions in human hepatocytes remains to be elucidated, our findings specific to UGT1A9 and UGT2B7 do not discount the physiological relevance of protein interactions between UGT2B7 and UGT1A1, UGT1A4 or UGT1A6, but may further support the effects that lipid and membrane composition of the individual expression systems may have on UGT protein interactions in general [23,24,40].
In summary, the data presented in this manuscript supports the utility of siRNA down regulation as an important process for evaluating UGT enzymology and suggests that UGT protein interactions are a physiologically relevant phenomena whose effects can be observed in human hepatocytes. The data also confirm previous interactions noted for UGT1A9 and UGT2B7 in over-expressed cellular systems. While single-UGT expression systems will continue to be a useful tool both in characterizing UGTs as well as phenotyping drugs that undergo glucuronidation, the current data emphasizes the caution that should be taken in utilizing in vitro UGT systems in which heterodimeric protein interactions are unable to occur.
Acknowledgments
The authors would like to thank Dr. Josh T. Pearson (Amgen, Inc.) for insightful discussions and critical review of this manuscript.
Footnotes
The research in this manuscript was funded by Amgen Inc., (Thousand Oaks, CA) and supported by USPHS grants ES010337, 6M086713 and NIH grant GM100481.
Abbreviations used: CYP, Cytochrome P450; UGT, UDP-Glucuronosyltransferase; DME, drug metabolizing enzyme; Km, substrate concentration at half the maximum rate of the reaction; Vmax, the maximum rate of the reaction; LC-MS/MS, High-Performance Liquid Chromatography/Tandem Mass Spectrometry; OPTI Only, OPTIMEM only was used in cell treatment; TR Only, the transfection reagent only was used in cell treatment; HLM, human liver microsomes.
References
- 1.Dutton GJ. Acceptor substrates of UDP-glucuronosyltransferase and their assay. In: Dutton GJ, editor. Glucuronidation of Drugs and Other Compounds. CRC Press; Boca Raton: 1980. pp. 69–78. [Google Scholar]
- 2.Tukey RH, Strassburg CP. Annu Rev Pharmacol Toxicol. 2000;40:581–616. doi: 10.1146/annurev.pharmtox.40.1.581. [DOI] [PubMed] [Google Scholar]
- 3.Fremont JJ, Wang RW, King CD. Mol Pharmacol. 2005;67(1):260–262. doi: 10.1124/mol.104.006361. [DOI] [PubMed] [Google Scholar]
- 4.Ikushiro S, Emi Y, Iyanagi T. Biochemistry. 1997;36(23):7154–7161. doi: 10.1021/bi9702344. [DOI] [PubMed] [Google Scholar]
- 5.Ishii Y, Takeda S, Yamada H. Drug Metab Rev. 2010;42(1):145–158. doi: 10.3109/03602530903208579. [DOI] [PubMed] [Google Scholar]
- 6.Iyanagi T. Int Rev Cytol. 2007;260:35–112. doi: 10.1016/S0074-7696(06)60002-8. [DOI] [PubMed] [Google Scholar]
- 7.Kurkela M, Garcia-Horsman JA, Luukkanen L, Morsky S, Taskinen J, Baumann M, Kostiainen R, Hirvonen J, Finel M. J Biol Chem. 2003;278(6):3536–3544. doi: 10.1074/jbc.M206136200. [DOI] [PubMed] [Google Scholar]
- 8.Nakajima M, Yamanaka H, Fujiwara R, Katoh M, Yokoi T. Drug Metab Dispos. 2007;35(9):1679–1686. doi: 10.1124/dmd.107.015909. [DOI] [PubMed] [Google Scholar]
- 9.Operana TN, Tukey RH. J Biol Chem. 2007;282(7):4821–4829. doi: 10.1074/jbc.M609417200. [DOI] [PubMed] [Google Scholar]
- 10.Takeda S, Ishii Y, Iwanaga M, Mackenzie PI, Nagata K, Yamazoe Y, Oguri K, Yamada H. Mol Pharmacol. 2005;67(3):665–672. doi: 10.1124/mol.104.007641. [DOI] [PubMed] [Google Scholar]
- 11.Taura KI, Yamada H, Hagino Y, Ishii Y, Mori MA, Oguri K. Biochem Biophys Res Commun. 2000;273(3):1048–1052. doi: 10.1006/bbrc.2000.3076. [DOI] [PubMed] [Google Scholar]
- 12.Lewis BC, Mackenzie PI, Miners JO. Biochem Pharmacol. 2011;82(12):2016–2023. doi: 10.1016/j.bcp.2011.09.007. [DOI] [PubMed] [Google Scholar]
- 13.Ishii Y, Takeda S, Yamada H, Oguri K. Front Biosci. 2005;10:887–895. doi: 10.2741/1583. [DOI] [PubMed] [Google Scholar]
- 14.Gschaidmeier H, Bock KW. Biochem Pharmacol. 1994;48(8):1545–1549. doi: 10.1016/0006-2952(94)90198-8. [DOI] [PubMed] [Google Scholar]
- 15.Meech R, Mackenzie PI. J Biol Chem. 1997;272(43):26913–26917. doi: 10.1074/jbc.272.43.26913. [DOI] [PubMed] [Google Scholar]
- 16.Kurkela M, Patana AS, Mackenzie PI, Court MH, Tate CG, Hirvonen J, Goldman A, Finel M. Pharmacogenet Genomics. 2007;17(2):115–126. doi: 10.1097/FPC.0b013e328011b598. [DOI] [PubMed] [Google Scholar]
- 17.Bock KW, Kohle C. Biochem Pharmacol. 2009;77(9):1458–1465. doi: 10.1016/j.bcp.2008.12.004. [DOI] [PubMed] [Google Scholar]
- 18.Chouinard S, Tessier M, Vernouillet G, Gauthier S, Labrie F, Barbier O, Belanger A. Mol Pharmacol. 2006;69(3):908–920. doi: 10.1124/mol.105.015891. [DOI] [PubMed] [Google Scholar]
- 19.Court MH. Methods Enzymol. 2005;400:104–116. doi: 10.1016/S0076-6879(05)00007-8. [DOI] [PubMed] [Google Scholar]
- 20.Stone AN, Mackenzie PI, Galetin A, Houston JB, Miners JO. Drug Metab Dispos. 2003;31(9):1086–1089. doi: 10.1124/dmd.31.9.1086. [DOI] [PubMed] [Google Scholar]
- 21.Shimizu M, Matsumoto Y, Tatsuno M, Fukuoka M. Biol Pharm Bull. 2003;26(2):216–219. doi: 10.1248/bpb.26.216. [DOI] [PubMed] [Google Scholar]
- 22.Shimizu M, Matsumoto Y, Yamazaki H. Drug Metab Lett. 2007;1(1):77–79. doi: 10.2174/187231207779814355. [DOI] [PubMed] [Google Scholar]
- 23.Fujiwara R, Nakajima M, Oda S, Yamanaka H, Ikushiro S, Sakaki T. J Pharm Sci. 2010;99(1):442–454. doi: 10.1002/jps.21830. [DOI] [PubMed] [Google Scholar]
- 24.Ishii Y, Nurrochmad A, Yamada H. Drug Metab Pharmacokinet. 2010;25(2):134–148. doi: 10.2133/dmpk.25.134. [DOI] [PubMed] [Google Scholar]
- 25.Foti RS, Fisher MB. Encyclopedia of Drug Metabolism and Interactions. Lyubimov AV: John Wiley & Sons, Inc; 2012. UDP-Glucuronosyltransferases: Pharmacogenetics, Functional Characterization, and Clinical Relevance. [Google Scholar]
- 26.Miners JO, Smith PA, Sorich MJ, McKinnon RA, Mackenzie PI. Annu Rev Pharmacol Toxicol. 2004;44:1–25. doi: 10.1146/annurev.pharmtox.44.101802.121546. [DOI] [PubMed] [Google Scholar]
- 27.Fisher MB, Jackson D, Kaerner A, Wrighton SA, Borel AG. Drug Metab Dispos. 2002;30(3):270–275. doi: 10.1124/dmd.30.3.270. [DOI] [PubMed] [Google Scholar]
- 28.Engtrakul JJ, Foti RS, Strelevitz TJ, Fisher MB. Drug Metab Dispos. 2005;33(11):1621–1627. doi: 10.1124/dmd.105.005058. [DOI] [PubMed] [Google Scholar]
- 29.Soars MG, Burchell B, Riley RJ. J Pharmacol Exp Ther. 2002;301(1):382–390. doi: 10.1124/jpet.301.1.382. [DOI] [PubMed] [Google Scholar]
- 30.Coffman BL, Green MD, King CD, Tephly TR. Mol Pharmacol. 1995;47(6):1101–1105. [PubMed] [Google Scholar]
- 31.Fujiwara R, Nakajima M, Yamanaka H, Katoh M, Yokoi T. Drug Metab Dispos. 2007;35(10):1781–1787. doi: 10.1124/dmd.107.016402. [DOI] [PubMed] [Google Scholar]
- 32.Miners JO, Knights KM, Houston JB, Mackenzie PI. Biochem Pharmacol. 2006;71(11):1531–1539. doi: 10.1016/j.bcp.2005.12.019. [DOI] [PubMed] [Google Scholar]
- 33.VandenBrink BM, Foti RS, Rock DA, Wienkers LC, Wahlstrom JL. Drug Metab Dispos. 2012;39(9):1546–1554. doi: 10.1124/dmd.111.039065. [DOI] [PubMed] [Google Scholar]
- 34.Brunton L, Lazo J, Parker K. Goodman & Gilman’s The Pharmacological Basis of Therapeutics. 11. McGraw-Hill Professional; New York: 2006. [Google Scholar]
- 35.Rao DD, Vorhies JS, Senzer N, Nemunaitis J. Adv Drug Deliv Rev. 2009;61(9):746–759. doi: 10.1016/j.addr.2009.04.004. [DOI] [PubMed] [Google Scholar]
- 36.Jiang W, Xu B, Wu B, Yu R, Hu M. Drug Metab Dispos. 2012;40(2):336–345. doi: 10.1124/dmd.111.041467. [DOI] [PMC free article] [PubMed] [Google Scholar]
- 37.Liu X, Tam VH, Hu M. Mol Pharm. 2007;4(6):873–882. doi: 10.1021/mp0601190. [DOI] [PMC free article] [PubMed] [Google Scholar]
- 38.Segel I. Enzyme Kinetics: Behavior and Analysis of Rapid Equilibrium and Steady-State Enzyme Systems. New York: John Wiley & Sons, Inc; 1975. [Google Scholar]
- 39.Fujiwara R, Nakajima M, Yamanaka H, Nakamura A, Katoh M, Ikushiro S, Sakaki T, Yokoi T. Drug Metab Dispos. 2007;35(5):747–757. doi: 10.1124/dmd.106.014191. [DOI] [PubMed] [Google Scholar]
- 40.Kurkela M, Hirvonen J, Kostiainen R, Finel M. Biochem Pharmacol. 2004;68(12):2443–2450. doi: 10.1016/j.bcp.2004.08.019. [DOI] [PubMed] [Google Scholar]


