

Abstract
To predict the emergence of antibiotic resistance, quantitative relations must be established between the fitness of drug resistant organisms and the molecular mechanisms conferring resistance. These relations are often unknown and may depend on the state of bacterial growth. To bridge this gap, we have investigated Escherichia coli strains expressing resistance to translation-inhibiting antibiotics. We show that resistance expression and drug inhibition are linked in a positive feedback loop arising from an innate, global effect of drug-inhibited growth on gene expression. A quantitative model of bacterial growth based on this innate feedback accurately predicts the rich phenomena observed: a plateau-shaped fitness landscape, with an abrupt drop in the growth rates of cultures at a threshold drug concentration, and the coexistence of growing and non-growing populations, i.e., growth bistability, below the threshold.
INTRODUCTION
The appearance of bacterial strains with broad antibiotic resistance is becoming an alarming global health concern. The rapidity with which drug resistance has emerged over the past 30 years, for both natural and synthetic antibiotics, exposes a glaring lack of understanding of drug-bacteria interaction and its evolution (1, 2). Though thousands of genetic adaptations that enable drug resistance have been identified, this knowledge has not yet revealed how and when these adaptations will arise, i.e. the underlying principles that determine the evolutionary pathways to drug resistance (3–5).
Although the success of a particular drug-resistant strain might depend on many factors, one of the most basic factors to consider is the nature of bacterial growth during antibiotic treatment. This is especially critical for resistance mechanisms evolved de novo, during early stages of evolution when drug resistance emerges in incremental steps (3, 6, 7). It is desirable to characterize the interaction between drug and drug resistance in exponentially growing cells, because during an infection the number of bacteria can increase exponentially for many days (8, 9)—indeed, even as the host’s immune response reduces the overall number of bacteria, individual bacteria that have yet to be killed are still estimated to grow at typical in vitro rates, doubling up to once or twice per hour for some pathogens (10, 11). However, elucidating this interaction in growing cells is challenging, because the expression of drug resistance genes, like the expression of any other gene, is often intimately coupled to the growth status of the bacteria (12–18).
In particular, translation-inhibiting antibiotics have been shown to reduce the expression of both regulated and constitutively expressed genes due to growth-mediated global effects (16, 17). If one of these gene products provides some degree of antibiotic resistance, then growth inhibition can reduce expression of resistance; the diminished resistance can in turn allow the drug to further inhibit growth in a positive feedback loop (fig. S1), driving the cell into a stable non-growing state following a transient slowdown in cell growth. Frequently, gene-regulatory systems with positive feedback exhibit a switch-like behavior when, for example, intrinsic fluctuations in gene expression exceed some threshold (19,20). This is often accompanied by bifurcation of a genetically homogeneous culture into two subpopulations with distinct phenotypes, which is called bistability (19, 20). In the context of antibiotic resistance this would be manifested as a “growth bistability”, i.e., growing and non-growing cells coexisting in a homogeneous environment.
To characterize the nature of drug/drug-resistance interactions and the possible occurrence of growth bistability, we studied the growth of various Escherichia coli strains constitutively expressing varying degrees of resistance to translation-inhibiting antibiotics. Our observations at both population and single-cell levels show that drug-resistant strains exhibit many signatures of growth bistability in response to antibiotics, contradicting the naïve expectation that constitutive expression of drug resistance in a population of cells will provide uniform protection against the drug. As will be shown, a heterogeneous effect of antibiotics on genetically identical cells challenges common notions and measures of drug efficacy and resistance, and exposes both limitations and opportunities for treatment strategies.
We proceed to develop a simple mathematical model that effectively captures the origins of the observed behaviors and accurately predicts the growth rates of antibiotic-resistant cells in the presence of drugs without invoking any ad hoc fitting parameters. These results reveal a plateau-like fitness landscape that describes an abrupt transition between growth and growth-inhibition for strains expressing a broad range of drug resistance subject to a broad range of drug concentrations. Quantitative knowledge of the fitness landscape is vital for understanding and predicting the evolvability of drug resistance, e.g., the acquisition of antibiotic resistance in a step-wise manner.
RESULTS
Heterogeneous responses to antibiotics
Antibiotic susceptibility is typically assayed by counting the colonies formed after bacteria are spread onto agar plates containing various concentrations of antibiotics (21). If these cells exhibit growth bistability, then only the growing fraction of the inoculant cells will form colonies. To test for this heterogeneous response, we characterized the fraction of colonies formed by various strains of E. coli growing on agar in the presence of chloramphenicol (Cm), one of the oldest and most-studied translation-inhibiting antibiotics (22). We studied strains that express the Cm-resistance enzyme chloramphenicol acetyltransferase (CAT), which modifies and deactivates Cm according to well-characterized biochemistry (23). CAT enzymes are expressed constitutively in our strains, just as they (and many other drug-resistance enzymes and pumps) are often found in the wild (24–27).
Overnight incubation of CAT-expressing strains on Cm-agar plates revealed signs of population-level heterogeneity. For one such strain, Cat1 (table S1), the number of colony-forming units (CFU) decreased gradually on plates with increasing Cm concentrations (Fig. 1A, top; fig. S2B). Thus, only a fraction of the plated cells formed visible colonies (Fig. 1B, circles), even at concentrations well below the empirical minimal inhibitory concentration at which colony formation is completely inhibited (MICplate, fig. S2A). It is unlikely that heterogeneity arose from spontaneous mutation, as repeating the experiment using a single colony isolated at 90% MICplate produced qualitatively similar results (with CFU decreasing at intermediate drug levels, fig. S2C–D). In contrast, CFU count of CAT-less wild type cells (strain EQ4) remained high until complete inhibition at MICplate (Fig. 1A bottom; fig. S3), indicating that the vast majority of plated cells grew up to the MIC (Fig. 1B, triangles).
Figure 1. Heterogeneous response of Cm-resistant cells.
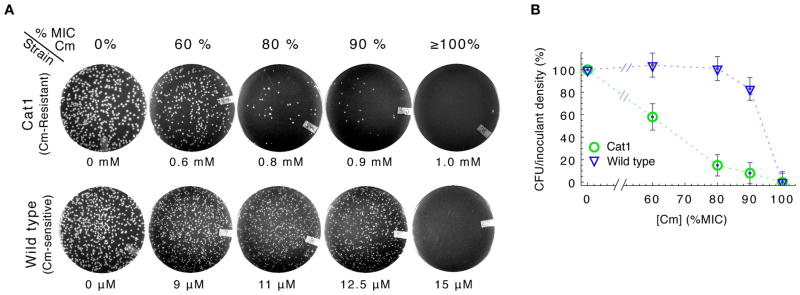
E. coli cells were diluted from log phase batch cultures lacking Cm, and were spread onto LB agar at densities of several hundred cells per plate before overnight incubation at 37°C. (A) Typical plate images of Cm-resistant Cat1 (top row) and Cm-sensitive wild type (bottom row) cells, with Cm concentration indicated below each plate and also given above as approximate fraction of the empirically determined MICplate for each strain (figs. S2A and S3A). (B) Percentage of viable cells grown on Cm-LB plates; CAT-expressing cells (Cat1, green) and wild type cells (EQ4, blue). Error bars estimate SD of CFU, assuming Poisson-distributed colony appearance.
Direct observation of growth bistability by microscopy
To verify the coexistence of growing and non-growing cells directly, we employed a microfluidic device in which the growth of individual (immotile) cells could be tracked with time-lapse microscopy for extended periods (28) as they grew in the presence of Cm. The device provides a steady supply of fresh media to many growth chambers, whose heights are adjusted to be slightly larger than the width of a single bacterium (~1 μm), allowing cells to grow for up to ~9 generations into monolayer colonies in each chamber (fig. S4). Immotile CAT-expressing cells (Cat1m) growing exponentially in Cm-free batch culture were transferred to the microfluidic device, and were allowed to continue growing exponentially for several generations before switching to growth medium with Cm (see Methods). With 0.9 mM Cm (90% of MICplate) in the medium, 70% of the cells stopped growing; non-growing and growing cells were often observed side by side in the same chamber (Fig. 2A, Movie S1). Eventually, it became impossible to track these non-growing cells that were adjacent to growing populations due to overcrowding. By tracking some non-growing cells that were far away from growing populations, we observed that this growth bimodality persisted for the duration of observation (up to 24 hours), as cells rarely switched between the growing and non-growing states at 0.9 mM Cm (less than 1%).
Figure 2. Drug-induced growth bistability.

(A) Upon increasing Cm concentration from 0 to 0.9 mM in microfluidic chambers (fig. S4), genetically identical Cat1m cells growing exponentially in glucose minimal medium either continued growing (circled in green) or were growth-arrested (circled in white); see Movie S1. None of the Cat1m cells grew after adding Cm to 1.0 mM. (B) A typical example of the cells that remained dormant throughout the 24 hours during which microfluidic chambers contained 0.9 mM Cm; growth resumed ~8 hours after Cm was reduced to 0.1 mM, which is still well above the MIC of wild type cells (see Movie S2). (C) Height of colored bars gives the percentage of Cat1m cells to continue exponential growth in microfluidic chambers upon adding indicated concentration of Cm; error bars give 95% CI assuming a binomial distribution. Bar color indicates growth rates of growing cells, with the relative growth rate given by the scale bar on the right. (D) Growth curves at different Cm concentrations, given by the size of growing colonies (y-axis) in the microfluidic device. The deduced growth rates dropped abruptly from 0.35 hr−1 (green squares) at 0.9 mM Cm to zero at 1.0 mM Cm (black triangles). (E) As in panel C, but for immotile wild type cells (EQ4m) that showed no significant correlation between growth rate and fraction of growing cells (ρs~0.1). (F) Fraction of Cat1 cells remaining after the batch culture Amp-Cm enrichment assay (fig. S5). The results (fig. S7) reveal significant fractions of non-growing cells well above the basal level of natural persisters (~10−3), for [Cm] ≥ 0.4 mM until the MIC of 1.0 mM above which no cells grew. Error bars estimate SD of CFU, assuming Poisson-distributed colony appearance.
One possible explanation for the sustained presence of non-growing cells is that these cells did not have the cat gene at the beginning of the experiment. To see whether the heterogeneous response observed was due to (unintended) heterogeneity in genotype (e.g., contamination), we reduced Cm concentration in the chambers from 0.9 mM to 0.1 mM, a concentration well above the MIC of Cm-sensitive cells (fig. S3). Many non-growing cells began growing again, sometimes within ~5 hours of the Cm downshift (Fig. 2B, Movie S2), indicating that previously non-growing cells carried the cat gene and were viable (although Cm can be bactericidal at high concentrations (29)). Thus, the population of cells in the non-growing state was stable at 0.9 mM Cm (at least over the 24-hour period tested) but unstable at 0.1 mM Cm, suggesting that growth bistability might only occur at higher Cm concentrations.
Repeating this characterization for Cat1m cells at different Cm concentrations revealed that the fraction of cells that continued to grow decreased gradually with increasing concentration of the Cm added, (Fig. 2C, height of colored bars), qualitatively consistent with the Cm-plating results for Cat1 cells (Fig. 1B). At concentrations up to 0.9 mM Cm the growing populations grew exponentially, with their growth rate decreasing only moderately (by up to ~50%) for increasing Cm concentrations (Fig. 2C hue, and Fig. 2D green symbols). Growing populations disappeared completely for [Cm] ≥ 1.0 mM, marking an abrupt drop in growth between 0.9 and 1.0 mM Cm (green and black symbols in Fig. 2D). This behavior contrasts with that observed for the Cm-sensitive wild type, in which nearly all cells continued growing over the entire range of sub-inhibitory Cm concentrations tested in the microfluidic device (Fig. 2E). This result is consistent with the response of wild type cells to Cm on agar plates (Fig. 1), indicating that growth in sub-inhibitory concentrations of Cm per se does not necessarily generate growth bistability.
Enrichment reveals conditions required for growth bistability
Infrequently, we also observed non-growing wild type cells in microfluidic experiments, although their occurrence was not correlated with Cm concentration (rs ~ 0.1). This is not surprising because exponentially growing populations of wild type cells are known to maintain a small fraction of non-growing cells due to the phenomenon called “persistence” (30). In the natural course of exponential growth, wild type cells have been shown to enter into a dormant persister state stochastically at a low rate, resulting in the appearance of one dormant cell in every ~103 to 104 growing cells (31–33). It is possible that the growth bistability observed for the CAT-expressing cells in low Cm concentrations is due to such naturally occurring persistence (referred to below as “natural persistence”). This question cannot be resolved by our current microfluidic experiments which, at a throughput of ~103 cells, can barely detect natural persistence. We therefore sought a more sensitive method to quantify the conditions that produce growth bistability.
To enhance the sensitivity for detecting non-growing cells and to probe the population-level behavior of Cat1 cells in batch cultures, we adapted an Ampicilin (Amp) -based enrichment assay (34) that isolated non-growing cells from Cm-containing cultures. This enrichment assay (fig. S5) took advantage of the fact that Amp only kills growing cells (35), thereby enriching cultures for potentially dormant cells to later be revived in the absence of antibiotics. Using the microfluidic device, we verified visually that the cells that stopped growing due to Cm-induced growth bistability could survive ampicillin treatment, and were viable when antibiotics were removed (fig. S6).
In batch culture enrichment, Cat1 cells that failed to grow in the presence of Cm later appeared as colonies on antibiotic-free agar plates (fig. S7A). Consistent with the results in the microfluidic chamber (Fig. 2C), the fraction of non-growing cells identified by the enrichment assay at 0.3 mM Cm and below was small (≤10−3, Fig. 2F), comparable to the frequencies characterized for natural persistence under similar conditions (31, 32). However, the frequency of cells in the non-growing state increased substantially at [Cm] ≥ 0.4 mM (Fig. 2F, fig. S7A). We define the ‘minimal coexistence concentration’ (MCC) as the lowest antibiotic concentration above which coexistence between growing and non-growing cells appears at frequencies significantly above natural persistence; MCC ≈ 0.35 mM for the strain Cat1. Thus, growth bistability turns large fractions of Cm-resistant cells into Cm-sensitive cells at Cm concentrations between MCC and MIC. In contrast, enriching Cm-sensitive wild type cells in sub-inhibitory Cm concentrations reveals that most cells grow; >99% remain sensitive to ampicillin for all sub-MIC Cm concentrations (fig. S7B), which is consistent with previous findings that cells should only be protected from Amp if Cm completely inhibits growth (35–37).
Growth-mediated feedback and generic growth bistability
If growth bistability exhibited by Cat1 cells was indeed a result of generic growth-mediated feedback, then it should appear generally, not just idiosyncratically for Cm, and for the specific action of the Cm-modifying enzyme CAT. Toward this end, we tested the growth of a strain (Ta1) constitutively expressing the tetracycline-efflux pump TetA (38, 39) in microfluidic chambers with medium containing various concentrations of the drug tetracycline (Tc). As with the growth of strain Cat1 in Cm, Ta1 exhibited coexistence of growing and non-growing cells for a range of sub-MIC concentrations of Tc, and an abrupt drop in its relative growth rate at the MIC (from ~60% of the uninhibited rate to no growth, fig. S8A). In contrast to Tc-resistant cells, none of the wild type cells stopped growing when exposed to sub-MIC Tc concentrations, even when Tc reduced growth rate by 85% (fig. S8C). These results were similar to those for Cat1 cells in Cm, supporting the hypothesis that growth bistability occurs generically, independent of the mode of drug resistance, as is predicted by growth-mediated feedback (fig. S1).
Quantitative model for antibiotic-resistant growth
To determine whether growth-mediated feedback could quantitatively account for the occurrence of growth bistability (Fig. 1–2), we developed a simple mathematical model to predict the effect of a drug on the growth of cells constitutively expressing drug resistance. We focus here on the Cm-CAT system, whose biochemistry is quantitatively characterized (23); (40) contains a more general treatment with respect to other antibiotics and resistance mechanisms. The model contains three components as summarized in Fig. 3A, and can quantitatively predict the dependence of the steady state growth rate on the Cm concentration of the medium: (i) At steady state, the relation between the internal and external Cm concentration ([Cm]int and [Cm]ext respectively) can be obtained by balancing the rate of Cm influx with the rate of Cm clearance by CAT. (ii) The concentration and hence activity of constitutively expressed CAT proteins depends linearly on a cell’s growth rate in response to applied Cm, due to global growth-dependent effects. (iii) The cell’s doubling time depends linearly on [Cm]int through the known effect of Cm on translation. Below we elaborate on each component in some detail.
Figure 3. Growth-mediated feedback.

(A) Components of interactions defining the feedback model. Each link describes a relation substantiated in panels (B)–(D) (clockwise). (B) The relationship between the internal and external Cm concentration ([Cm]int and [Cm]ext respectively), described by the red line, is obtained by balancing the passive influx of Cm into the cell (Jinflux, Eq. [1]) with the rate of Cm modification by CAT (JCAT, Eq. [2]). This nonlinear relation is characterized by an approximate threshold-linear form, with a “threshold” Cm concentration, (red arrow), below which [Cm]int is kept low as the capacity for clearance by CAT well exceeds the Cm influx; Eq. [S12]. For , CAT is saturated and Jinflux ≈ Vmax (dashed grey line). (C) The expression levels of constitutively expressed CAT (green) and LacZ (black) reporters (reported here in units of activity per OD (42)) are proportional to the growth rate for growth with sub-inhibitory doses of Tc and Cm respectively. (D) The doubling time (blue circles) of wild type (EQ4) cells grown in minimal medium with various concentrations of Cm increases linearly with [Cm] (Eq. [4] and Box 1). I50 (dashed vertical line) gives the Cm concentration at which cell growth is reduced by 50%. Here, [Cm]int ≈ [Cm]ext due to the absence of endogenous Cm efflux for wild type cells in minimal media (41) (see also Eq. [S9]). Each point represents a single experiment; error bars of the doubling times are standard error of inverse slope in linear regression of log(OD600) versus time.
Balance of drug influx and clearance
We assume Cm influx is passive (41), as described by Eq. [1] in Fig. 3B, with a permeability κ (table S2). The Cm-CAT interaction is described by Michaelis-Menten kinetics (23) parameterized by Km and Vmax (Eq. [2] in Fig. 3B). Solving Eqs. [1] and [2] yields an approximate threshold-linear dependence of [Cm]int on [Cm]ext (red line in Fig. 3B). According to this nonlinear relation, [Cm]int is kept relatively low for external concentrations up to ~ Vmax/κ, the threshold concentration above which Cm influx reaches the maximum capacity of Cm-clearance by CAT. Note that this buffering effect does not require any molecular cooperativity (40).
Growth-rate dependent expression of constitutive (unregulated) genes
Figure 3C shows that, under translation-limited growth, the expression levels (i.e. protein concentration) of unregulated genes decrease linearly with decreasing growth rate λ (16, 42). This trend contradicts the commonly held expectation that protein concentration should decrease with increasing growth rates, due to a growth-mediated dilution effect. Instead, the proportionality between expression level and growth rate follows from bacterial growth laws (16), and can be understood as a generic consequence of the up-regulation of ribosome synthesis upon translational inhibition, at the expense of the expression of non-ribosomal genes (fig. S9). The behavior is shown for translation-inhibited growth in Fig. 3C, with CAT activity (Vmax) of cells constitutively expressing CAT (open green circles), and LacZ activity of cells constitutively expressing LacZ (open black symbols). This result is described by Eq. [3] in Fig. 3C, expressed relative to the CAT activity and growth rate in cells not exposed to drugs (denoted by V0 and λ0 respectively). We note that some drug-resistance genes are not usually expressed constitutively, but require induction by the target antibiotic (25–27). However, regulated gene expression is still subject to growth-mediated feedback (17, 43), and may suffer substantial reduction upon increasing the drug concentration. This has been observed for the native Tc-inducible promoter controlling tetracycline resistance, for growth under sub-lethal doses of Tc (fig. S10).
Effect of translation inhibition on cell growth
For exponentially growing cells subject to sub-inhibitory doses of Cm, the relative doubling time (λ0/λ) is expected to increase linearly with internal drug concentration [Cm]int; see Eq. [4] in Fig. 3D. This relation is a consequence of the characterized effects of Cm on translation (22) together with bacterial growth laws, which dictate that the cell’s growth rate depends linearly on the translational rate of the ribosomes (fig. S9) (16, 44). Growth data in Fig. 3D verifies this quantitatively for wild type cells. The lone parameter in this relation, the half-inhibition concentration I50, is governed by the Cm-ribosome affinity (Eq. [S6]) and its empirical value is well accounted for by the known biochemistry (22) (table S2).
Comparing model predictions to experimental observations
The value of the MIC
The model based on the above three components contains three parameters: Km, I50, and V0/κ. The first two are known or measured in this work (table S2), while the last one, reflecting the basal CAT activity level (V0), is construct-specific. The model predicts a precipitous drop of growth rate across a threshold Cm concentration, which we identify as the theoretical MIC, whose value depends linearly on V0/κ as given by Eq. [S28]. Empirically, an abrupt drop of growth rate is indeed apparent in the batch culture (fig. S11), yielding a MIC value (0.9–1.0 mM) that agrees well with those determined in microfluidics and plate assays. Comparing this empirical MIC value with the predicted dependence of MIC on V0/κ (Eq. [S28]) fixes this lone unknown parameter to a value compatible with an independent estimate, based on the measured CAT activity V0 and indirect estimates of the permeability value κ (table S2).
Dependence on drug concentration
With V0/κ fixed, the model predicts Cm-dependent growth rates for this strain without any additional parameters (black lines, Fig. 4A). The upper branch of the prediction is in quantitative agreement with the growth rates of Cat1 measured in batch culture (filled circles, Fig. 4A; fig. S11). Additionally, when we challenged tetracycline-resistant strain Ta1 with either Tc or the tetracycline-analog minocycline (Mn) (39), observed growth rates also agreed quantitatively with the upper branch of the respective model predictions (fig. S12). Note also that in the absence of drug resistance or efflux, Eq. [4] predicts a smoothly decreasing growth rate with increasing drug concentration, which we observed for the growth of wild type cells over a broad range of concentrations (figs. S8C, S12C).
Figure 4. Growth rate predictions and phase diagram.

(A) Growth rate of Cat1 strain in minimal medium batch culture with varying Cm (filled circles) agrees quantitatively with the prediction of the growth feedback model (line) based on the measured MIC (dashed red line). Error bars SD; n ≥ 3. Dashed blue line is the theoretical MCC. Diamonds indicate drug levels at which enrichment experiments identified significant numbers of non-growing cells (fig. S7). (B) The MCC (blue line) and MIC (red line) predicted by the growth feedback model for strains with different degrees of basal CAT expression (V0) define a phase diagram, with the coexistence of growing and non-growing populations between the MCC and MIC (beige). MIC (circles, fig. S14) and MCC (diamonds, fig. S15) are measured for strains differing only in their levels of constitutive CAT expression (quantified by the relative CAT activity in the absence of Cm, given by the bar graph below). Error bars SD; n ≥ 2. (C) and (D) Measured and predicted growth rate (circles and lines of like colors), in minimal medium with varying Cm for strains of known relative CAT activities; the wild type is shown in blue for reference. Predictions were obtained by solving Eq. [S28] for V0/κ, using the measured MIC for strain Cat1 and the measured relative CAT activity between the different strains (bottom of panel B), without any parameter fitting.
The model also predicts a lower branch with very low growth rates, and a range of Cm concentrations below MIC where the upper and lower branches coexist (shaded area, Fig. 4A). We identify the lower edge of this band as the theoretical MCC because a uniformly growing population is predicted for Cm concentrations below this value. Indeed, the occurrence of non-growing cells for strain Cat1 (open diamonds in Fig. 4A) coincided with the shaded area. Likewise for strain Ta1, respective microfluidic and Amp enrichment experiments with Tc (fig. S8) and Mn (fig. S13) revealed non-growing cells within the theoretical coexistence region (lower branches in fig. S12).
Dependence on CAT expression: phase diagram
The growth-mediated feedback model makes quantitative predictions on how the MIC and MCC depend on the basal CAT expression of the strain (V0/κ), as shown in the phase diagram of Fig. 4B. The MIC (red line) is predicted to increase linearly with V0/κ, while the MCC (blue line) is predicted to increase as (Eqs. [S28] and [S39] respectively). These two lines define a wedge in the parameter space of [Cm]ext and V0/κ, terminating at a bifurcation point (purple point in inset), below which a uniformly growing population is predicted (see Eq. [S24]). We tested these predictions using five additional strains (Cat2 through Cat6; tables S1, S3), designed to provide reduced degrees of constitutive CAT expression; see quantitation of V0 for each strain at bottom of Fig. 4B. Assuming that the permeability κ does not differ significantly across these strains, the measured CAT activities give V0/κ for all strains (relative to that of Cat1), as shown by the grey arrows in Fig. 4B. Figure 4B also displays the batch culture MIC (comparable to MICplate values, fig. S14) and MCC values (fig. S15) obtained for these strains as numbered circles and diamonds respectively. The model predictions (lines) capture these observations well except close to the bifurcation point (e.g., in strain Cat5, inset), without adjusting any parameters. Note that as the feedback model is based on steady state relations (Eqs. [3], [4]), it is not expected to describe the kinetics of transition into the non-growing state nor its frequency of occurrence, which likely depend on complex stochastic processes. However, in all our experiments we never observed growth bistability at drug concentrations below the predicted MCC.
The CAT activities (V0/κ, bottom of Fig. 4B) can also be used to predict growth rate reductions (λ/λ0) for these strains for concentrations below the MIC. The predictions are plotted together with the data (lines and circles of like colors) in Figs. 4C and 4D. The predictive power of the model is rather remarkable as the lines are not fits to the data, but merely solutions to Eqs. [S15] and [S5] using the measured values of V0 as input. Comparable agreements are obtained using the empirical MIC value for each strain (fig. S16). In contrast, an identical model lacking growth-mediated feedback cannot account for the Cm-dependence of the growth rates of these strains, particularly the abrupt drop in growth at MIC in strains Cat1-Cat3 (fig. S17). Even incorporating stochasticity into this deterministic alternative model could not resolve this basic qualitative disagreement with our observations (see (40), section 2.5).
Fitness landscapes
Figure 5A gives the full solution of the model for strains with a range of CAT activity (V0/κ) in medium with varying Cm concentration ([Cm]ext). The colored lines reproduce the predicted growth rates of several strains from Figs. 4C–D and span a range of behaviors, from sub-critical to bistable. Viewing this plot orthogonally, the white line illustrates growth rates in an environment of fixed Cm concentration for strains of different CAT activities. As the CAT activity levels (V0) are determined directly by molecular properties encoded by the genotype, e.g., the promoter or ribosomal binding sequences (table S3) and the coding sequence of the CAT gene, the white line describes a relation between the growth rate and the genotype, and may be regarded as a “fitness landscape”. There is such a fitness landscape for each environmental Cm concentration. For these fitness landscapes are plateau-shaped, characterized by a threshold level of CAT activity (Survival Resistance Threshold, VSRT) across which the growth of the culture changes abruptly (diagonal dashed line, Fig. 5B).
Figure 5. Fitness landscapes of drug resistance.
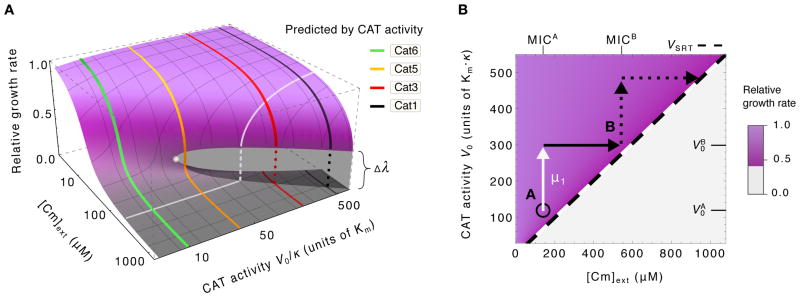
(A) Predicted growth rates (height of surface) for arbitrary CAT activity and Cm levels (V0 and [Cm]ext respectively): High (purple surface) and low growth rates (grey surface) overlap in the region of coexistence (growth bistability) that terminates at the bifurcation point (filled white circle). Predictions from Fig. 4C–D are reproduced here (colored lines). The orthogonal white line illustrates the expected effect of changing CAT activity at a fixed Cm concentration; it can be viewed as a plateau-shaped fitness landscape. (B) The survival resistance threshold required for growth, VSRT, is predicted to vary linearly with the drug concentration (diagonal black dashed line). For a population initially at point A (black circle) in the phase diagram, i.e., with resistance activity and surviving in niches with [Cm]ext < MICA, a mutation (μ1, white arrow) that increases the resistance activity level to can “expand its range” (45) and proliferate into all niches with MICA ≤ [Cm]ext ≤ MICB without competition (solid black arrow). Additional mutations, e.g. upstream of the gene at the ribosomal binding sequence (see table S3), or gene amplification events (69) provide a simple pathway for sequential expansions into increasingly harsh environments (45, 70).
Recent theoretical analysis (45) characterizes how bacteria can evolve through plateau-shaped fitness landscapes with drug-dependent survival thresholds, and demonstrates how landscape structure can determine the rate at which antibiotic resistance emerges in environments that precipitate rapid adaptation (45–47), see illustration in Fig. 5B. Specifically, in environments containing a spatial gradient of drug concentrations, the plateau-shaped landscape ensures that a large population of cells is always near an uninhabited niche of higher drug concentration (due to the respectively high and low growth rates on either side of the threshold). Therefore mutants in this population expand into regions of higher drug concentration without competition, and adaptation like this can continue in ratchet-like fashion to allow the population to survive in increasingly higher concentrations of antibiotics.
DISCUSSION
The drugs investigated in this study (Cm, Tc, and Mn) are infrequently prescribed today. Because of this, they are among only a handful of antibiotics that remain effective against “pan-resistant” bacteria, i.e. those resistant to all other standard drugs and polymixins, and have been advocated as a last line of defense (48, 49). Therefore, understanding the effect of these drugs on drug resistance expression is critical. More broadly, many other antibiotics also affect gene expression in a variety of bacteria and fungi (13, 50, 51), raising the general question about the effect of drug/drug resistance interaction on cell growth, and the consequences of this interaction on the efficacy of treatment programs and the long-term evolvability of drug resistance.
We have shown here that for the class of translation-inhibiting antibiotics, the fitness of resistance-expressing bacteria exposed to antibiotics can be quantitatively predicted with a few empirical parameters that are readily determined by the physiological characteristics of the cells. Our minimal model is based on the physiology of drug-cell interactions and the biochemistry of drug resistance. Although it neglects many details, e.g. the fitness cost of expressing resistance that may matter when small differences in fitness determine the emergence of resistance (52, 53), this minimal approach already captures the generic existence of a plateau-shaped fitness landscape that can facilitate emerging drug-resistant mutants to invade new territories without competition (45). These plateau-shaped fitness landscapes accompany the phenomenon of growth bistability, which arises from positive feedback. As demonstrated here, these positive feedback effects do not require special regulatory mechanisms or any molecular cooperativity, and are not limited to a specific enzymatic mechanism of drug resistance. Furthermore, these effects cannot be understood by merely analyzing some local genetic circuits but are instead derived from the global coordination of gene expression during growth inhibition (16). Therefore, we expect the growth bistability and the accompanying plateau-shaped fitness landscape to be robust features innate to drug-resistant bacteria.
Growth bistability in drug response has previously been theorized to occur for bacteria lacking drug-resistance, and for antibiotics of low membrane permeability (54). These considerations are not applicable to the systems we study here, since wild type cells grew homogeneously in the presence of antibiotics tested, and only cells expressing drug resistance exhibited growth bistability when cultured in the presence of antibiotics. The observed growth bistability is also unlikely to arise from to a recently described inoculum effect (55), in which two separate cultures with identical concentration of certain drugs may exhibit distinct growth rates depending on the culture inoculant density: First, bacteriostatic drugs investigated here (Cm and Tc) have been shown not to exhibit the inoculum effect (55, 56). Second, the inoculum effect concerns the differences between separate cultures, whereas we observed coexistence of growing and non-growing subpopulations in a single homogeneous culture.
We also considered the relationship between the drug-induced growth bistability studied here and the phenotypic bistability implicated in causing natural persistence, identified as the source of many long-term, refractory bacterial infections (19, 57, 58). These are, first of all, clearly distinct phenomena which nevertheless can be easily be mistaken for one another: the effect we studied is an innate response to drug for cells carrying drug resistance, while natural persistence refers to spontaneous entry into the non-growing state (which can occur in the absence of drugs) for drug-sensitive strains. Also, the frequency of non-growing cells is typically very low (~0.1%) in natural persistence, but it can be macroscopic (even greater than 80%) for the drug-induced effect. Finally, a cell achieves natural persistence by producing toxin proteins to inhibit its own growth (33, 58), whereas the effect studied here is an obligatory response to the applied drugs, rooted deeply in the organization of bacterial growth control (16).
However, there also exist a number of important parallels between these two phenomena that cannot be overlooked and may be exploited to understand natural persistence: Researchers have devoted many efforts and resources to understanding the mechanisms underlying bistability in natural persistence, whereas here we show that bistability can arise without complex regulation when gene expression is coupled to the state of cell growth. A similar general strategy may also underlie natural persistence, with cell growth inhibited by a toxic endogenous gene product whose expression would likely be affected by global growth-dependent effects (57–59). The precise effects of growth inhibition on gene expression will depend on the specific mode of growth limitations imposed upon cellular metabolism by the various toxin systems (60). Characterizing these feedback effects, in the manner we have done here for antibiotic resistance, may yield critical clues needed to formulate a quantitative, physiological understanding of natural persistence.
The fact that drugs can induce growth bistability, i.e., antibiotics can have a wildly heterogeneous effect on genetically identical cells in a homogeneous environment, calls into question the current methods of characterizing drug efficacies, which are often performed in bulk growth conditions (21). It provides a new perspective on basic notions of drug resistance, including the MIC, which begs for a more careful empirical definition to avoid vast inconsistencies across laboratories (61, 62). It is rather remarkable that large fractions of bacterial cells can remain vulnerable to an antibiotic (i.e., stop growing) even though they carry genes providing resistance to it; understanding the mechanisms that force cells into the non-growing state could enable the development of new treatment strategies against drug-resistant bacteria. On the other hand, heterogeneous effects may require a more careful reexamination of the effectiveness of combinatorial drug treatment (43, 63), because strains resistant to one drug may produce macroscopic fractions of growing and non-growing cells that respond very differently to a second drug, which may affect the evolution of drug resistance (63). The success of the phenomenological model presented here for the class of translation-inhibiting antibiotics gives the hope that predictive models may be similarly developed for other types of drug action, including combinations of drugs, to facilitate the formulation of strategies that limit the efficacy and evolvability of drug resistance.
METHODS
Culture and Cell Growth
Media and chemicals
Unless noted elsewhere, minimal medium refers to a mixture of glucose 0.4% (w/v), NH4Cl 20 mM, and “N−C−” buffer (64) consisting of 1.0 g of K2SO4, 17.7 g K2HPO4•3H2O, 4.7 g KH2PO4, 0.1 g MgSO4•7H2O, and 2.0 g NaCl per liter, with 6 mM sodium acetate when indicated. Chloramphenicol (Sigma C0378) stock solutions were either 2 mg/ml or 25 mg/ml Cm in 70% isopropanol stock solution. Tetracycline hydrochloride (Sigma T4062) stock solutions contained either 0.1 mg/mL Tc•HCl or 25 mg/ml Tc•HCl in deionized H2O; minocycline hydrochloride (Sigma M9511) stock solution contained 10 mM Mn•HCl. These stock solutions were stored at −20 °C in the dark and used for preparation of media with various concentrations of antibiotics. Antibiotics were added to media at time of experiment as described below, and for chloramphenicol, stock concentration was chosen such that the volume added would not exceed 1.5% of total media volume.
LB agar plates containing Cm were prepared the day of experiments as follows: after autoclaving freshly mixed LB agar, 100 mL aliquots were poured into 250 mL Erlenmeyer flasks and cooled to approximately 50 °C. A volume of Cm solution was then pipetted from an appropriate stock into the liquid agar (to achieve the desired concentration) and swirled both clockwise and counterclockwise for 10 seconds to mix the agar. We then poured approximately 25 mL medium plus agar into each 100 mm × 15 mm petri dish (Fisherbrand).
Batch culture growth
All batch cultures grew at 37 °C in a water bath shaker at 250 rpm (New Brunswick Scientific G76D) with a covered basin to protect and photosensitive chemicals (e.g. tetracycline) from degradation and to prevent heat bath from evaporating. Culture growth and measurements performed on separate days began with unique seed cultures each day. Each 5 mL seed culture grew to saturation in LB broth from a single colony on an LB plate. Seed cultures were diluted into 5 mL precultures containing minimal media and grown overnight without antibiotic. Except as noted below, experimental cultures were diluted from overnight precultures into 5 mL minimal media supplemented with appropriate antibiotics in 20 mm diameter glass tubes. Experimental cultures were inoculated to initial optical density of OD600 ~ 0.01, as measured by a Thermo Scientific Genesys 20 spectrophotometer, using a Starna Cells quartz cuvette with a 10 mm light path. At intervals ranging from 40 minutes to two hours, we took 250 μL samples from growing cultures to measure OD600. For growth in tetracycline or minocycline, to control for thermolability or photosensitivity (65, 66), we diluted growing cultures 10–20 fold into fresh identical media to verify that culture age did not affect growth rate over the course of our experiments.
Growth with strains expressing CAT in chloramphenicol
We followed the same procedure as described above, except we began experiments with ~60-fold lower cell densities in bulk cultures to avoid significant degradation of Cm by CAT during the course of growth. Briefly, experimental cultures were diluted from overnight precultures into a larger volume of 10 mL minimal media supplemented with appropriate Cm and acetate in larger 25 mm diameter glass tubes. From the larger experimental culture volume we pipetted 1 mL samples into a Starna Cells quartz cuvette with a 40 mm light path to record optical density. Use of the cuvette with longer path length allowed us to observe cultures at four-fold lower densities using the same Genesys spectrophotometer as above. Experimental cultures were inoculated to a maximum initial density of OD6004x ~ 0.0007 determined by the larger cuvette (OD600 ~ 0.0002). In this manner, we were able to achieve steady exponential growth observable up to at least OD6004x~0.1 with this cuvette (see green symbols in fig. S11).
Determination of the growth rate and MIC
Exponential growth curves for all cultures were fit over approximately three or more generations of doubling by linear regression of log-OD values; steady state was not assumed until cultures underwent at least 2 generations of approximately constant exponential growth. When indicated, uncertainty in the calculated growth rate is standard error (SE) of the resultant slope from the simple linear regression. A growth rate of zero indicates cultures failed to grow after at least 12 hours, or stopped growing within several doublings after addition of antibiotic (e.g., see black triangles in fig. S11). If results were ambiguous at a particular Cm concentration, for example if a culture appeared not to grow for 6 hours and then exhibited fast growth (which occurred rarely), the experiment was repeated in full. For chloramphenicol- and tetracycline- resistant strains, we determined MIC by monitoring optical density of batch cultures as described above (see Figure 3B–C, fig. S11); we determined that cultures contained [Cm] ≥ MIC if cultures failed to grow, or if growth rate λ ≤ 0.1 hr−1. For strains with high levels of antibiotic resistance (most strains), MIC was unambiguous in that growth was undetectable above some threshold concentration (see, e.g., fig. S11). We first determined MICs with antibiotic concentrations set at logarithmic intervals before using finer gradations at linear intervals to achieve a determination within ~10% error. As our quantitative model is formulated based on growth in batch cultures, we use these MICs determined in batch cultures wherever we provide model predictions or fits. Additionally, the MIC determined on agar plates (called MICplate, see figs. S2, 13 and methods below) and in the microfluidic device (Fig. 2C–D generally agreed with these determinations.
Growth of colonies on agar plates
Determining CFU on plates with chloramphenicol
For each strain, cells from log phase batch cultures grown in minimal medium lacking Cm were diluted with the same medium. We then used sterile glass beads (Kimble, 4 mm) to spread 50 μL of the diluted culture onto a LB-Cm agar plate to achieve a density of several hundred cells per plate (giving rise to several hundred colonies or fewer after incubation, depending on the strain’s response to the particular Cm concentration used). Plates were incubated overnight (~18 hours) at 37 °C such that colonies formed were easily resolved by the naked eye (see figs. S2B–C and 3B). We used Bio-Rad Gel Doc XR and Quantity One software to photograph plates and count colonies; in many cases colonies were also counted manually. We calibrated the counting software to agree with manual counts. Plate images were enhanced for brightness and contrast.
Determination of MICplate
Similar to above, cells were diluted from log phase in absence of antibiotics, and 50 μL of diluted culture were spread onto LB-Cm agar plates to achieve a density of ~5–8×10⁴ cells per plate before incubation. Plates were incubated overnight (~18 hours) at 37 °C to reveal colony formation. MICplate is taken as the Cm concentration above which colonies appeared at a frequency of less than ~10−4 per inoculant; presence or absence of colony growth was readily visually discernable, (figs. S2, S3, S14). We determined MICplate values for each strain after at least two replicate experiments and plate images were enhanced for brightness and contrast. These MICplate values obtained with LB plates for antibiotic resistant strains were similar to MIC values obtained in batch culture with minimal media as described above. Coincidence between MIC determined in LB and minimal media has been reported elsewhere (43).
Viability after ampicilin enrichment assays
Cells from overnight batch cultures in drug-free minimal media were diluted into the same fresh media with the indicated concentration of “drug” (Cm or Mn as designated in the text) and incubated for 1–2 hours. Cultures were then diluted into identical medium (containing Cm or Mn) with the further addition of Amp (100 μg/ml) to an OD600 of ~1–2×10⁻³. At this time, 50 μL aliquots of culture and 100-fold diluted culture were spread onto LB-agar plates lacking any antibiotics and incubated overnight, producing plates containing ~500 and ~5×10⁴ colonies each. These plates provide a control to monitor CFU at the start of enrichment and allow us to determine the fraction of cells killed by the enrichment procedure at each drug concentration. After 6–7 hours enrichment in drug and Amp media, 50 μL aliquots of culture and 100-fold diluted culture were again spread onto LB plates without antibiotics for overnight incubation; see fig. S5 for illustration. All plates and batch cultures were incubated at 37 °C. Plate images were enhanced for brightness and contrast (figs. S7, S12, S14).
Microfluidic experiments
Cell growth in microfluidic chambers
All cultures were grown at 37 °C. The growth medium was minimal medium as described above, and was filtered through 0.45 μm filters before use. The cells were first cultured in LB broth in 20 mm test tubes with shaking (250 rpm) in a water bath (New Brunkswick Scientific). After 5~6 hrs of growth, they were transferred to the growth medium and grew overnight in the same condition (pre-culture). The pre-culture was inoculated with fewer than 105 cells/ml so that cells were in an exponential phase at the time of experiment. The next morning, the pre-culture was diluted to a fresh growth medium containing 0.1% BSA (bovine serum albumin, Sigma; BSA prevents cells from binding to surfaces of microfluidic devices) to an optical density (OD600) of ~0.01 as measured on a Genesys20 spectrophotometer (Thermo-Fisher) with the standard cuvette (16.100-Q-10/Z8.5, Starna Cells Incl; ~200 μL per measurement). To load cells into the microfluidic device, the diluted pre-culture was pressurized to 1 ~ 2 psi at the outlet of the device (fig. S4A). When the channel and growth chambers were completely filled with the pre-culture, the pre-culture source was removed and fresh growth medium was introduced from the inlet of the device.
The microfluidic device was fixed onto a motorized microscope stage equipped with autofocus (Proscan II, Prior) in a fluorescent microscope (Nikon TI-U) that were housed in a microscope incubator (InVivo Scientific). When viewed with a charge-coupled device (CCD) camera (Clara, Andor) with a 60x phase-contrast objective, single cells were dispersed far from each other (more than 100 μm away from each other). Then −0.5 ~ −1.5 psi of vacuum was applied from the outlet to bring down the ceiling of the growth chambers and loosely sandwich the cells in place (side view of fig. S4). Since the vacuum induces the fresh medium flow in a channel (flow rate of 50~100 μm/s), no additional pressure was applied from the inlet.
After ~2 generations of unperturbed growth at 37 °C in the device, we gently flushed excess cells away to prevent crowding and enable cell tracking, and then introduced growth medium with various concentrations of chloramphenicol to the inlet of the device. The 10 ~ 30 positions that contained a single micro-colony in the view (~100 μm × ~100 μm) of the CCD were saved in the motorized stage. Phase contrast images of the growing cells for each position were recorded 2 times per doubling. Fluorescence images were taken once per doubling, immediately after phase contrast images for each position with a Xenon excitation lamp (Sutter Inst.). The images were analyzed with a custom-built Matlab program. First, the program identified pixel positions occupied by cells with phase contrast images, obtained the size of a growing colony in time series for each position and calculated the growth rate of the colony. In order to quantify fluorescence levels, fluorescence intensities over the cell-occupying area identified by phase contrast images were averaged.
Enriching Cm-resistant cells with ampicillin in microfluidic chambers
First, cells that constitutively express GFP (GCat1m) were transferred from precultures as described above and grown in medium with 0.7 mM of Cm for 8 hours. Initially, 44% of cells grew with the doubling rate of 130 min, which is similar to growth of Cat1m (Fig. 2C). We added 200 μg/mL of Amp to the medium at t=9 hr to kill growing cells (fig. S6). At t=24 hr, all growing cells had stopped growing and lost fluorescence. There were several non-growing cells that kept green fluorescence. At t=25 hr, Cm and Amp were removed from the medium. Between 33 ≤ t ≤ 37 hr, the non-growing cells that kept their fluorescence throughout the enrichment resumed growth.
Additional protocols
Details regarding strain construction, microfluidic device fabrication, CAT and β-galactosidase assays are described elsewhere (40).
Supplementary Material
Acknowledgments
We are grateful to Lin Chao, Mans Ehrenberg, Peter Geiduschek, Hiroshi Nikaido, Stefan Klumpp, Matthew Scott, Bill Shaw, and members of the Hwa lab for comments and suggestions. This work was supported by the NIH through grant R01-GM095903 to TH, by the NSF, through a NSF Graduate Research Fellowship to JBD and through the Center for Theoretical Biological Physics (PHY0822283), and by the NCI via a subcontract of the Physical Science-Oncology program (1 U54 CA143803). RH is supported in part by the NWO (VENI 680-47-419).
Footnotes
Materials and Methods
Additional data, including source data for figures, are presented in Supporting Online Material.
References and notes
- 1.Alanis AJ. Resistance to antibiotics: are we in the post-antibiotic era? Archives of medical research. 2005;36:697–705. doi: 10.1016/j.arcmed.2005.06.009. [DOI] [PubMed] [Google Scholar]
- 2.World Health Organization. The evolving threat of antimicrobial resistance: Options for action. World Health Organization; 2012. [Google Scholar]
- 3.Martínez JL, Baquero F, Andersson DI. Predicting antibiotic resistance. Nat Rev Microbiol. 2007;5:958–65. doi: 10.1038/nrmicro1796. [DOI] [PubMed] [Google Scholar]
- 4.MacLean RC, Hall AR, Perron GG, Buckling A. The population genetics of antibiotic resistance: integrating molecular mechanisms and treatment contexts. Nat Rev Genet. 2010;11:405–14. doi: 10.1038/nrg2778. [DOI] [PubMed] [Google Scholar]
- 5.McArthur AG, et al. The Comprehensive Antibiotic Resistance Database. Antimicrobial agents and chemotherapy. 2013;57:3348–3357. doi: 10.1128/AAC.00419-13. [DOI] [PMC free article] [PubMed] [Google Scholar]
- 6.Cavalli LL, Maccacaro GA. Chloromycetin resistance in E. coli, a case of quantitative inheritance in bacteria. Nature. 1950;4232:991–2. doi: 10.1038/166991a0. [DOI] [PubMed] [Google Scholar]
- 7.Toprak E, et al. Evolutionary paths to antibiotic resistance under dynamically sustained drug selection. Nat Genet. 2011;44:101–105. doi: 10.1038/ng.1034. [DOI] [PMC free article] [PubMed] [Google Scholar]
- 8.Maskell DJ, Hormaeche CE, Harrington KA, Joysey HS, Liew FY. The initial suppression of bacterial growth in a salmonella infection is mediated by a localized rather than a systemic response. Microbial pathogenesis. 1987;2:295–305. doi: 10.1016/0882-4010(87)90127-6. [DOI] [PubMed] [Google Scholar]
- 9.Batten C, McCune RM. The influence of corticotrophin and certain corticosteroids on populations of Mycobacterium tuberculosis in tissues of mice. British Journal of Experimental Pathology. 1957;38:413–423. [PMC free article] [PubMed] [Google Scholar]
- 10.Li Y, Karlin A, Loike JD, Silverstein SC. A critical concentration of neutrophils is required for effective bacterial killing in suspension. Proc Natl Acad Sci U S A. 2002;99:8289–94. doi: 10.1073/pnas.122244799. [DOI] [PMC free article] [PubMed] [Google Scholar]
- 11.Malka R, Wolach B, Gavrieli R, Shochat E, Rom-kedar V. Evidence for bistable bacteria-neutrophil interaction and its clinical implications. 2012;122 doi: 10.1172/JCI59832.3002. [DOI] [PMC free article] [PubMed] [Google Scholar]
- 12.Washington JA. The effects and significance of subminimal inhibitory concentrations of antibiotics. Rev Infect Dis. 1979;1:781–786. doi: 10.1093/clinids/1.5.781. [DOI] [PubMed] [Google Scholar]
- 13.Davies J, Spiegelman GB, Yim G. The world of subinhibitory antibiotic concentrations. Curr Opin Microbiol. 2006;9:445–53. doi: 10.1016/j.mib.2006.08.006. [DOI] [PubMed] [Google Scholar]
- 14.Tan C, Marguet P, You L. Emergent bistability by a growth-modulating positive feedback circuit. Nat Chem Biol. 2009;5:842–848. doi: 10.1038/nchembio.218. [DOI] [PMC free article] [PubMed] [Google Scholar]
- 15.Zaslaver A, et al. Invariant distribution of promoter activities in Escherichia coli. PLoS Comput Biol. 2009;5:e1000545. doi: 10.1371/journal.pcbi.1000545. [DOI] [PMC free article] [PubMed] [Google Scholar]
- 16.Scott M, Gunderson CW, Mateescu EM, Zhang Z, Hwa T. Interdependence of cell growth and gene expression: origins and consequences. Science. 2010;330:1099–102. doi: 10.1126/science.1192588. [DOI] [PubMed] [Google Scholar]
- 17.Bollenbach T, Kishony R. Resolution of gene regulatory conflicts caused by combinations of antibiotics. Mol Cell. 2011;42:413–25. doi: 10.1016/j.molcel.2011.04.016. [DOI] [PMC free article] [PubMed] [Google Scholar]
- 18.Scott M, Hwa T. Bacterial growth laws and their applications. Curr Opin Biotechnol. 2011;22:559–65. doi: 10.1016/j.copbio.2011.04.014. [DOI] [PMC free article] [PubMed] [Google Scholar]
- 19.Dubnau D, Losick R. Bistability in bacteria. Molecular microbiology. 2006;61:564–72. doi: 10.1111/j.1365-2958.2006.05249.x. [DOI] [PubMed] [Google Scholar]
- 20.Smits WK, Kuipers OP, Veening JW. Phenotypic variation in bacteria: the role of feedback regulation. Nat Rev Microbiol. 2006;4:259–71. doi: 10.1038/nrmicro1381. [DOI] [PubMed] [Google Scholar]
- 21.Andrews JM. Determination of minimum inhibitory concentrations. J Antimicrob Chemother. 2001;48 (Suppl 1):5–16. doi: 10.1093/jac/48.suppl_1.5. [DOI] [PubMed] [Google Scholar]
- 22.Harvey RJ, Koch AL. How partially inhibitory concentrations of chloramphenicol affect the growth of Escherichia coli. Antimicrob Agents Chemother. 1980;18:323–37. doi: 10.1128/aac.18.2.323. [DOI] [PMC free article] [PubMed] [Google Scholar]
- 23.Ellis J, Bagshaw CR, Shaw W. Kinetic mechanism of chloramphenicol acetyltransferase: the role of ternary complex interconversion in rate determination. Biochemistry. 1995;34:16852–16859. doi: 10.1021/bi00051a036. [DOI] [PubMed] [Google Scholar]
- 24.Shaw W. Chloramphenicol acetyltransferase: enzymology and molecular biology. CRC Crit Rev Biochem. 1983;14:1–46. doi: 10.3109/10409238309102789. [DOI] [PubMed] [Google Scholar]
- 25.Harbottle H, Thakur S, Zhao S, White DG. Genetics of antimicrobial resistance. Anim Biotechnol. 2006;17:111–24. doi: 10.1080/10495390600957092. [DOI] [PubMed] [Google Scholar]
- 26.Foster TJ. Plasmid-Determined Resistance to Antimicrobial Drugs and Toxic Metal Ions in Bacteria. Microbiol Rev. 1983;47:361–409. doi: 10.1128/mr.47.3.361-409.1983. [DOI] [PMC free article] [PubMed] [Google Scholar]
- 27.Piddock L. Clinically relevant chromosomally encoded multidrug resistance efflux pumps in bacteria. Clin Microbiol Rev. 2006;19:382–402. doi: 10.1128/CMR.19.2.382-402.2006. [DOI] [PMC free article] [PubMed] [Google Scholar]
- 28.Groisman A, et al. A microfluidic chemostat for experiments with bacterial and yeast cells. Nat Methods. 2005;2:685–689. doi: 10.1038/nmeth784. [DOI] [PubMed] [Google Scholar]
- 29.Rahal J, Simberkoff M. Bactericidal and Bacteriostatic Action of Chloramphenicol Against Meningeal Pathogens. Antimicrobial agents and …. 1979;16:13–18. doi: 10.1128/aac.16.1.13. [DOI] [PMC free article] [PubMed] [Google Scholar]
- 30.Bigger J. Treatment of staphylococcal infections with penicillin by intermittent sterilisation. The Lancet. 1944:497–500. [Google Scholar]
- 31.Balaban NQ, Merrin J, Chait R, Kowalik L, Leibler S. Bacterial persistence as a phenotypic switch. Science. 2004;305:1622–5. doi: 10.1126/science.1099390. [DOI] [PubMed] [Google Scholar]
- 32.Lewis K. Persister cells, dormancy and infectious disease. Nat Rev Microbiol. 2007;5:48–56. doi: 10.1038/nrmicro1557. [DOI] [PubMed] [Google Scholar]
- 33.Gerdes K, Maisonneuve E. Bacterial persistence and toxin-antitoxin loci. Annual review of microbiology. 2012;66:103–23. doi: 10.1146/annurev-micro-092611-150159. [DOI] [PubMed] [Google Scholar]
- 34.Schlegel HG, Jannasch HW. Enrichment cultures. Annu Rev Microbiol. 1967;21:49–70. doi: 10.1146/annurev.mi.21.100167.000405. [DOI] [PubMed] [Google Scholar]
- 35.Cozens R, et al. Evaluation of the bactericidal activity of beta-lactam antibiotics on slowly growing bacteria cultured in the chemostat. Antimicrob Agents Chemother. 1986;29:797–802. doi: 10.1128/aac.29.5.797. [DOI] [PMC free article] [PubMed] [Google Scholar]
- 36.Jawetz E, Gunnison J, Speck R, Coleman V. Studies on antibiotic synergism and antagonism: the interference of chloramphenicol with the action of penicillin. American Medical Association Archives of internal medicine. 1951;87:349–59. doi: 10.1001/archinte.1951.03810030022002. [DOI] [PubMed] [Google Scholar]
- 37.Holm SE. Interaction between beta-lactam and other antibiotics. Rev Infect Dis. 1986;8:S305–S314. doi: 10.1093/clinids/8.supplement_3.s305. [DOI] [PubMed] [Google Scholar]
- 38.Schnappinger D, Hillen W. Tetracyclines: antibiotic action, uptake, and resistance mechanisms. Arch Microbiol. 1996;165:359–69. doi: 10.1007/s002030050339. [DOI] [PubMed] [Google Scholar]
- 39.Chopra I, Roberts M. Tetracycline antibiotics: mode of action, applications, molecular biology, and epidemiology of bacterial resistance. Microbiol Mol Biol Rev. 2001;65:232–260. doi: 10.1128/MMBR.65.2.232-260.2001. [DOI] [PMC free article] [PubMed] [Google Scholar]
- 40.See supporting materials and methods in Science Online.
- 41.McMurry LM, George A, Levy SB. Active efflux of chloramphenicol in susceptible Escherichia coli strains and in multiple-antibiotic-resistant (Mar) mutants. Antimicrob Agents Chemother. 1994;38:542. doi: 10.1128/aac.38.3.542. [DOI] [PMC free article] [PubMed] [Google Scholar]
- 42.Here and elsewhere in the text, “expression level” denotes the intracellular concentration of a protein. This is reported in units of protein activity per OD: Protein activity is proportional to the protein amount. OD units correspond reliably to cell volume (57, 67, 68).
- 43.Bollenbach T, Quan S, Chait R, Kishony R. Nonoptimal Microbial Response to Antibiotics Underlies Suppressive Drug Interactions. Cell. 2009;139:707–718. doi: 10.1016/j.cell.2009.10.025. [DOI] [PMC free article] [PubMed] [Google Scholar]
- 44.Maaløe O. In: Biological Regulation and Development. Goldberger RF, editor. Plenum Press; New York: 1979. pp. 487–542. [Google Scholar]
- 45.Hermsen R, Deris JB, Hwa T. On the rapidity of antibiotic resistance evolution facilitated by a concentration gradient. Proc Natl Acad Sci U S A. 2012;109:10775–80. doi: 10.1073/pnas.1117716109. [DOI] [PMC free article] [PubMed] [Google Scholar]
- 46.Zhang Q, et al. Acceleration of emergence of bacterial antibiotic resistance in connected microenvironments. Science. 2011;333:1764–7. doi: 10.1126/science.1208747. [DOI] [PubMed] [Google Scholar]
- 47.Greulich P, Waclaw B, Allen R. Mutational Pathway Determines Whether Drug Gradients Accelerate Evolution of Drug-Resistant Cells. Phys Rev Lett. 2012;109:1–5. doi: 10.1103/PhysRevLett.109.088101. [DOI] [PubMed] [Google Scholar]
- 48.Falagas ME, Grammatikos AP, Michalopoulos A. Potential of old-generation antibiotics to address current need for new antibiotics. Expert review of anti-infective therapy. 2008;6:593–600. doi: 10.1586/14787210.6.5.593. [DOI] [PubMed] [Google Scholar]
- 49.Hayashi Y, Paterson D, Gould IM, Meer JWM, editors. Antibiotic Policies. 2012. The Epidemiology of Pan/Extreme Drug Resistance; pp. 27–38. [Google Scholar]
- 50.Nichterlein T, et al. Subinhibitory concentrations of beta-lactams and other cell-wall antibiotics inhibit listeriolysin production by Listeria monocytogenes. International journal of antimicrobial agents. 1996;7:75–81. doi: 10.1016/0924-8579(96)00014-3. [DOI] [PubMed] [Google Scholar]
- 51.Niewerth M, et al. Ciclopirox olamine treatment affects the expression pattern of Candida albicans genes encoding virulence factors, iron metabolism proteins, and drug resistance. Antimicrobial agents and chemotherapy. 2003;47:1805–1817. doi: 10.1128/AAC.47.6.1805-1817.2003. [DOI] [PMC free article] [PubMed] [Google Scholar]
- 52.Andersson DI, Hughes D. Antibiotic resistance and its cost: is it possible to reverse resistance? Nat Rev Microbiol. 2010;8:260–71. doi: 10.1038/nrmicro2319. [DOI] [PubMed] [Google Scholar]
- 53.Gullberg E, et al. Selection of resistant bacteria at very low antibiotic concentrations. PLoS pathogens. 2011;7:e1002158. doi: 10.1371/journal.ppat.1002158. [DOI] [PMC free article] [PubMed] [Google Scholar]
- 54.Elf J, Nilsson K, Tenson T, Ehrenberg M. Bistable Bacterial Growth Rate in Response to Antibiotics with Low Membrane Permeability. Phys Rev Lett. 2006;97:1–4. doi: 10.1103/PhysRevLett.97.258104. [DOI] [PubMed] [Google Scholar]
- 55.Tan C, et al. The inoculum effect and band-pass bacterial response to periodic antibiotic treatment. Molecular Systems Biology. 2012;8:617. doi: 10.1038/msb.2012.49. [DOI] [PMC free article] [PubMed] [Google Scholar]
- 56.Kohanski Ma, Dwyer DJ, Hayete B, Lawrence Ca, Collins JJ. A common mechanism of cellular death induced by bactericidal antibiotics. Cell. 2007;130:797–810. doi: 10.1016/j.cell.2007.06.049. [DOI] [PubMed] [Google Scholar]
- 57.Klumpp S, Zhang Z, Hwa T. Growth rate-dependent global effects on gene expression in bacteria. Cell. 2009;139:1366–75. doi: 10.1016/j.cell.2009.12.001. [DOI] [PMC free article] [PubMed] [Google Scholar]
- 58.Fasani RA, Savageau MA. Molecular mechanisms of multiple toxin-antitoxin systems are coordinated to govern the persister phenotype. Proc Natl Acad Sci U S A. 2013 doi: 10.1073/pnas.1301023110. [DOI] [PMC free article] [PubMed] [Google Scholar]
- 59.Lou C, Li Z, Ouyang Q. A molecular model for persister in E. coli. Journal of theoretical biology. 2008;255:205–9. doi: 10.1016/j.jtbi.2008.07.035. [DOI] [PubMed] [Google Scholar]
- 60.You C, et al. Coordination of bacterial proteome with metabolism by cyclic AMP signalling. Nature. 2013;500:301–306. doi: 10.1038/nature12446. [DOI] [PMC free article] [PubMed] [Google Scholar]
- 61.Snell JJ, Brown DF. External quality assessment of antimicrobial susceptibility testing in Europe. J Antimicrob Chemother. 2001;47:801–10. doi: 10.1093/jac/47.6.801. [DOI] [PubMed] [Google Scholar]
- 62.Varaldo PE. Antimicrobial resistance and susceptibility testing: an evergreen topic. J Antimicrob Chemother. 2002;50:1–4. doi: 10.1093/jac/dkf093. [DOI] [PubMed] [Google Scholar]
- 63.Michel J, Yeh PJ, Chait R, Moellering RC, Kishony R. Drug interactions modulate the potential for evolution of resistance. Proc Natl Acad Sci U S A. 2008;105:14918–14923. doi: 10.1073/pnas.0800944105. [DOI] [PMC free article] [PubMed] [Google Scholar]
- 64.Csonka LN, Ikeda TP, Fletcher Sa, Kustu S. The accumulation of glutamate is necessary for optimal growth of Salmonella typhimurium in media of high osmolality but not induction of the proU operon. J Bacteriol. 1994;176:6324–33. doi: 10.1128/jb.176.20.6324-6333.1994. [DOI] [PMC free article] [PubMed] [Google Scholar]
- 65.Loftin Ka, Adams CD, Meyer MT, Surampalli R. Effects of ionic strength, temperature, and pH on degradation of selected antibiotics. J Environ Qual. 2008;37:378–86. doi: 10.2134/jeq2007.0230. [DOI] [PubMed] [Google Scholar]
- 66.Stoichev T, Baptista MS, Basto MCP, Vasconcelos VM, Vasconcelos MTSD. Effects of minocycline and its degradation products on the growth of Microcystis aeruginosa. Ecotoxicol Environ Saf. 2011;74:219–24. doi: 10.1016/j.ecoenv.2010.10.015. [DOI] [PubMed] [Google Scholar]
- 67.Donachie W, Robinson A. In: Escherichia coli and Salmonella typhimurium: cellular and molecular biology. Neidhardt FC, et al., editors. American Society for Microbiology; Washington, DC: 1987. pp. 1578–1592. [Google Scholar]
- 68.Kubitschek HE, Baldwin WW, Schroeter SJ, Graetzer R. Independence of buoyant cell density and growth rate in Escherichia coli. J Bacteriol. 1984;158:296–9. doi: 10.1128/jb.158.1.296-299.1984. [DOI] [PMC free article] [PubMed] [Google Scholar]
- 69.Sandegren L, Andersson DI. Bacterial gene amplification: implications for the evolution of antibiotic resistance. Nat Rev Microbiol. 2009;7:578–88. doi: 10.1038/nrmicro2174. [DOI] [PubMed] [Google Scholar]
- 70.Hermsen R, Hwa T. Sources and Sinks: A Stochastic Model of Evolution in Heterogeneous Environments. Phys Rev Lett. 2010;105:2–5. doi: 10.1103/PhysRevLett.105.248104. [DOI] [PMC free article] [PubMed] [Google Scholar]
- 71.Datsenko KA, Wanner BL. One-step inactivation of chromosomal genes in Escherichia coli K-12 using PCR products. Proc Natl Acad Sci U S A. 2000;97:6640–5. doi: 10.1073/pnas.120163297. [DOI] [PMC free article] [PubMed] [Google Scholar]
- 72.Lutz R, Bujard H. Independent and tight regulation of transcriptional units in Escherichia coli via the LacR/O, the TetR/O and AraC/I1-I2 regulatory elements. Nucleic Acids Res. 1997;25:1203–10. doi: 10.1093/nar/25.6.1203. [DOI] [PMC free article] [PubMed] [Google Scholar]
- 73.Thomason LC, Costantino N, Court DL. In: Current protocols in molecular biology. Ausubel FM, editor. Chapter 1. John Wiley and Sons, Inc; New York: 2007. p. Unit 1.17. [Google Scholar]
- 74.Hillen W, Berens C. Mechanisms underlying expression of Tn10 encoded tetracycline resistance. Annu Rev Microbiol. 1994;48:345–69. doi: 10.1146/annurev.mi.48.100194.002021. [DOI] [PubMed] [Google Scholar]
- 75.Levine E, Zhang Z, Kuhlman T, Hwa T. Quantitative characteristics of gene regulation by small RNA. PLoS Biol. 2007;5:e229. doi: 10.1371/journal.pbio.0050229. [DOI] [PMC free article] [PubMed] [Google Scholar]
- 76.Kim M, et al. Need-based activation of ammonium uptake in Escherichia coli. Molecular Systems Biology. 2012;8:616. doi: 10.1038/msb.2012.46. [DOI] [PMC free article] [PubMed] [Google Scholar]
- 77.Shaw W. Chloramphenicol Acetyltransferase from Chloramphenicol-Resistant Bacteria. Methods in Enzymology. 1975;43:737. doi: 10.1016/0076-6879(75)43141-x. [DOI] [PubMed] [Google Scholar]
- 78.Seed B, Sheen JY. A simple phase-extraction assay for chloramphenicol acyltransferase activity. Gene. 1988;67:271–7. doi: 10.1016/0378-1119(88)90403-9. [DOI] [PubMed] [Google Scholar]
- 79.Miller JH. Experiments in Molecular Genetics. Cold Spring Harbor Laboratory Press; New York: 1972. pp. 352–355. [Google Scholar]
- 80.Garrett ER, Miller GH. Kinetics and Mechanisms of Action of Antibiotics on Microorganisms III. J Pharm Sci. 1965;54:427–431. doi: 10.1002/jps.2600540318. [DOI] [PubMed] [Google Scholar]
- 81.Comby S, Flandrois JP, Carret G, Pichat C. Mathematical modelling of bacterial growth at subinhibitory levels of aminoglycosides. Annales de lInstitut Pasteur Microbiology. 1988;139:613–629. doi: 10.1016/0769-2609(88)90159-7. [DOI] [PubMed] [Google Scholar]
- 82.Comby S, Flandrois J, Carret G, Pichat C. Mathematical Modelling Of Growth Of Escherichia Coli At Subinhibitory Levels Of Chloramphenicol Or Tetracyclines. Research in Microbiology. 1989;140:243–254. doi: 10.1016/0923-2508(89)90079-x. [DOI] [PubMed] [Google Scholar]
- 83.Epe B, Woolley P. The binding of 6-demethylchlortetracycline to 70S, 50S and 30S ribosomal particles: a quantitative study by fluorescence anisotropy. The European Molecular Biology Organization Journal. 1984;3:121–126. doi: 10.1002/j.1460-2075.1984.tb01771.x. [DOI] [PMC free article] [PubMed] [Google Scholar]
- 84.Contreras A, Vázquez D. Cooperative and antagonistic interactions of peptidyl-tRNA and antibiotics with bacterial ribosomes. European Journal of Biochemistry/FEBS. 1977;74:539–47. doi: 10.1111/j.1432-1033.1977.tb11422.x. [DOI] [PubMed] [Google Scholar]
- 85.Nikaido H, Thanassi DG. Penetration of Lipophilic Agents with Multiple Protonation Sites into Bacterial Cells: Tetracyclines and Fluoroquinolones as Examples. Antimicrob Agents Chemother. 1993;37:1393–1399. doi: 10.1128/aac.37.7.1393. [DOI] [PMC free article] [PubMed] [Google Scholar]
- 86.Hancock RE, Bell A. Antibiotic uptake into gram-negative bacteria. European Journal of Clinical Microbiology and Infectious Diseases. 1988;7:713–20. doi: 10.1007/BF01975036. [DOI] [PubMed] [Google Scholar]
- 87.McMurry LM, Aronson Da, Levy SB. Susceptible Escherichia coli cells can actively excrete tetracyclines. Antimicrob Agents Chemother. 1983;24:544–51. doi: 10.1128/aac.24.4.544. [DOI] [PMC free article] [PubMed] [Google Scholar]
- 88.Thanassi DG, Suh GSB, Nikaido H. Role of Outer Membrane Barrier in Efflux-Mediated Tetracycline Resistance of Escherichia coli. Microbiology. 1995;177:998–1007. doi: 10.1128/jb.177.4.998-1007.1995. [DOI] [PMC free article] [PubMed] [Google Scholar]
- 89.Nikaido H, Normark S. Sensitivity of Escherichia coli to various beta-lactams is determined by the interplay of outer membrane permeability and degradation by periplasmic beta-lactamases: a quantitative predictive treatment. Mol Microbiol. 1987;1:29–36. doi: 10.1111/j.1365-2958.1987.tb00523.x. [DOI] [PubMed] [Google Scholar]
- 90.Goh EB, et al. Transcriptional modulation of bacterial gene expression by subinhibitory concentrations of antibiotics. Proc Natl Acad Sci U S A. 2002;99:17025–30. doi: 10.1073/pnas.252607699. [DOI] [PMC free article] [PubMed] [Google Scholar]
- 91.Rotem E, et al. Regulation of phenotypic variability by a threshold-based mechanism underlies bacterial persistence. Proc Natl Acad Sci U S A. 2010;107:12541–6. doi: 10.1073/pnas.1004333107. [DOI] [PMC free article] [PubMed] [Google Scholar]
- 92.Nordström K, Ingram LC, Lundbäck A. Mutations in R factors of Escherichia coli causing an increased number of R-factor copies per chromosome. J Bacteriol. 1972;110:562–9. doi: 10.1128/jb.110.2.562-569.1972. [DOI] [PMC free article] [PubMed] [Google Scholar]
- 93.Mortimer PGS, Piddock LJV. The accumulation of five antibacterial agents in porin-deficient mutants of Escherichia coli. J Antimicrob Chemother. 1993;32:195–213. doi: 10.1093/jac/32.2.195. [DOI] [PubMed] [Google Scholar]
- 94.Li XZ, Livermore DM, Nikaido H. Role of efflux pump(s) in intrinsic resistance of Pseudomonas aeruginosa: resistance to tetracycline, chloramphenicol, and norfloxacin. Antimicrob Agents Chemother. 1994;38:1732–41. doi: 10.1128/aac.38.8.1732. [DOI] [PMC free article] [PubMed] [Google Scholar]
- 95.Novo DJ, Perlmutter NG, Hunt RH, Shapiro HM. Multiparameter Flow Cytometric Analysis of Antibiotic Effects on Membrane Potential, Membrane Permeability, and Bacterial Counts of Staphylococcus aureus and Micrococcus luteus. Antimicrob Agents Chemother. 2000;44:827–834. doi: 10.1128/aac.44.4.827-834.2000. [DOI] [PMC free article] [PubMed] [Google Scholar]
- 96.Gauthier C, St-pierre Y, Villemur R. Rapid antimicrobial susceptibility testing of urinary tract isolates and samples by flow cytometry. Journal of Medical Microbiology. 2002;51:192–200. doi: 10.1099/0022-1317-51-3-192. [DOI] [PubMed] [Google Scholar]
- 97.Collander R. The Permeability of Nitella Cells to Non-Eleetrolytes. Physiol Plant. 1954;7:420–445. [Google Scholar]
- 98.Bartz QR. Isolation and Characterization of Chloromycetin. J Biol Chem. 1948;172:445–450. [PubMed] [Google Scholar]
- 99.Stein W. The movement of molecules across cell membranes. Academic Press, Inc; New York: 1967. [Google Scholar]
- 100.Pramer D. Absorption of antibiotics by plant cells IV. Chloramphenicol. Exp Cell Res. 1959;16:70–74. doi: 10.1016/0014-4827(59)90196-x. [DOI] [PubMed] [Google Scholar]
- 101.Nikaido H. Molecular basis of bacterial outer membrane permeability revisited. Microbiol Mol Biol Rev. 2003;67 doi: 10.1128/MMBR.67.4.593. [DOI] [PMC free article] [PubMed] [Google Scholar]
- 102.Nikaido H, Rosenberg E, Foulds J. Porin channels in Escherichia coli: studies with beta-lactams in intact cells. J Bacteriol. 1983;153:232. doi: 10.1128/jb.153.1.232-240.1983. [DOI] [PMC free article] [PubMed] [Google Scholar]
- 103.Yoshimura F, Nikaido H. Diffusion of beta-lactam antibiotics through the porin channels of Escherichia coli K-12. Antimicrob Agents Chemother. 1985;27:84–92. doi: 10.1128/aac.27.1.84. [DOI] [PMC free article] [PubMed] [Google Scholar]
- 104.Wu C, Clift P, Fry CH, Henry JA. Membrane action of chloramphenicol measured by protozoan motility inhibition. Arch Environ Contam Toxicol. 1996:850–853. doi: 10.1007/s002040050349. [DOI] [PubMed] [Google Scholar]
- 105.Griffiths AJ, Miller JH, Suzuki DT, Lewontin RC, Gelbart WM. An Introduction to Genetic Analysis. W. H. Freeman; New York: 2000. [Google Scholar]
- 106.Rolinson GN, Macdonald Ca, Wilson Da. Bactericidal action of beta-lactam antibiotics on Escherichia coli with particular reference to ampicillin and amoxycillin. J Antimicrob Chemother. 1977;3:541–53. doi: 10.1093/jac/3.6.541. [DOI] [PubMed] [Google Scholar]
- 107.Shah D, et al. Persisters: a distinct physiological state of E. coli. BMC Microbiology. 2006;6:53. doi: 10.1186/1471-2180-6-53. [DOI] [PMC free article] [PubMed] [Google Scholar]
- 108.Luidalepp H, Jõers A, Kaldalu N, Tenson T. Age of inoculum strongly influences persister frequency and can mask effects of mutations implicated in altered persistence. J Bacteriol. 2011;193:3598–605. doi: 10.1128/JB.00085-11. [DOI] [PMC free article] [PubMed] [Google Scholar]
- 109.Paul BJ, Ross W, Gaal T, Gourse RL. rRNA transcription in Escherichia coli. Annu Rev Genet. 2004;38:749–70. doi: 10.1146/annurev.genet.38.072902.091347. [DOI] [PubMed] [Google Scholar]
- 110.Schaechter M, Maaløe O, Kjeldgaard NO. Dependency on medium and temperature of cell size and chemical composition during balanced growth of Salmonella typhimurium. Journal of General Microbiology. 1958;19:592–606. doi: 10.1099/00221287-19-3-592. [DOI] [PubMed] [Google Scholar]
- 111.Chopra I, Hacker K, Misulovin Z, Rothstein DM. Sensitive Biological Detection Method for Tetracyclines Using a tetA-lacZ Fusion System. Antimicrob Agents Chemother. 1990;34:111–116. doi: 10.1128/aac.34.1.111. [DOI] [PMC free article] [PubMed] [Google Scholar]
- 112.Bipatnath M, Dennis PP, Bremer H. Initiation and velocity of chromosome replication in Escherichia coli B/r and K-12. J Bacteriol. 1998;180:265–73. doi: 10.1128/jb.180.2.265-273.1998. [DOI] [PMC free article] [PubMed] [Google Scholar]
- 113.Churchward G, Estiva E, Bremer H. Growth rate-dependent control of chromosome replication initiation in Escherichia coli. J Bacteriol. 1981;145:1232–8. doi: 10.1128/jb.145.3.1232-1238.1981. [DOI] [PMC free article] [PubMed] [Google Scholar]
- 114.Begg K, Donachie W. Changes in cell size and shape in thymine-requiring Escherichia coli associated with growth in low concentrations of thymine. J Bacteriol. 1978;133:452–8. doi: 10.1128/jb.133.2.452-458.1978. [DOI] [PMC free article] [PubMed] [Google Scholar]
- 115.Bremer H, Dennis PP. Escherichia coli and Salmonella typhimurium: cellular and molecular biology. American Society for Microbiology; Washington, DC: 1987. pp. 1527–1542. [Google Scholar]
- 116.Cayley S, Lewis BA, Guttman HJ, Record MT. Characterization of the cytoplasm of Escherichia coli K-12 as a function of external osmolarity. Implications for protein-DNA interactions in vivo. J Mol Biol. 1991;222:281–300. doi: 10.1016/0022-2836(91)90212-o. [DOI] [PubMed] [Google Scholar]
- 117.Stock J, Rauch B, Roseman S. Periplasmic space in Salmonella typhimurium and Escherichia coli. J Biol Chem. 1977;252:7850–7861. [PubMed] [Google Scholar]
- 118.Buck M, Cooperman B. Single protein omission reconstitution studies of tetracycline binding to the 30S subunit of Escherichia coli ribosomes. Biochemistry. 1990;29:5374–5379. doi: 10.1021/bi00474a024. [DOI] [PubMed] [Google Scholar]
- 119.Olson MW, et al. Functional, Biophysical, and Structural Bases for Antibacterial Activity of Tigecycline. Antimicrob Agents Chemother. 2006 doi: 10.1128/AAC.01499-05. [DOI] [PMC free article] [PubMed] [Google Scholar]
- 120.Bergeron J, et al. Glycylcyclines bind to the high-affinity tetracycline ribosomal binding site and evade Tet(M)- and Tet(O)-mediated ribosomal protection. Antimicrob Agents Chemother. 1996;40:2226–2228. doi: 10.1128/aac.40.9.2226. [DOI] [PMC free article] [PubMed] [Google Scholar]
- 121.Nelson ML, et al. Inhibition of the tetracycline efflux antiport protein by 13-thio-substituted 5-hydroxy-6-deoxytetracyclines. J Med Chem. 1993;36:370–377. doi: 10.1021/jm00055a008. [DOI] [PubMed] [Google Scholar]
Associated Data
This section collects any data citations, data availability statements, or supplementary materials included in this article.