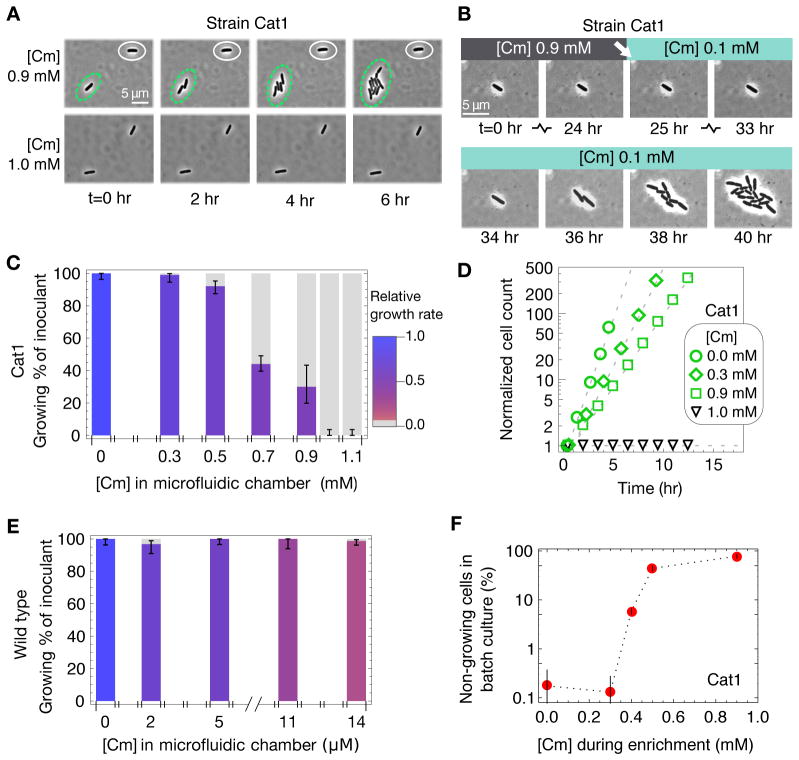
Figure 2. Drug-induced growth bistability.
(A) Upon increasing Cm concentration from 0 to 0.9 mM in microfluidic chambers (fig. S4), genetically identical Cat1m cells growing exponentially in glucose minimal medium either continued growing (circled in green) or were growth-arrested (circled in white); see Movie S1. None of the Cat1m cells grew after adding Cm to 1.0 mM. (B) A typical example of the cells that remained dormant throughout the 24 hours during which microfluidic chambers contained 0.9 mM Cm; growth resumed ~8 hours after Cm was reduced to 0.1 mM, which is still well above the MIC of wild type cells (see Movie S2). (C) Height of colored bars gives the percentage of Cat1m cells to continue exponential growth in microfluidic chambers upon adding indicated concentration of Cm; error bars give 95% CI assuming a binomial distribution. Bar color indicates growth rates of growing cells, with the relative growth rate given by the scale bar on the right. (D) Growth curves at different Cm concentrations, given by the size of growing colonies (y-axis) in the microfluidic device. The deduced growth rates dropped abruptly from 0.35 hr−1 (green squares) at 0.9 mM Cm to zero at 1.0 mM Cm (black triangles). (E) As in panel C, but for immotile wild type cells (EQ4m) that showed no significant correlation between growth rate and fraction of growing cells (ρs~0.1). (F) Fraction of Cat1 cells remaining after the batch culture Amp-Cm enrichment assay (fig. S5). The results (fig. S7) reveal significant fractions of non-growing cells well above the basal level of natural persisters (~10−3), for [Cm] ≥ 0.4 mM until the MIC of 1.0 mM above which no cells grew. Error bars estimate SD of CFU, assuming Poisson-distributed colony appearance.

