

Supplemental digital content is available in the text.
Key Words: HABITUAL PHYSICAL ACTIVITY, OBJECTIVE ASSESSMENT, ACCELEROMETRY, MONITORING, CHILDREN, ADOLESCENTS
ABSTRACT
Purpose
Awareness of being monitored can influence participants’ habitual physical activity (PA) behavior. This reactivity effect may threaten the validity of PA assessment. Reports on reactivity when measuring the PA of children and adolescents have been inconsistent. The aim of this study was to investigate whether PA outcomes measured by accelerometer devices differ from measurement day to measurement day and whether the day of the week and the day on which measurement started influence these differences.
Methods
Accelerometer data (counts per minute [cpm]) of children and adolescents (n = 2081) pooled from eight studies in Switzerland with at least 10 h of daily valid recording were investigated for effects of measurement day, day of the week, and start day using mixed linear regression.
Results
The first measurement day was the most active day. Counts per minute were significantly higher than on the second to the sixth day, but not on the seventh day. Differences in the age-adjusted means between the first and consecutive days ranged from 23 to 45 cpm (3.6%–7.1%). In preschoolchildren, the differences almost reached 10%. The start day significantly influenced PA outcome measures.
Conclusions
Reactivity to accelerometer measurement of PA is likely to be present to an extent of approximately 5% on the first day and may introduce a relevant bias to accelerometer-based studies. In preschoolchildren, the effects are larger than those in elementary and secondary schoolchildren. As the day of the week and the start day significantly influence PA estimates, researchers should plan for at least one familiarization day in school-age children and randomly assign start days.
The objective assessment of physical activity (PA) in children and adolescents has become a key issue in monitoring or evaluating the effectiveness of PA promotion programs. Pedometry and accelerometry are thought to provide more valid information about true PA behavior in children and adolescents than self-report measures (9,10). Although these techniques are widely used, a full understanding of factors that influence the internal validity of objective PA assessment has not yet been reached. One specific concern regarding the internal validity of objectively measured habitual PA is the change in behavior due to the awareness of the study participant that he or she is being monitored, known as the Hawthorne effect (39). In the PA and exercise science literature, the possible effect of altering PA as a result of wearing a measurement device is called reactivity (16,27,37). The effect may be more pronounced in children and adolescents given that young people are inherently competitive and curious (22) and that they may alter their PA level due to intentions to compete or to behave as expected.
Reactivity is recognized as a matter of concern (16,22,35) and has been addressed by several studies. In studies investigating the effect of wearing a PA monitoring device on children’s and adolescents’ PA, only pedometer devices have been used. However, their results have been inconsistent. Some authors concluded that the day-to-day variability of PA, as an indicator of possible reactivity, does not seem to be a matter of concern (25,30,37,38). Others found elevated step counts on the first day of measurement (21), a decline in PA over 4 d (15), or an elevation of the steps per day in the first measurement week compared with the third measurement week (20). Foley et al. (11) found that children had significantly more PA in a known monitoring condition where pedometers were distributed. Reactivity to accelerometer devices in young adults was addressed by Behrens and Dinger (2), who found no reactivity, and in adults with multiple sclerosis by Motl et al. (24), who found a significant reduction of PA for a 1-wk period. This reduction may have represented reactivity, but such data for children are lacking. No studies with children and adolescents examining reactivity to accelerometer devices appear to have been published so far.
Most studies have tested reactivity as a result of providing feedback to the wearer of measuring devices (11), but reactivity may also occur due to elevated motivation to be physically active, a reaction to attention given by researchers, or excitement about having received a measurement device (14). The size and duration of the effect, that is, higher accelerometer output over parts of the wear time, is unclear. Suggestions for familiarization periods to pedometer devices ranged from 1 d to 1 wk (7,8,21,32), but the issue has not yet been discussed in accelerometer studies.
The present analysis aimed to investigate reactivity, that is, altered PA outcomes measured by accelerometry from day to day over the measurement period, in a large sample of pooled data of Swiss children and adolescents. The purpose of this study was to contribute to the validity of accelerometer-based data by providing information on a possible reaction of children and adolescents to the fact that their PA was monitored or simply that they were equipped with a measurement device. The research question was whether and how PA outcomes measured by accelerometry differ from day to day over the measurement period and whether factors such as the day of the week or the start day influence these differences.
METHODS
Study population
Data from study participants (Table 1) were pooled from eight studies in Switzerland, namely, the KISS (19), the Ballabeina (26), the SCARPOL (4), the Gabriel (3), the EFRAIM (12), the Swiss part of ENERGY (40), the Bernstudy/IKAÖ (18), and the J+S 5-10 evaluation study (13). All studies measured PA for 7 d. Data from children with at least 10 h of daily recording time on two weekdays and one weekend day were included in the analyses. All children and their parents gave their informed assent or consent. All eight studies were approved by the respective regional ethic committees.
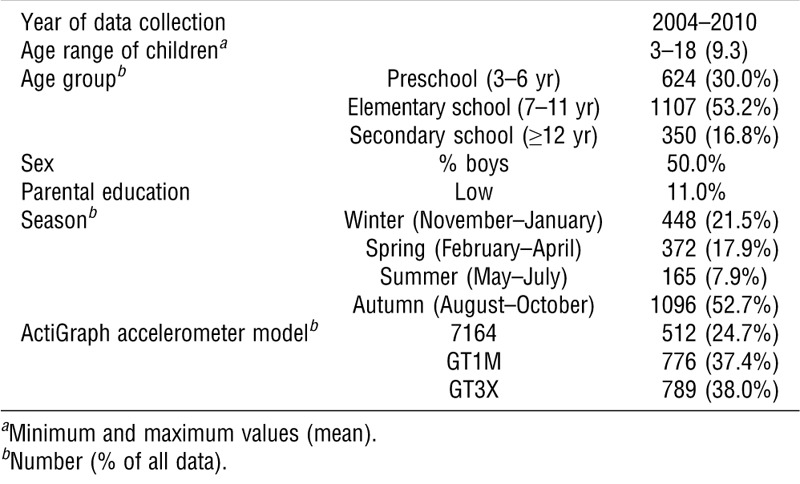
TABLE 1.
Characteristics of the study population (n = 2081).
Data collection and processing
PA outcome measures were collected using ActiGraph Accelerometer Models 7164, GT1M, and GT3X (ActiGraph, LLC, Pensacola, FL) (Table 1). In all studies, the accelerometers were distributed the day before they were set to begin collecting data. The study participants were instructed to start wearing the device in the morning of the next day, immediately after getting dressed. As the original studies used different epoch periods, the raw data were reintegrated to 60-s epoch periods using ActiLife Lifestyle Monitoring System Software Version 5 (ActiGraph, LLC). Periods of more than 20 min of consecutive zero counts were defined as nonwearing time. The data were reduced using the MeterPlus Version 4.3 software from Santech, Inc. (San Diego, CA). Sociodemographic factors were assessed using questionnaires in each study.
Variables investigated
The dependent variable, counts per minute (cpm) each day, reflected the total counts per day divided by the total number of minutes of accelerometer wear time per day. Independent variables available in all substudies with a potential influence on the dependent variable were the measurement day, which reflected the day number (first to seventh) of the measurement week; the day of the week, which was the weekday (Monday–Sunday) when the respective data were collected; and start day, describing the weekday (Monday–Sunday) on which data collection started. The age variable was centered around its mean to compare effects in relation to the mean age. Parental education was categorized as low versus high, where high education required at least one parent with longer (at least year 12, college or higher) education. The season variable specified when the data were collected during the year (winter: November–January; spring: February–April; summer: May–July; and autumn: August–October). The device variable specified the ActiGraph model that was used to collect the data.
Statistical analysis
Effects on counts per minute were investigated for the aforementioned independent variables using mixed linear regression in the main model. In addition, three models using age to stratify the data were computed. All the models were adjusted for mean age (including quadratic and cubic terms), sex, parental education, and season of data collection. As the comparison showed that model 7164 produced somewhat different PA estimates than the newer models, GT1M and GT3X (28), although the latter two models were comparable in the first axis output (17), the ActiGraph device type was introduced as an independent random effect in all models, along with the substudy and the child. The inclusion of the different factors was tested by likelihood ratio tests where 95% of all bootstrapped P values should have been less than 0.05 for a significant contribution of the variable to the model. Missing data points were omitted. As the dependent variable was positively skewed and the residuals of the model were not normally distributed, the model parameters were estimated using bootstrap cluster resampling with 1000 repetitions. Bias-corrected bootstrap 95% confidence intervals (CI) and bias to the nonbootstrapped coefficients were computed. Interactions of measurement day with the sex, age, parental education, and start day variables, respectively, were also introduced in the main model.
The independent variables were also investigated after the data were stratified for three age groups, that is, preschool (3–6 yr), elementary school (7–11 yr), and secondary school (≥ 12 yr) (33). All models for the age strata were adjusted for the sex and parental education variables. However, quadratic and cubic age were not significant and therefore excluded from the models. The data are shown as means ± SD, unless stated otherwise. The analyses were performed using the R software (R Project for Statistical Computing, Version 2.15.3, Bell Laboratories, Murray Hill, NJ). The R package “lme4” (1) was used for linear mixed-effect models, and “boot” (6) was used for bootstrapping. The significance level was set at P < 0.05.
RESULTS
A total of 2081 children were included in the analysis. An average of 588 ± 173 cpm·d−1 (95% CI = 314–989 cpm) was recorded over the measurement period. Adherence to wearing the device dropped with the duration of the study. All children wore their device on the first measurement day, whereas 1115 children (54%) wore their device on the seventh measurement day (Fig. 1). The days of the week measured were evenly represented in the measurements. Most children started the measurements on Wednesday or Thursday (both 21%), whereas only a few children started their measurements on Monday (5%) or Sunday (9%).
FIGURE 1.
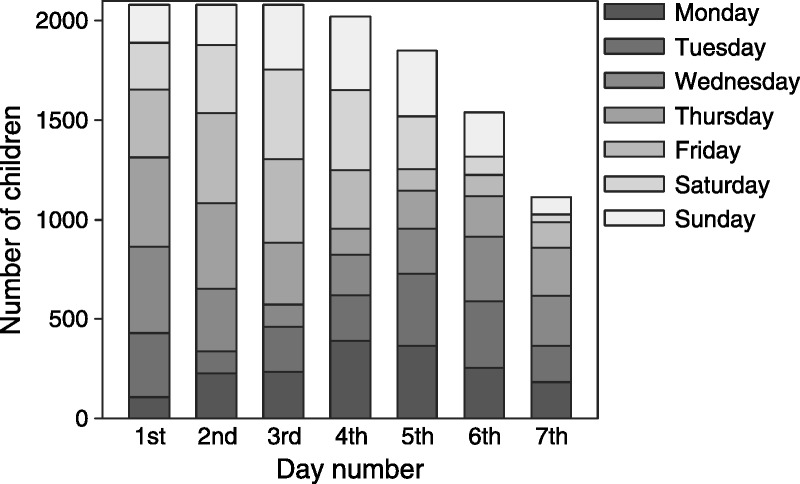
Number of children measured according to the measurement day (first to seventh day) and the day of the week (Monday to Sunday).
Main model
The measurement day was significantly related to accelerometer measured PA (P < 0.05) in the main model (Fig. 2; see also Table S1, Supplemental Digital Content 1 http://links.lww.com/MSS/A390, which shows bootstrap estimates with standard errors of coefficient as numbers). The first measurement day was the most active day, and counts per minute were significantly higher than on the second to the sixth day, but not on the seventh day. Differences in the age-adjusted means between the first and consecutive days ranged from 23 to 45 cpm (3.6%–7.1%). The day of the week was significantly related to PA (P < 0.001), with counts per minute on Saturday, Sunday, and Monday being significantly lower than on Tuesday through Friday. The start day was significantly related to PA (P < 0.05), with a difference of 39.3 cpm (6.3%), depending on whether the measurements started on a Wednesday (highest PA estimates) or on a Saturday (lowest PA estimates).
FIGURE 2.
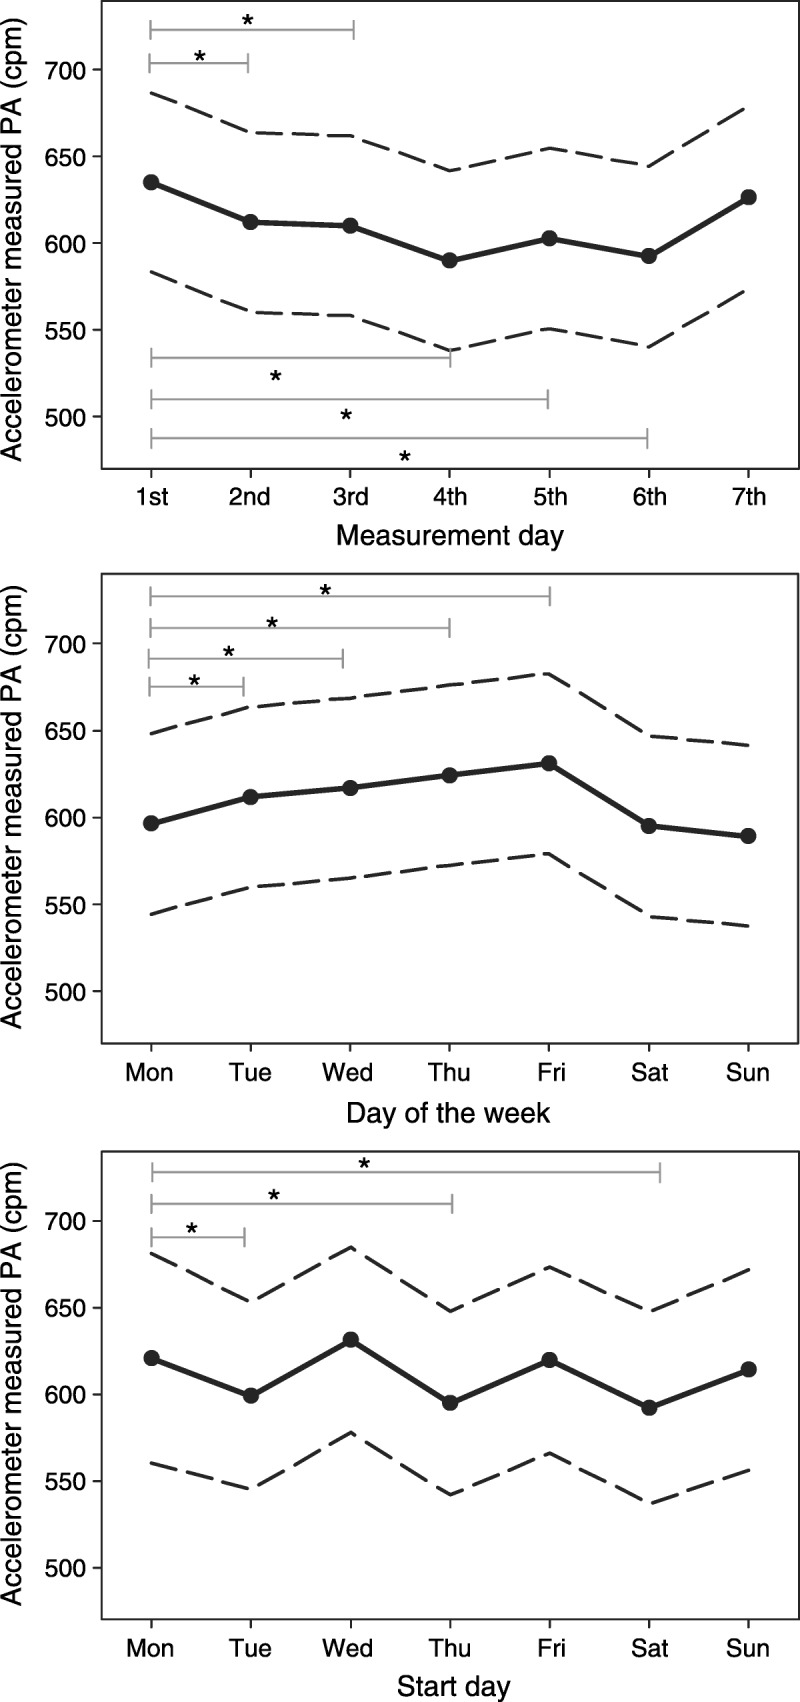
Bootstrap estimates of the association between accelerometer measured PA (cpm) and the measurement day, day of the week, and start day. Data are presented as means (black line/scatter dots) and 95% CI (dashed line) and are adjusted for age, quadratic and cubic age, sex, parental education, ActiGraph device type, and season. *Significant differences (P < 0.05).
Stratified models
The stratified models revealed some age-specific differences. In preschoolchildren (ages 3–6 yr), the third and the fourth measurement days were lower in PA compared with the first 2 d; however, the first and the second measurement days were not significantly different (Fig. 3). In elementary school and secondary schoolchildren (ages 7–11 yr and ≥ 12 yr), counts per minute on the first measurement day was significantly higher than counts per minute on the second, fourth, fifth, and sixth measurement days. However, the third measurement day was not significantly different from the first day. The interaction of the mean age and measurement day variables was significant in the main model (P < 0.05), indicating different development of values across age. The relative adjusted mean differences of counts per minute between the first and the fourth measurement days were 9.9% in the youngest age group. The differences were smaller in elementary schoolchildren and in children ages 12 yr and older, with 4.9% and 6.5%, respectively. The variable day of the week significantly influenced counts per minute (P < 0.05) in the elementary school and secondary schoolchildren.
FIGURE 3.
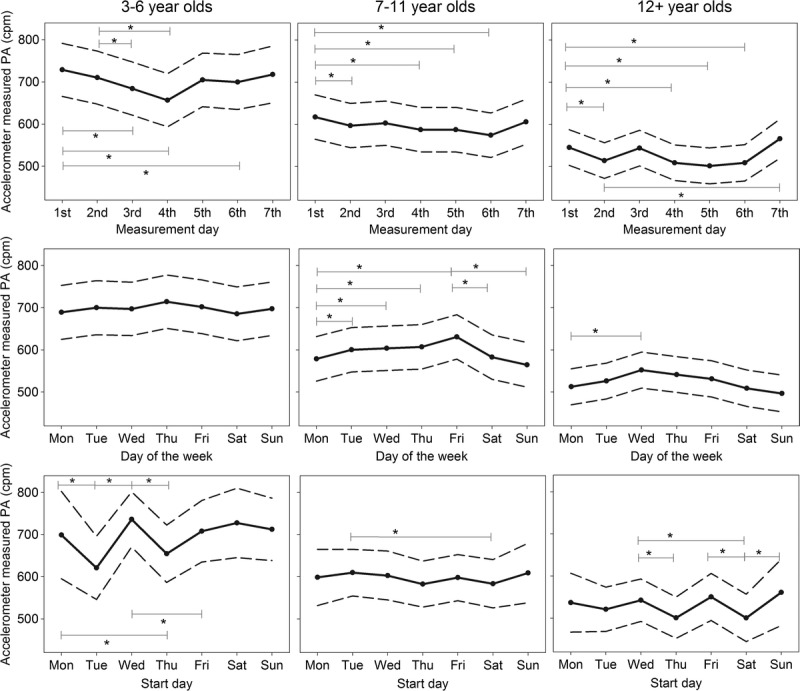
Means (black line/scatter dots) and 95% CI (dashed line) of the effect of measurement day, day of the week, and start day on PA in preschoolchildren (ages 3–6 yr, n = 624), elementary schoolchildren (ages 7–11 yr, n = 1107), and secondary schoolchildren (ages 12 yr and older, n = 350), adjusted for age, quadratic and cubic age, sex, parental education, ActiGraph device type, and season. *Significant differences (P < 0.05).
Friday and Wednesday were the most active days in the middle and the oldest age group, respectively. Monday and the weekend days were the least active days in the two older age groups. The variable start day significantly influenced PA measure levels in all age groups (P < 0.05). If measurements started on Wednesday, counts per minute were higher than if measurements started on Thursday in all age groups. In preschoolchildren, starting the measurement period on Tuesday or Thursday resulted in lower PA measures (P < 0.05) than starting on almost all other days of the week. In elementary schoolchildren, the differences were small, but starting measurements on Saturday resulted in the lowest outcomes of counts per minute, a pattern that could also be observed in secondary schoolchildren.
DISCUSSION
To the authors’ knowledge, the present study is the first that has investigated a possible reactivity effect in accelerometer studies with children and adolescents to such an extent. Mixed linear regression analysis revealed that reactivity to accelerometer measurement is likely to be present, as the first measurement day was the most active day and PA during the remaining days was 3%–7% lower. In preschoolchildren, the effects were bigger than those in elementary school and secondary schoolchildren. The day of the week and the start day significantly influenced PA estimates.
In an adult “sealed” pedometer study, reactivity occurred during the first 3 d, when the participants knew that their steps were recorded, compared with the “covert” condition, when the same participants were told that the device simply measured posture (7,8). Adolescents displayed a stepwise drop of PA for a 4-d measurement period (15), whereas 10-yr-old children demonstrated significantly higher step counts on the first day compared with the remaining days (21). In agreement with our study, these data suggest that reactivity effect size depends on the age of the participants. In the present study, the patterns of the youngest age-group were somewhat different than those of school-age children and adolescents. PA estimates remained at a high level longer before decreasing more dramatically only after the second day in preschoolchildren, indicating that their enthusiasm for the device faded from day 3 onward, whereas older children’s PA declined within 1 d.
The extent of reactivity seems to be larger in younger children than that in older children and adolescents as well. In the youngest age group, a decrease of almost 10% of counts per minute from the first to the fourth measurement days was observed, whereas the reduction was only 4%–6% in the two older age groups. The return of PA estimates on the seventh measurement day to the initial level of the first day might be due to the children’s and adolescents’ awareness that it was the last measurement day, resulting in a compensating behavior aiming to improve their results. The strata model revealed that the elevation of PA on the last measurement day was more pronounced in the age-group 12 yr and older.
The findings mentioned could reflect somewhat U-shaped reactivity, with more pronounced reactivity in young children and in older adolescents and adults. In young children, the effect might be due to the curiosity of children regarding the measurement device and the fact that they accumulate high count values predominantly during unstructured play (4). Moreover, young children have few structured time frames, such as school time or sport club training sessions, during which reactivity would not be possible to a great extend. In older adolescents and adults, the more pronounced reactivity may reflect the developing social desirability with age (31).
The present data allowed further testing of the influences of the day of the week and of the start day of measurements on PA patterns. The results from the main model revealed that Sunday was the most inactive day, together with Saturday and Monday. The finding about inactive weekends is in line with many reports in the literature (2,8,34). However, lower levels of PA on Mondays have not been reported in other studies. Friday was the most active day, with approximately 40 cpm more compared with Sunday. This effect was mainly due to children in the 7- to 11-yr age group, in which children were most active on Wednesday, Thursday, and mostly Friday. Often in Swiss primary schools, Wednesday and Friday are afternoons when one does not have to go to school, which allows the children to be physically active in sport clubs or at home with friends. The generalizability of this finding is limited and has to be interpreted with caution as it might be population-specific.
The present data on the influence of the start day offer some new information. If accelerometer measurements started on a Wednesday, the highest levels of PA estimates were produced, indicating that the school-free Wednesday was used to produce high initial counts. In the youngest age group, greater differences could be observed than those in primary schoolchildren and in the adolescent age group (12 yr and older), where starting measurements on Saturday resulted in the lowest PA estimates. Possible explanations for these findings could be the competitive nature of adolescents. If the start day was a Saturday, then school-age children (7 yr and older) might not compete with their classmates about having more PA on the first two measurement days, thus showing less reactivity and less counts per minute over the measurement week. Further research is needed to shed more light on the influences of the start day on PA estimates in children and adolescents.
The present study is not without its limitations. The substudies were not designed to test for reactivity but rather for either cross-sectional analysis or baseline measurement of habitual PA. To test for reactivity, a treatment condition versus real covert condition, where true habitual PA is measured, would be necessary. The strengths of this study include the large sample size of children and adolescents who wore accelerometers. On the basis of previous literature that suggested that different confounding factors are responsible for changes in PA, such as sex, age, socioeconomic background, season, or weekend laziness, we corrected the model for known and important confounders (2,4,5,29,36).
In conclusion, the present findings suggest that reactivity in children and adolescents is present to an extent of approximately 5% (range from 4% to 6%) on the first and last measurement days when a whole week is measured. As the goal in intervention studies and a clinical meaningful difference in PA is often 10% and effect sizes rarely exceed 11% (23), reactivity may introduce a relevant bias.
If habitual PA is measured by accelerometry, researchers should plan for at least one familiarization day in school-age children and possibly two familiarization days in preschoolers and collect data from at least 7 d. In addition, weekdays and weekend days should be included for school-age children, and the start days should be randomly assigned. The findings from the present study contribute to the discussion about accelerometer study design, data cleaning, and interpretation and have important implications for researchers interested in the use of accelerometers. Further research, designed to detect reactivity to accelerometer-measured habitual PA, is needed to confirm these results.
Acknowledgments
This work was partially supported by the Swiss Federal Commission of Sports.
This work was based on a data pooling project funded by the Swiss Federal Commission of Sports. The authors would like to acknowledge the data contribution of the following studies: Kinder- und Jugendsport-Studie KISS, Ballabeina, SCARPOL, Gabriel, EFRAIM, ENERGY, IKAÖ, and J+S 5-10 evaluation study.
The authors would like to thank Dr. Denis Infanger-Aydin and Dr. Christian Schindler for their helpful suggestions and support during the statistical analysis, Dr. Marco Waser for his coordination of the GABRIEL study, Dr. Lukas Zahner for the coordination of the KISS study, and Dr. Sondhja Bitter for her contribution to the EFRAIM study.
DA, JG, BC, MU, HJ, HH, PJJ, KS, and BB contributed to the data collection. KS and BB coordinated the modeling of the Swiss accelerometer data pool. RN conducted the statistical analyses. All authors provided critical feedback on the manuscript and approved the final version.
The authors declare no conflicts of interest. The results of the present study do not constitute endorsement by the American College of Sports Medicine.
Footnotes
Supplemental digital content is available for this article. Direct URL citations appear in the printed text and are provided in the HTML and PDF versions of this article on the journal’s Web site (www.acsm-msse.org).
REFERENCES
- 1.Bates D, Maechler M, Bolker B. lme4: linear mixed-effects models using S4 classes. R package version 0.999999-0; 2012.
- 2. Behrens T, Dinger M. Motion sensor reactivity in physically active young adults. Res Q Exerc Sport. 2007; 78 (2): 1– 8. [DOI] [PubMed] [Google Scholar]
- 3. Bringolf-Isler B, Graf E, Waser M, et al. Association of physical activity, asthma and allergies—a cohort of farming and non-farming children. J Allergy Clin Immunol. 2013; 132 (3): 743– 6.e4. [DOI] [PubMed] [Google Scholar]
- 4. Bringolf-Isler B, Grize L, Mäder U, Ruch N, Sennhauser F, Braun-Fahrländer C. Assessment of intensity, prevalence and duration of everyday activities in Swiss school children: a cross-sectional analysis of accelerometer and diary data. Int J Behav Nutr Phys Activ. 2009; 6 (1): 50. [DOI] [PMC free article] [PubMed] [Google Scholar]
- 5. Bringolf-Isler B, Grize L, Mäder U, Ruch N, Sennhauser F, Braun-Fahrländer C. Built environment, parents’ perception, and children’s vigorous outdoor play. Prev Med. 2010; 50 (5–6): 251– 6. [DOI] [PubMed] [Google Scholar]
- 6.Canty A, Ripley B. boot: Bootstrap R (S-Plus) Functions. R package version 1.3-7; 2012.
- 7. Clemes S, Deans N. The presence and duration of reactivity to pedometers in adults. Med Sci Sports Exerc. 2012; 44 (6): 1097– 101. [DOI] [PubMed] [Google Scholar]
- 8. Clemes S, Parker R. Increasing our understanding of reactivity to pedometers in adults. Med Sci Sports Exerc. 2009; 41 (3): 674– 80. [DOI] [PubMed] [Google Scholar]
- 9. Corder K, van Sluijs E, Wright A, Whincup P, Wareham N, Ekelund U. Is it possible to assess free-living physical activity and energy expenditure in young people by self-report? Am J Clin Nutr. 2009; 89 (3): 862– 70. [DOI] [PubMed] [Google Scholar]
- 10. De Vries S, Van Hirtum H, Bakker I, Hopman-Rock M, Hirasing R, Van Mechelen W. Validity and reproducibility of motion sensors in youth. Med Sci Sports Exerc. 2009; 41 (4): 818– 27. [DOI] [PubMed] [Google Scholar]
- 11. Foley J, Beets M, Cardinal B. Monitoring children’s physical activity with pedometers: reactivity revisited. J Exerc Sci Fit. 2011; 9 (2): 82– 6. [Google Scholar]
- 12. Gehring U, Spithoven J, Schmid S, et al. Endotoxin levels in cow’s milk samples from farming and non-farming families - the PASTURE study. Environ Int. 2008; 34 (8): 1132– 6. [DOI] [PubMed] [Google Scholar]
- 13. Hänggi J. Evaluation Pilotprojekt J+S 5–10 - Bericht zur Wirksamkeitsevaluation zuhanden von J+S [Evaluation of the Youth and Sport 5–10 pilot project—report on the effectiveness]. Magglingen: Swiss Federal Institute of Sport; 2009. [updated 2012 June 01, cited 2013 June 06]. Available from: http://www.jugendundsport.ch/internet/js/de/home/ueber_j_s/evaluation.html (Ger). [Google Scholar]
- 14. Heppner PP, Kivlighan D, Wampold B. Research Design in Counseling. Thomson Brooks/Cole; 2008. p. 331. [Google Scholar]
- 15. Ho V, Simmons R, Ridgway C, et al. Is wearing a pedometer associated with higher physical activity among adolescents? Prev Med. 2013; 56 (5): 273– 7. [DOI] [PMC free article] [PubMed] [Google Scholar]
- 16. Intille S, Lester J, Sallis J, Duncan G. New horizons in sensor development. Med Sci Sports Exerc. 2012; 44 (1 Suppl): S24– 31. [DOI] [PMC free article] [PubMed] [Google Scholar]
- 17. Jimmy G, Seiler R, Mäder U. Comparing the validity and output of the GT1M and GT3X accelerometer in 5- to 9-year-old children. Meas Phys Educ Exerc Sci. 2013; 17 (3): 236– 48. [Google Scholar]
- 18. Kaufmann R, Hofmann H, Haefeli U, Oetterli M, Steiner R, Albisser R. Der Verkehr aus Sicht der Kinder. Schulwege von Primarschulkindern in der Schweiz [Traffic and Children: Primary School Children’s Routes to School in Switzerland]. Bern: Bundesamt für Strassen; 2010. p. 51– 60. [Google Scholar]
- 19. Kriemler S, Zahner L, Schindler C, et al. Effect of school based physical activity programme (KISS) on fitness and adiposity in primary schoolchildren: cluster randomised controlled trial. BMJ. 2010; 340: c785. [DOI] [PMC free article] [PubMed] [Google Scholar]
- 20. Ling F, Masters R, McManus A. Rehearsal and pedometer reactivity in children. J Clin Psychol. 2011; 67 (3): 261– 6. [DOI] [PubMed] [Google Scholar]
- 21. Maloney K, Corbin CB, Le Masurier C. Physical activity measurement of children using pedometers: reactivity and monitoring frame (Abstract). Res Q Exerc Sport. 2004; 75 (1 Suppl): A– 41. [Google Scholar]
- 22. McClain J, Tudor-Locke C. Objective monitoring of physical activity in children: considerations for instrument selection. J Sci Med Sport. 2009; 12 (5): 526– 33. [DOI] [PubMed] [Google Scholar]
- 23. Metcalf B, Henley W, Wilkin T. Effectiveness of intervention on physical activity of children: systematic review and meta-analysis of controlled trials with objectively measured outcomes (EarlyBird 54). BMJ. 2012; 345. [DOI] [PubMed] [Google Scholar]
- 24. Motl R, McAuley E, Dlugonski D. Reactivity in baseline accelerometer data from a physical activity behavioral intervention. Health Psychol. 2012; 31 (2): 172– 5. [DOI] [PubMed] [Google Scholar]
- 25. Ozdoba R, Corbin C, Le Masurier G. Does reactivity exist in children when measuring activity levels with unsealed pedometers? Pediatr Exerc Sci. 2004; 16 (2): 158– 66. [Google Scholar]
- 26. Puder JJ, Marques-Vidal P, Schindler C, et al. Effect of multidimensional lifestyle intervention on fitness and adiposity in predominantly migrant preschool children (Ballabeina): cluster randomised controlled trial. BMJ. 2011; 343: d6195. [DOI] [PMC free article] [PubMed] [Google Scholar]
- 27. Puhl J, Greaves K, Hoyt M, Baranowski T. Children’s activity rating scale (CARS): description and calibration. Res Q Exerc Sport. 1990; 61 (1): 26– 36. [DOI] [PubMed] [Google Scholar]
- 28. Ried-Larsen M, Brønd JC, Brage S, et al. Mechanical and free living comparisons of four generations of the ActiGraph activity monitor. Int J Behav Nutr Phys Activ. 2012; 9: 113. [DOI] [PMC free article] [PubMed] [Google Scholar]
- 29. Rosenkranz R, Welk G, Hastmann T, Dzewaltowski D. Psychosocial and demographic correlates of objectively measured physical activity in structured and unstructured after-school recreation sessions. J Sci Med Sport. 2011; 14 (4): 306– 11. [DOI] [PubMed] [Google Scholar]
- 30. Rowe D, Mahar M, Raedeke T, Lore J. Measuring physical activity in children with pedometers: reliability, reactivity, and replacement of missing data. Pediatr Exerc Sci. 2004; 16 (4): 343– 54. [Google Scholar]
- 31. Soubelet A, Salthouse T. Influence of social desirability on age differences in self-reports of mood and personality. J Pers. 2011; 79 (4): 741– 62. [DOI] [PMC free article] [PubMed] [Google Scholar]
- 32. Southard D, Southard B. Promoting physical activity in children with MetaKenkoh. Clin Invest Med. 2006; 29 (5): 293– 7. [PubMed] [Google Scholar]
- 33. Swiss Conference of Cantonal Ministers of Education (EDK). The Swiss education system. Berne: General Secretariat of the EDK; 2012, c2008 [cited 2013 June 06]. 5 p. Available from: http://www.edudoc.ch/static/web/edk/port_edk_e.pdf. [Google Scholar]
- 34. Tudor-Locke C, Bassett D, Swartz A, et al. A preliminary study of one year of pedometer self-monitoring. Ann Behav Med. 2004; 28 (3): 158– 62. [DOI] [PubMed] [Google Scholar]
- 35. Tudor-Locke C, McClain J, Hart T, Sisson S, Washington T. Pedometry methods for assessing free-living youth. Res Q Exerc Sport. 2009; 80 (2): 175– 84. [DOI] [PubMed] [Google Scholar]
- 36. Van Der Horst K, Paw MC, Twisk J, Van Mechelen W. A brief review on correlates of physical activity and sedentariness in youth. Med Sci Sports Exerc. 2007; 39 (8): 1241– 50. [DOI] [PubMed] [Google Scholar]
- 37. Vincent SD, Pangrazi RP. Does reactivity exist in children when measuring activity levels with pedometers? Pediatr Exerc Sci. 2002; 14 (1): 56– 63. [Google Scholar]
- 38. Wickel E, Eisenmann J, Pangrazi R, et al. Do children take the same number of steps every day? Am J Hum Biol. 2007; 19 (4): 537– 43. [DOI] [PubMed] [Google Scholar]
- 39. Wickström G, Bendix T. The “Hawthorne effect”—what did the original Hawthorne studies actually show? Scand J Work Environ Health. 2000; 26 (4): 363– 7. [PubMed] [Google Scholar]
- 40. Yildirim M, Verloigne M, de Bourdeaudhuij I, et al. Study protocol of physical activity and sedentary behaviour measurement among schoolchildren by accelerometry—cross-sectional survey as part of the ENERGY-project. BMC Public Health. 2011; 11 (1): 182. [DOI] [PMC free article] [PubMed] [Google Scholar]