Abstract
Purpose
Evaluate B0 shim and motion navigated single voxel spectroscopy in children. Assess the repeatability of metabolite concentrations in three regions: medial frontal grey matter, peritrigonal white matter, and basal ganglia. Determine the extent of intra and inter acquisition movement in this population.
Materials and Methods
Linewidth and SNR were calculated to assess spectral quality of 186 spectra at 3 T. Repeatability was assessed on 31 repeat scans. Navigator images were used to assess localisation errors, while navigator motion and shim logs were used to demonstrate the efficacy of correction needed during the scans.
Results
Average linewidths ± standard deviations of N-acetyl aspartate are 3.8 ± 0.6 Hz, 4.4 ± 0.5 Hz, and 4.7 ± 0.8 Hz in each region, respectively. Scan-to-scan measurement variance in metabolite concentrations closely resembled the expected variance. 73% and 32% of children moved before and during the acquisition causing a voxel shift of more than 10% of the voxel volume, 1.5 mm. The predominant movement directions were sliding out of the coil and nodding (up-down rotation). First-order B0 corrections were significant (> 10 μT/m) in 18% of acquisitions.
Conclusion
Prospective motion and B0 correction provides high quality repeatable spectra. The study found that most children moved between acquisitions and a substantial number moved during acquisitions.
Keywords: Single voxel spectroscopy, motion correction, B0 correction, navigator
INTRODUCTION
Metabolite concentrations measured with single voxel spectroscopy (SVS) can be rendered incorrect if the subject moves between localisation and acquisition or during an acquisition (1). Such movement can go undetected and give rise to spectra acquired from the wrong anatomy; spectral artifacts such as frequency shifts and line shape distortions may additionally occur. As several minutes of signal averaging are required, SVS may not be feasible for restless or uncomfortable subjects and sedation would otherwise be required. In this article we assess the quality of 186 echo planar imaging (EPI) volume navigated (vNav) Point Resolved Spectroscopy (PRESS) scans acquired in 5-year-old children without sedation (2).
The aim of the present study was to assess the quality, accuracy and measurement variance of metabolite concentrations in spectroscopy data acquired in children in different brain regions. In addition, we wanted to assess the type and range of motion that children in this age range typically perform.
METHODS
SVS PRESS Sequence
vNav PRESS includes an interleaved EPI MR navigator (2). The navigator takes advantage of the T1 recovery time in the sequence without noticeably affecting the T1 relaxation and without adding to the total acquisition time. It uses EPI to acquire and co-register low-resolution three-dimensional (3D) images of the subject’s head, and in this manner track head motion. It acquires a second, interleaved, 3D EPI navigator with a different TE to track changes in B0 and correct these in real-time using first-order shim and frequency adjustment. Higher than first-order B0 corrections can be estimated but not applied due to platform hardware limitations. B0 tracking ensures that optimal spectral linewidths are maintained even when subjects move their heads. vNav PRESS updates the position of the PRESS voxel every repetition time (TR) to correct both its position and rotation; additionally B0 is updated using the most recent vNav acquired. A limitation of the navigator is that motion correction is applied relative to the start of each acquisition, which can lead to motion induced localisation errors due to motion between the localisation scan and the start of the PRESS acquisition. The assessment of this error is described below.
The vNav setup for the PRESS sequence was: image matrix 44 × 40, 20 slice partitions, field of view (FOV) 220 × 200 × 110 mm3, TE1/TE2 8/12.8 ms, TR 21 ms, readout bandwidth 3906 Hz/pixel. The total duration of the navigator was 1036 ms including all calculations and feedback to the PRESS sequence.
Population
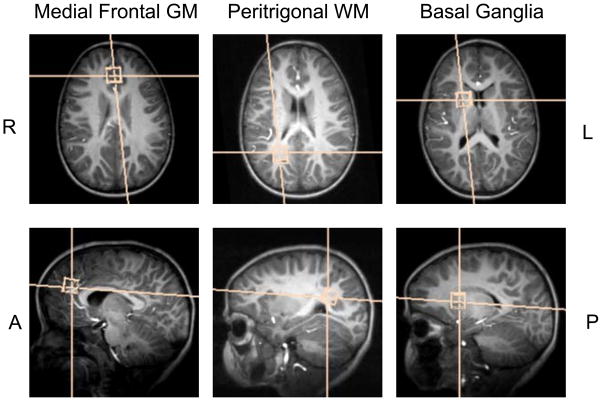
vNav PRESS data were acquired in three VOIs, namely medial frontal grey matter (mfgm), right peritrigonal white matter (ptwm), and right basal ganglia (bg) (Figure 1), in 58 children (27 males; mean age 5.4 ± 0.4 years) who have been followed since birth in two interlinked paediatric HIV studies (3,4). Repeat scans were performed in 12 children (4 male) on average 231 days after the first scan (range 139 – 324 days; mean age at repeat scan 5.8 ± 0.2 years) with the same localisation and protocol. The children comprised 9 uninfected control children and 49 HIV-infected children on early interrupted or deferred continuous antiretroviral therapy. All HIV-infected children were stable on ARV; in 92% of infected children viral load was suppressed. The subjects enrolled in the repeat comparison were clinically stable between the two scans and no change in metabolite concentrations was expected between the two time points (5).
Figure 1.
Three different volumes of interest: medial frontal grey matter, right peritrigonal white matter, and right basal ganglia.
Scan Setup and Subject Preparation
Pre-scan preparation included a mock scanner where children were exposed to the noises and feeling of being in a tunnel. This was followed by a tour of the Siemens Allegra 3T scanner, after which they were given the choice whether to continue with scanning or not. It was made clear that they could leave the scan at any stage should they wish and that a carer would be present in the scan room at all times. All scans were acquired according to protocols that had been approved by the Faculty of Health Sciences Human Research Ethics Committee at the University of Cape Town and the Faculty of Health Sciences Health Research Ethics Committee of Stellenbosch University. All parents/guardians provided written informed consent.
A birdcage transmit-receive head coil was used. The protocol consisted of a three plane localiser; a vNav set sequence for the vNav PRESS sequence (duration 1 s), which sets the navigator position and is later used as a snapshot of the head position at the start of the localisation scan; a motion corrected multi echo magnetisation prepared rapid gradient echo (vNav MEMPR) (6,7) for localisation; paired water reference and vNav PRESS acquisitions for each of the three VOIs, mfgm, ptwm, and bg. The PRESS sequence had TR/TE 2000/30 ms, readout bandwidth 1000 Hz/sample, 4 dummy measurements followed by 64 measurements taking 2 min 16 s. The voxel size was 15 × 15 × 15 mm3. Prior to commencing the PRESS acquisitions, the frequency, first-, and second-order shims were automatically adjusted using the system’s standard “Advanced” adjustment.
All scans were acquired and localised by expert radiographers and the absolute localisation error for each voxel was quantified using the vNav.
Spectroscopy Pre-processing and Analysis
Data pre-processing was performed to remove residual measurement-to-measurement frequency and phase variations. Frequency correction was achieved using a cross-correlation of the spectrum with a simulated spectrum (8). Phase coherent averaging was achieved using the most significant component of a singular value decomposition (8). The detected measurement-to-measurement frequency was recorded to assess the frequency stability of the navigator. Spectral analysis was performed in LCModel (9) where the water spectrum was used as a reference and to correct for eddy currents. All values are reported in institutional units (IU).
Spectral Quality Assessment
All scans that were completed and could be processed in LCModel were assessed. Linewidth was measured as the full width at half max of N-acetyl aspartate (NAA). SNR was assessed using the value reported by LCModel as S/N. Spectra were graded first according to SNR and then linewidth. The Cramér-Rao minimum variance bounds (CRB) reported by LCModel were assessed in each of the VOIs.
Repeatability
The metabolite concentrations from the repeated acquisitions were compared to those acquired previously in the same subjects. Metabolites where CRBs were less than 40 % in all scans were assessed in Bland and Altman plots to assess the mean and standard deviation of the difference.
The standard deviation of the difference (SDdiff) in metabolite concentration between the two time points was calculated across all VOIs and subjects for each metabolite. This was used to determine the standard deviation of each measurement (SDmeas); SDmeas is calculated as . Using the data from all 62 acquisitions (31 repeated scans), the root mean square of the CRB, in IU, was calculated and is denoted by RMS CRB. We hypothesise the measured standard deviation (SDmeas) should not be significantly greater than the fitting variance reported by the CRB if no additional (systematic) variance has been introduced beyond the fitting procedure.
Assessment of Subject Movement
Both inter- and intra acquisition movement of each subject was assessed. The inter acquisition movement is that between the localising structural scan (vNav MEMPR) and the start of our spectroscopic acquisition (vNav PRESS) and results in a localisation error. The vNav set sequence, which was run immediately prior to the vNav MEMPR, serves as a record of the head location at the start of this scan and has the same contrast and resolution as the vNav acquisitions during the PRESS sequence.
The vNav set sequence and the first vNav acquired during PRESS were coregistered to determine the localisation error. Prior to registration the B0 distortion inherent in both images was unwarped using the field maps generated by each. Unwarping was required as the images were acquired with different B0 shim settings. The unwarping procedure used a linear interpolation in the phase encoding direction proportional to the voxel frequency. SPM 8 (10) was used in Matlab (Mathworks, Natick MA USA) for the coregistration. From the registration, the absolute translation of the spectroscopy voxel relative to that chosen using the MEMPR was calculated.
Intra acquisition subject movement was assessed using the motion recorded by the vNav and accumulated to reflect the motion from the acquisition start to any point in the acquisition. This motion information is contained in the navigator imaging coordinates and provides information on the type of motion the subject performed. To assess the effect of the movement on the SVS voxel, the recorded motion was transformed to a coordinate system centred on the SVS voxel. Finally the navigator logs were assessed with respect to the subject’s orientation, namely Left-Right (L-R), Anterior-Posterior (A-P), Head-Foot (H-F). To assess which directions were more prone to movement, the number of subjects who moved more than 1 mm or rotated more than 2° in any direction was counted.
The stability of the navigator frequency was assessed using the results of the frequency correction performed during pre-processing. The effect of the B0 shim gradients was assessed by calculating the applied first-order shims relative to the shim offsets at the start of the acquisitions. To simplify the interpretation of three orthogonal shim gradients, the Euclidean norm of the gradients was calculated. For each acquisition an average Euclidean norm shim gradient was calculated, which demonstrates the cumulative effect on linewidth if shim correction has not been performed.
Statistical Analysis
Continuous variables are reported as mean ± standard deviation (SD). F-tests were calculated as the ratio of two variances; a look up table was used to determine the critical value of the F distribution for a significance level of p < 0.05. Pearson correlation was used to examine associations between two variables.
RESULTS
Exclusion Criteria or Incomplete Scans
Of 70 scans attempted, mfgm SVS was acquired in 68, and ptwm and bg each in 64. A total of four acquisitions were not completed, possibly because head movement exceeded the limits of acceptable motion within one TR (8° rotation or 20 mm translation). Six acquisitions (all from two subjects on the same day) failed to load into LCModel. Data pre-processing failed in one acquisition, which was included without data pre-processing. Results are reported for a total of 186 acquisitions, of which 31 are repeat acquisitions.
Spectral Quality
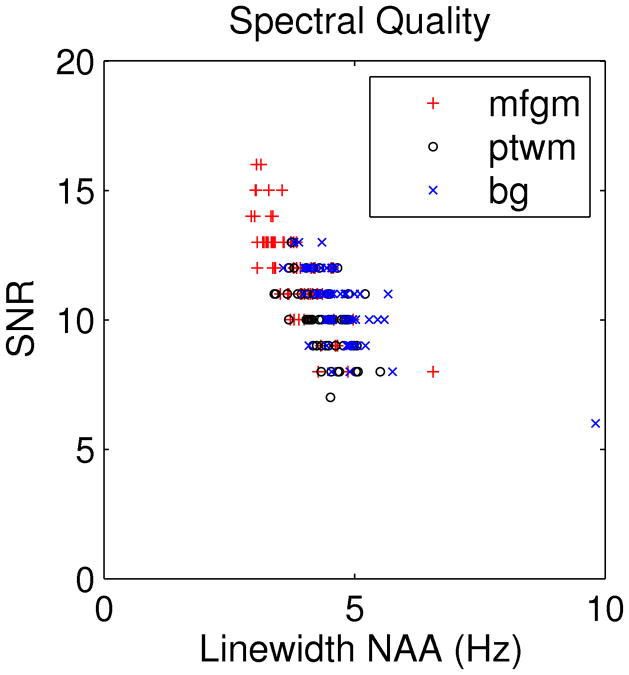
The mean linewidths of NAA are 3.8 ± 0.6 Hz, 4.4 ± 0.5 Hz, and 4.7 ± 0.8 Hz for the mfgm, ptwm and bg VOIs, respectively. Mean SNRs are 11.9 ± 1.9, 10.1 ± 1.4 and 10.4 ± 1.4 for the mfgm, ptwm and bg, respectively. Figure 2 plots linewidth against SNR and shows that poorer SNR is associated with increased linewidth. The Pearson correlation coefficient between linewidth and SNR is −0.7.
Figure 2.
Spectral quality plot showing the association of poorer SNR with increased linewidth. mfgm: medial frontal grey matter, ptwm: peritrigonal white matter, bg: basal ganglia. Note the bg outlier at 9.8 Hz corresponds to a voxel reported in Figure 7 that overlapped the ventricle.
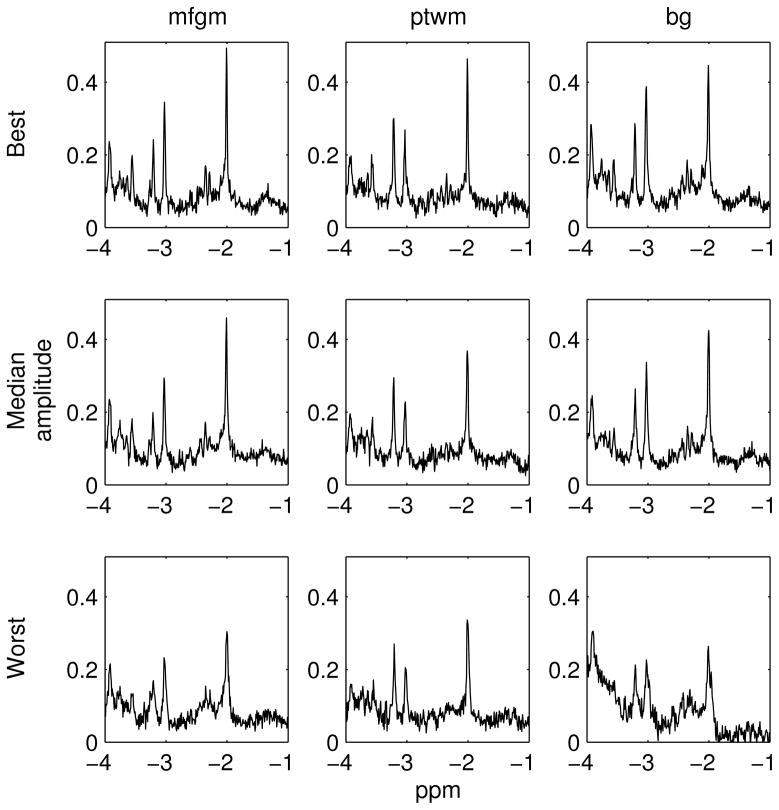
The spectra were graded first according to SNR and then linewidth. Figure 3 shows the best, median, and worst spectra acquired in each VOI. The worst spectrum was acquired in the basal ganglia and corresponds to the broad linewidth and low SNR outlier in Figure 2.
Figure 3.
The best, median, and worst spectra acquired in each VOI. The spectra shown were phase corrected by LCModel after offline data pre-processing. For the worst spectrum in the bg, the subject moved before the scan causing the voxel to partly overlap the ventricle.
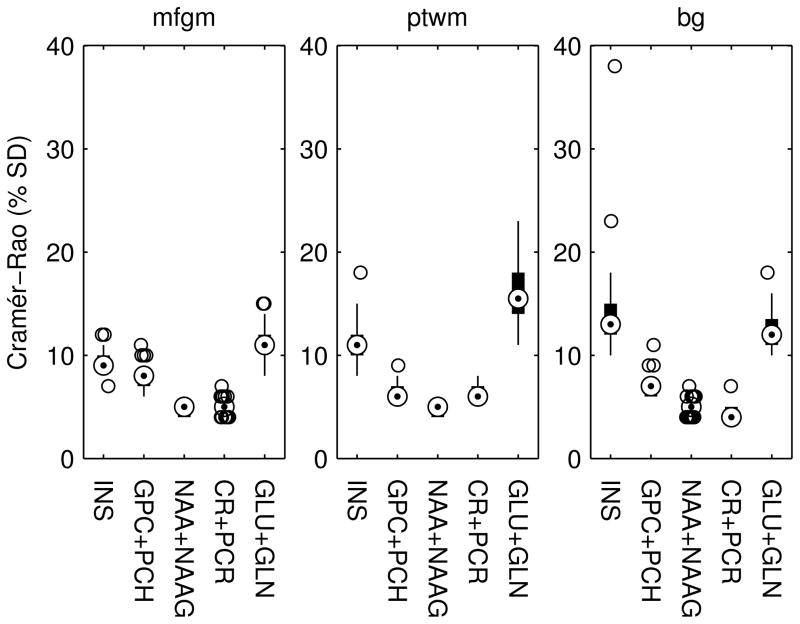
The CRBs for glutamate (GLU), NAA, myo-inositol (INS), glycerophosphocholine and phosphocholine combined (GPC+PCH), N-acetyl aspartate and N-acetyl aspartyl glutamate combined (NAA+NAAG), creatine and phosphocreatine combined (CR+PCR), and the sum of glutamate and glutamine (GLU+GLN) were below 25% for all scans, except for one bg spectrum for which the CRB for INS was 38%. This spectrum corresponds to the VOI reported in Figure 2 and Figure 3 as the worst spectrum and as demonstrated below partially overlapped the ventricle. Figure 4 shows box and whiskers plots of the CRBs for INS, GPC+PCH, NAA+NAAG, CR+PCR and GLU+GLN for each VOI.
Figure 4.
Box and whisker plots showing the range of Cramér-Rao minimum variance bounds (% standard deviation) for metabolite quantifications as calculated by LCModel for each VOI.
Repeatability
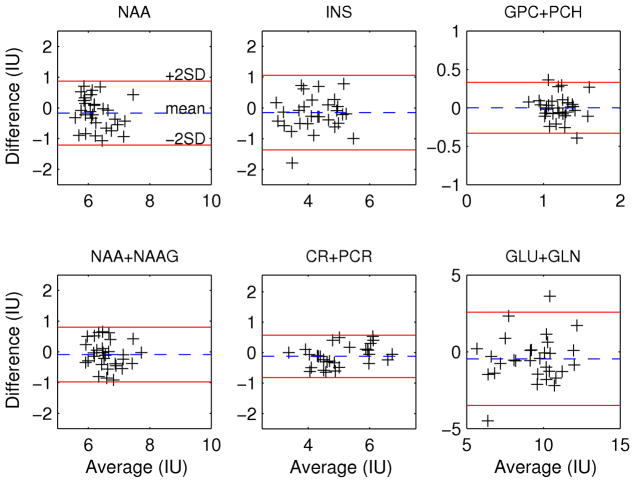
The concentrations from all 31 repeated scans were compared in a Bland Altman plot for NAA, INS, GPC+PCH, NAA+NAAG, CR+PCR, and GLU+GLN (Figure 5). The measurement standard deviation (SDmeas) calculated from the difference of each of 31 repeated acquisitions and the mean concentrations of all 62 measurements (2×31) were calculated and are summarized in Table 1. The RMS CRB (in IU) for each metabolite is compared to the SDmeas in Table 1. Table 1 further lists the results of an F-test comparing the two variances and shows that for all these metabolites there were no significant differences, except for GPC+PCH for which the measured SD tended to be higher (F(30) = 1.7, p = 0.08). All 62 repeat acquisitions had an absolute localization error less than 6 mm and on average was 2.2 mm.
Figure 5.
Bland Altman plots of differences in concentration at two time points as a function of the average concentration for the 31 repeated acquisitions.
Table 1.
Comparison of measurement standard deviation calculated from concentration differences of intra subject repeated scans to the RMS CRB
| Mean (IU) | SDmeas (IU) | RMS CRB (IU) | F-Test | |
|---|---|---|---|---|
| NAA | 6.28 | 0.37 | 0.37 | 0.98 |
| INS | 4.17 | 0.43 | 0.51 | 0.71 |
| GPC+PCH | 1.20 | 0.12 | 0.09 | 1.71† |
| NAA+NAAG | 6.60 | 0.32 | 0.33 | 0.91 |
| CR+PCR | 5.02 | 0.25 | 0.28 | 0.76 |
| GLU+GLN | 9.27 | 1.07 | 1.24 | 0.75 |
NAA, N-acetyl aspartate. INS, myo-inositol. GPC+PCH, glycerophosphocholine and phosphocholine combined. NAA+NAAG, N-acetyl aspartate and N-acetyl aspartyl glutamate combined. CR+PCR, creatine and phosphocreatine combined. GLU+GLN, sum of glutamate and glutamine.
p<0.1
Subject Movement - Within and Between Acquisitions
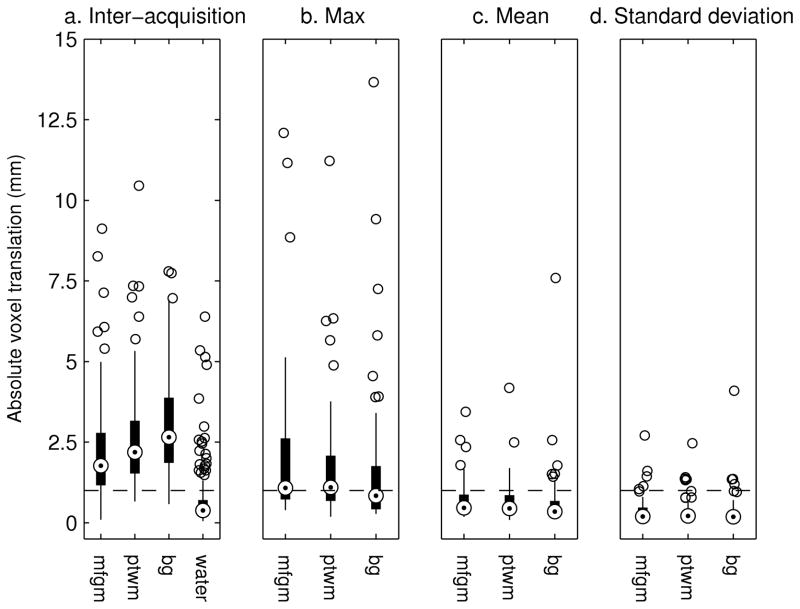
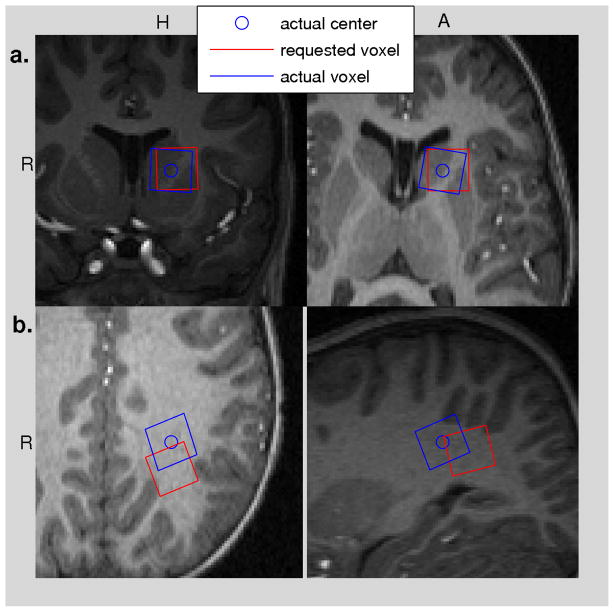
Localising errors present at the start of each acquisition are shown in Figure 6a. In addition, the difference in position between the relevant water reference acquisition and the start of the associated acquisition is plotted. A 10% error in voxel volume is shown by the dashed black line. The displacement tends to increase with the order in which regions were acquired. 73% of subjects moved between acquisitions causing a 1.5 mm voxel shift (10% volume error) or greater. 41% of subjects moved between acquisitions causing a 2.5 mm shift or greater. This localization error, the difference between the intended and acquired voxel locations, for two subjects is shown in Figure 7. In one subject the voxel displacement was 4 mm causing the voxel to shift into the ventricle and in the other the shift was 10.4 mm.
Figure 6.
Box and whisker diagrams showing the displacement of SVS voxels from their intended locations for each VOI. a. Inter acquisition shifts were assessed between the start of the scan session and the relevant acquisition; “water” denotes the displacement between the relevant water reference and the start of the relevant acquisition. b–d. Maximum, mean, and standard deviation of displacement during each acquisition.
Figure 7.
Incorrect voxel location due to motion between structural and SVS acquisitions. a. Coronal and transverse slices from a subject for whom movement caused the voxel to move into the ventricle. This small shift had a significant impact on the spectral quality and corresponds to the outlier in Figure 2 with an SNR of 6. b. Coronal and sagittal slices for an acquisition in peritrigonal white matter where the voxel shifted 10.4 mm. The voxel remained predominantly in white matter.
Within acquisition voxel shifts were assessed; this motion is corrected prospectively by the navigator. Figure 6b, c, and d show the maximum, mean, and standard deviation, respectively, of absolute voxel displacement for the mfgm, ptwm and bg VOIs. The voxel moved more than 1.5 mm in 32% of acquisitions and more than 2.5 mm in 20% of acquisitions. The standard deviation of absolute voxel shift in all scans with a maximum shift less than 1.5 mm (115 scans) was 0.16 mm.
Finally, the navigator logs were assessed with respect to subject orientation (L-R, A-P and H-F). More subjects moved by more than 1 mm in the Head – Foot direction than in the other two directions (31% compared to 10% and 16% in A-P and L-R, respectively). Similarly, more subjects rotated their heads by more than 2° up and down (about the L-R axis) compared to the other two axes (21% compared to 6 % and 4 % about the A-P and H-F axes, respectively).
Frequency Stability
The standard deviations of offline frequency corrections, calculated across all scans, were 1.4 Hz, 1.7 Hz and 1.4 Hz in the mfgm, ptwm and bg VOIs, respectively. Maximum frequency offsets for children that moved less than 2 mm during the scan were 4.32 Hz, 5.1 Hz, and 6.7 Hz in the mfgm, ptwm and bg, respectively. For those that moved more than 2 mm these maximum frequency offsets were 15.7 Hz, 12.6 Hz and 24.1 Hz in the mfgm, ptwm and bg, respectively.
B0 Corrections
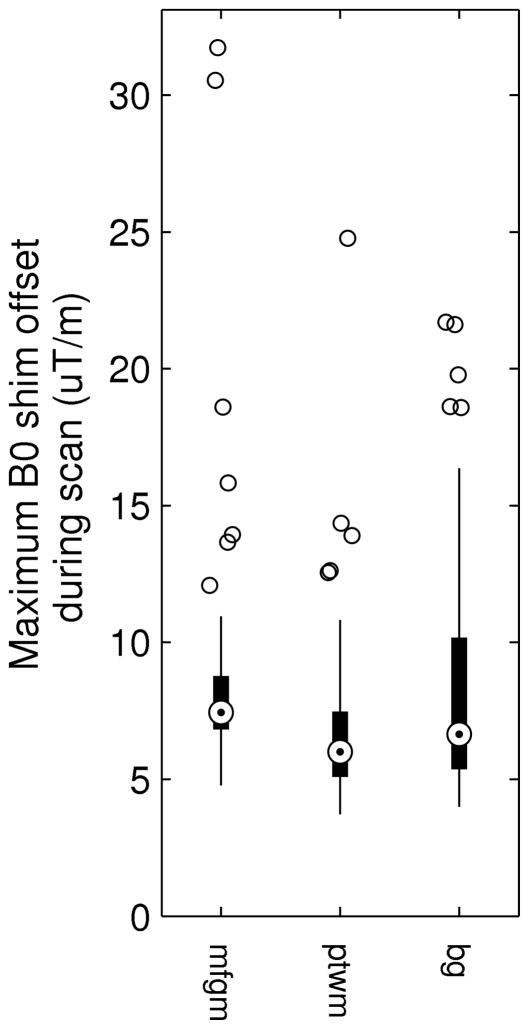
The maximum B0 gradient applied by the navigator at any time during an acquisition is plotted in Figure 8. This is plotted as the Euclidean norm relative to the initial shim. This maximum exceeded 10 μT/m in 18% of subjects. The standard deviations of B0 gradients applied (Euclidean norm and not excluding scans with motion) were 2.0 μT/m, 1.7 μT/m, and 2.0 μT/m in the mfgm, ptwm and bg, respectively. The highest averaged B0 gradient applied over the duration of any acquisition was 7 μT/m, 7.5 μT/m and 9.5 μT/m in the mfgm, ptwm and bg, respectively.
Figure 8.
Maximum first-order B0 gradient applied by the navigator at any time during an acquisition for the three VOIs. Gradients are Euclidean norms computed relative to the initial shim.
DISCUSSION
The goal of prospective motion and B0 navigation in SVS PRESS is to obtain consistent spectral quality. This has been investigated in 186 acquisitions from five-year-old children. The data gathered from these scans provide valuable insight into how much children in this age range may be expected to move during scanning and how such motion affects the B0 shim when scanning in three different regions.
To date, a number of head pose tracking systems have been proposed for SVS. The first is based on the prospective motion correction (PROMO) technique (11), which performs rigid body head tracking using a magnetic resonance (MR) navigator built into the SVS acquisition. The PROMO navigator consists of a set of three orthogonal spiral images. The second employs an optical tracking camera setup to monitor markers attached to the subject’s head and in turn prospectively updates the sequence (12,13). Both of these techniques additionally perform frequency correction using either a residual water signal (14) or an interleaved frequency MR navigator (15), and the PROMO technique has been paired with an additional navigator to perform first order B0 shim correction (16).
In addition to real-time motion and B0 tracking and correction, offline data pre-processing is important. This ensures that zero-order phase and frequency variations do not cause destructive summation of measurements (17). There are a number of techniques available to perform this step (8,14,18,19) that either use a residual water signal or spectral information.
Linewidth, defined as the full width at half maximum of a metabolite peak, determines the spectral resolution. Spectral quality is assessed by three parameters including linewidth, SNR, and CRBs. Narrow linewidths reduce the variance in the fitting procedure. SNR however can be defined in multiple ways and for this reason is more complicated to compare between studies. The measure used in this study is that reported by LCModel (9). This is calculated as the height of the highest metabolite peak divided by the standard deviation of the residual after fitting.
The best linewidths for this study were found in the mfgm. The linewidths are consistent with values reported in the literature which ranged from 3.5 Hz to 7.8 Hz in ROIs that ranged from frontal grey matter to parietal white matter (1,20–22). On average, the linewidth was higher in the bg, however still well within this reported range. The worst linewidth for a single scan was in the bg, where a localization error caused it to be partly in the ventricle.
Signal to noise ratio had a relatively larger range than linewidth. This range can be expected as SNR is calculated using the peak value of a metabolite, which is affected by both metabolite concentration and linewidth. The average mfgm SNR is comparable to that reported in the literature (1) for a 7 year old child after correcting for voxel volume. As expected, there is an inverse relationship between linewidth and SNR. This demonstrates the reliability and consistency of the real time shim measurements.
The CRBs are the lowest possible standard deviations of all unbiased model parameter estimates obtained from the data (23). A CRB will be affected by both linewidth and SNR and as a result can be used to determine which metabolite concentrations were successfully modelled. It is reported as either a concentration standard deviation or as a percentage of metabolite concentration. Unfortunately CRBs do not scale in the same way as SNR does with voxel size or number of averages and thus are not compared to literature reported values. The best CRBs were consistently achieved in the mfgm, in line with the reduced linewidth in this region. All three VOIs demonstrated CRBs under 25% for GLU, NAA, GPC+PCH, NAA+NAAG, CR+PCR and GLU+GLN.
The acquisition parameters of these scans were chosen to keep the scan time short, 2 min 16 s, with relatively small VOIs (15 × 15 × 15 mm3). A TR of 2 s was used, which likely results in saturation effects compared to using a TR of 3 s. While this satisfied the goals of this study, longer scan times or larger VOIs would have increased the SNR and improved the CRBs, making more metabolites’ concentrations quantifiable.
No user involvement was employed in the shimming procedure, with all first-order shims being set directly by the navigator and second order shims being set by the system.
Intra subject repeatability closely resembled the CRBs, with only GPC+PCH measurement standard deviation exceeding that predicted by the CRB. This metabolite had the lowest measurement standard deviation, 0.12 IU compared to 0.25 IU for the next smallest and is the likely result of the anomaly. This finding demonstrates that we have not introduced systematic variations with our real time adjustments. Such systematic variations would be reflected in repeatability but not in the CRB.
An assessment of the standard deviation of residual measurement frequency as observed in the data pre-processing shows frequency fluctuations that result from a number of sources. These include navigator error, physiological variations occurring more rapidly than the navigator (< 1 s), and the effects of movement between the navigator and the SVS measurement. These variations were enough to deem data pre-processing necessary. For subjects that did not move, the greatest frequency offset of 6.7 Hz wasn’t enough to cause a significant shift with respect to the water saturation band.
Although it is recognised that subjects move while in the scanner, the number that move or to what extent they move is not well documented. Many parameters affect how much a person moves, including individual differences, comfort and how constraining the coil’s support padding and the headphones are. In this study we observed that the predominant types of movement were subjects ‘sliding’ out of the coil which can have both translation (H-F direction) and rotational components (chin up and down); 31% exhibited this type of translation and 21% of subjects this type of rotation. These are the hardest directions in which to restrict movement, since one cannot place barriers to stop subjects sliding out of the head coil and likewise up and down rotations are difficult to restrict in a coil that is large compared to the subject.
The number of subjects that moved significantly (> 2.5 mm voxel shift) prior to an acquisition was 40% compared to 20% moving significantly during an acquisition. The total difference in position relative to the structural scan tended to increase throughout the scanning session.
An additional source of movement error, although only significant for a handful of subjects, is the movement between the relevant water reference and the start of the associated SVS acquisition. This demonstrates that the greatest weakness of this navigator is the absence of online correction for movement prior to the start of the acquisition. This process has been demonstrated offline and should, in future developments, be incorporated into the navigator to ensure a constant patient based frame of reference. In the mean time we recommend the use of a tool such as AutoAlign (24,25) that ensures a patient based frame of reference.
Head movements do not necessarily have to be large to have a detrimental effect on spectral quality as shown in Figure 7 where a movement of only 4 mm led to some ventricle being included in the VOI. The accuracy of the navigators motion correction has been assessed using the standard deviation of motion logs in subjects that did not move substantially during the scan. This standard deviation is ten times lower than a 10% error in voxel volume.
The B0 corrections that were applied in real-time were significant enough, such that if they were not applied proportional line broadening would have resulted. A B0 gradient of 10 μT/m in our 15 mm voxel introduces a 6.3 Hz frequency distribution. This is on the order of the largest linewidth measured in our data. All B0 changes would have given rise to spectral degradation in one way or another. For instance, the extreme change of 30 μT/m for one measurement can reduce the average spectral magnitude while leaving the average linewidth unaffected, thus causing a systematic error in concentration estimation.
The accuracy of absolute metabolite quantification may be affected by motion correction if the water reference and spectra are acquired in different locations, giving rise to changes in B1 and B0. The method used in the work minimizes changes in B0, however it does not address changes in B1.
A limitation of the navigator, although not observed in this study, is that it runs with fixed higher order shims (2nd order and above) due to hardware design limitations (lack of eddy current compensation and real-time control of these shim channels). This may be overcome as more sophisticated gradient amplifiers are introduced.
In conclusion B0 shim and motion navigated single voxel spectroscopy has been shown to give reliable and repeatable spectral quality across three regions of interest in five-year-old children. It has been found that spectral quality is comparable and sometimes better than that reported in the literature and enabled a high success rate. The study has assessed the extent to which these children moved in the scanner and found that most moved from acquisition to acquisition and a significant number moved during acquisitions. In conclusion, prospective motion and B0 correction is a valuable tool for the assurance of spectral quality and the vNav PRESS sequence provides high quality repeatable spectra.
Acknowledgments
The South African Research Chairs Initiative of the Department of Science and Technology and National Research Foundation of South Africa, Medical Research Council of South Africa, NIH grants R21AA017410, R21MH096559, R01HD071664, and U19A153217 through the Comprehensive International Program of Research on AIDS (CIPRA) network, NRF grant CPR20110614000019421, and the University of Cape Town VC Interim Funding. We thank radiographers Marie-Louise de Villiers and Nailah Maroof, Lindie du Plessis for assistance with LCModel analyses, mathematician/physicist M. Dylan Tisdall and Mark F Cotton for advice on the study, Shabir A Madhi for facilitating the study, and research assistants Thandi Hamana and Lungiswa Rosy Khethelo.
Abbreviations
- SVS
Single voxel spectroscopy
- vNav
Volume EPI navigator
- PRESS
Point resolved spectroscopy
- EPI
Echo planar imaging
- SNR
Signal to noise ratio
- CRB
Cramér-Rao minimum variance bounds
- ROI
Region of interest
- mfgm
Medial frontal grey matter
- ptwm
Peritrigonal white matter
- bg
Basal ganglia
References
- 1.Kreis R. Issues of spectral quality in clinical 1 H-magnetic resonance spectroscopy and a gallery of artifacts. NMR in Biomedicine. 2004;17:361–381. doi: 10.1002/nbm.891. Internet. [DOI] [PubMed] [Google Scholar]
- 2.Hess AT, Tisdall MD, Andronesi OC, Meintjes EM, van der Kouwe AJW. Real-time motion and B0 corrected single voxel spectroscopy using volumetric navigators. Magnetic Resonance in Medicine. 2011;66:314–23. doi: 10.1002/mrm.22805. Internet. [DOI] [PMC free article] [PubMed] [Google Scholar]
- 3.Madhi SA, Adrian P, Cotton MF, McIntyre JA, Jean-Philippe P, Meadows S, Nachman S, Käyhty H, Klugman KP, Violari A. Effect of HIV Infection Status and Anti-Retroviral Treatment on Quantitative and Qualitative Antibody Responses to Pneumococcal Conjugate Vaccine in Infants. The Journal of infectious diseases. 2010;202:355–361. doi: 10.1086/653704. [DOI] [PMC free article] [PubMed] [Google Scholar]
- 4.Violari A, Cotton MF, Gibb DM, Babiker AG, Steyn J, Madhi SA, Jean-Philippe P, McIntyre JA. Early antiretroviral therapy and mortality among HIV-infected infants. The New England journal of medicine. 2008;359:2233–44. doi: 10.1056/NEJMoa0800971. Internet. [DOI] [PMC free article] [PubMed] [Google Scholar]
- 5.Keller MA, Venkatraman TN, Thomas MA, Deveikis A, Lopresti C, Hayes J, Berman N, Walot I, Ernst T, Chang L. Cerebral metabolites in HIV-infected children followed for 10 months with 1H-MRS. Neurology. 2006;66:874–9. doi: 10.1212/01.wnl.0000203339.69771.d8. Internet. [DOI] [PubMed] [Google Scholar]
- 6.Tisdall MD, Hess AT, Reuter M, Meintjes EM, Fischl B, van der Kouwe AJW. Volumetric navigators for prospective motion correction and selective reacquisition in neuroanatomical MRI. Magnetic Resonance in Medicine. 2011;68:389–99. doi: 10.1002/mrm.23228. Internet. [DOI] [PMC free article] [PubMed] [Google Scholar]
- 7.Van Der Kouwe AJW, Benner T, Salat DH, Fischl B. Brain morphometry with multiecho MPRAGE. NeuroImage. 2008;40:559–569. doi: 10.1016/j.neuroimage.2007.12.025. [DOI] [PMC free article] [PubMed] [Google Scholar]
- 8.Hess AT, van der Kouwe AJW, Meintjes EM. Water-independent frequency- and phase-corrected spectroscopic averaging using cross-correlation and singular value decomposition. ISMRM 2011. 2011;19:148. [Google Scholar]
- 9.Provencher SW. Automatic quantitation of localized in vivo 1H spectra with LCModel. NMR in biomedicine. 2001;14:260–264. doi: 10.1002/nbm.698. [DOI] [PubMed] [Google Scholar]
- 10.Ashburner J. A fast diffeomorphic image registration algorithm. Neuroimage. 2007;38:95–113. doi: 10.1016/j.neuroimage.2007.07.007. Internet. [DOI] [PubMed] [Google Scholar]
- 11.Keating B, Deng W, Roddey JC, White N, Dale A, Stenger VA, Ernst T. Prospective motion correction for single-voxel 1H MR spectroscopy. Magnetic Resonance in Medicine. 2010;64:672–679. doi: 10.1002/mrm.22448. Internet. [DOI] [PMC free article] [PubMed] [Google Scholar]
- 12.Zaitsev M, Speck O, Hennig J, Büchert M. Single-voxel MRS with prospective motion correction and retrospective frequency correction. NMR in Biomedicine. 2010;23:325–332. doi: 10.1002/nbm.1469. [DOI] [PubMed] [Google Scholar]
- 13.Andrews-Shigaki BC, Armstrong BSR, Zaitsev M, Ernst T. Prospective motion correction for magnetic resonance spectroscopy using single camera Retro-Grate reflector optical tracking. Journal of Magnetic Resonance Imaging. 2011;33:498–504. doi: 10.1002/jmri.22467. Internet. [DOI] [PMC free article] [PubMed] [Google Scholar]
- 14.Ernst T, Li J. Phase Navigators for Localized MR Spectroscopy using Water Suppression Cycling. Proceedings of the 17th Annual Meeting of the ISMRM; 2009. p. 239. [Google Scholar]
- 15.Thiel T, Czisch M, Elbel GK, Hennig J. Phase coherent averaging in magnetic resonance spectroscopy using interleaved navigator scans: compensation of motion artifacts and magnetic field instabilities. Magnetic Resonance in Medicine. 2002;47:1077–1082. doi: 10.1002/mrm.10174. [DOI] [PubMed] [Google Scholar]
- 16.Keating B, Ernst T. Real-time dynamic frequency and shim correction for single-voxel magnetic resonance spectroscopy. Magnetic Resonance in Medicine. 2012;68:1339–45. doi: 10.1002/mrm.24129. Internet. [DOI] [PMC free article] [PubMed] [Google Scholar]
- 17.Gabr RE, Sathyanarayana S, Schär M, Weiss RG, Bottomley PA. On restoring motion-induced signal loss in single-voxel magnetic resonance spectra. Magnetic Resonance in Medicine. 2006;56:754–760. doi: 10.1002/mrm.21015. Internet. [DOI] [PMC free article] [PubMed] [Google Scholar]
- 18.Star-Lack JM, Adalsteinsson E, Gold GE, Ikeda DM, Spielman DM. Motion correction and lipid suppression for 1H magnetic resonance spectroscopy. Magnetic Resonance in Medicine. 2000;43:325–330. doi: 10.1002/(sici)1522-2594(200003)43:3<325::aid-mrm1>3.0.co;2-8. Internet. [DOI] [PubMed] [Google Scholar]
- 19.Helms G, Piringer A. Restoration of motion-related signal loss and line-shape deterioration of proton MR spectra using the residual water as intrinsic reference. Magnetic Resonance in Medicine. 2001;46:395–400. doi: 10.1002/mrm.1203. Internet. [DOI] [PubMed] [Google Scholar]
- 20.Li Y, Xu D, Ozturk-isik E, Lupo JM, Chen AP, Vigneron DB, Nelson SJ. T1 and T2 Metabolite Relaxation Times in Normal Brain at 3T and 7T. Molecular Imaging & Dynamics. 2012:S:1–5. doi: 10.4172/2155-9937.S1-002. [DOI] [Google Scholar]
- 21.Barker PB, Hearshen DO, Boska MD. Single-voxel proton MRS of the human brain at 1.5T and 3. 0T. Magnetic Resonance in Medicine. 2001;45:765–9. doi: 10.1002/mrm.1104. Internet. [DOI] [PubMed] [Google Scholar]
- 22.Baker EH, Basso G, Barker PB, Smith M a, Bonekamp D, Horská A. Regional apparent metabolite concentrations in young adult brain measured by (1)H MR spectroscopy at 3 Tesla. Journal of Magnetic Resonance Imaging [Internet] 2008;27:489–99. doi: 10.1002/jmri.21285. [DOI] [PMC free article] [PubMed] [Google Scholar]
- 23.Cavassila S, Deval S, Huegen C, van Ormondt D, Graveron-Demilly D. Cramér-Rao bounds: an evaluation tool for quantitation. NMR in biomedicine. 2001;14:278–83. doi: 10.1002/nbm.701. Internet. [DOI] [PubMed] [Google Scholar]
- 24.Van der Kouwe AJW, Benner T, Fischl B, Schmitt F, Salat DH, Harder M, Sorensen AG, Dale AM. On-line automatic slice positioning for brain MR imaging. NeuroImage. 2005;27:222–30. doi: 10.1016/j.neuroimage.2005.03.035. Internet. [DOI] [PubMed] [Google Scholar]
- 25.Benner T, Wisco JJ, van der Kouwe AJW, Fischl B, Vangel MG, Hochberg FH, Sorensen AG. Comparison of manual and automatic section positioning of brain MR images. Radiology. 2006;239:246–54. doi: 10.1148/radiol.2391050221. Internet. [DOI] [PubMed] [Google Scholar]


