Abstract
Purpose
To evaluate different susceptibility weighted imaging (SWI) phase processing methods and parameter selection, thereby improving understanding of potential artifacts, as well as facilitating choice of methodology in clinical settings.
Materials and Methods
Two major phase processing methods, Homodyne-filtering and phase unwrapping-high pass (HP) filtering, were investigated with various phase unwrapping approaches, filter sizes, and filter types. Magnitude and phase images were acquired from a healthy subject and brain injury patients on a 3T clinical Siemens MRI system. Results were evaluated based on image contrast to noise ratio and presence of processing artifacts.
Results
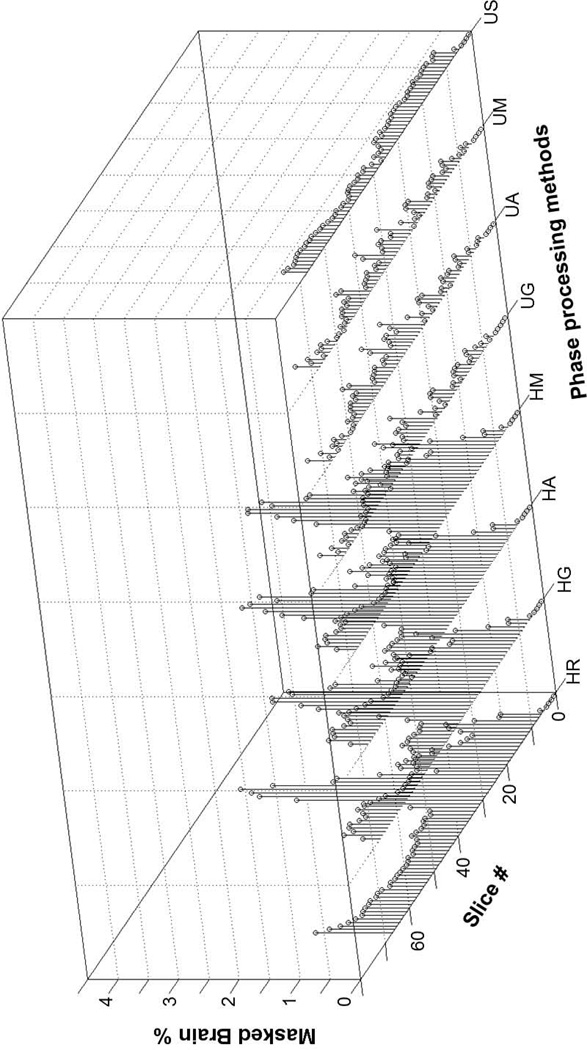
When using a relatively small filter size (32 pixels for the matrix size 512 × 512 pixels), all Homodyne-filtering methods were subject to phase errors leading to 2% to 3% masked brain area in lower and middle axial slices. All phase unwrapping-filtering/smoothing approaches demonstrated fewer phase errors and artifacts compared to the Homodyne-filtering approaches. For performing phase unwrapping, Fourier-based methods, although less accurate, were 2–4 orders of magnitude faster than the PRELUDE, Goldstein and Quality-guide methods.
Conclusion
Although Homodyne-filtering approaches are faster and more straightforward, phase unwrapping followed by HP filtering approaches perform more accurately in a wider variety of acquisition scenarios.
Keywords: susceptibility weighted imaging, homodyne filter, phase unwrapping, image contrast
INTRODUCTION
Magnetic susceptibility refers to the magnetic response of a material towards an applied external magnetic field. Susceptibility-weighted imaging (SWI) is a magnetic resonance imaging (MRI) method that takes advantage of the magnetic susceptibility differences among different brain tissues to provide image contrast that highlights regions of interest, especially in venous blood, hemorrhages, and iron storage (1,2). Offering information complementary to traditional spin density, T1 or T2 imaging methods, SWI facilitates a wide range of clinical diagnoses by offering susceptibility-based image contrast to assist visualizations of the cerebral vascular system and many intracranial pathologies (3–5). The process of generating an SWI image begins with acquiring magnitude and phase images using a three dimensional (3D) high-resolution gradient echo (GRE) scan (2). Signals from deoxygenated venous blood, hemorrhages or tissues with high iron content have significantly different susceptibilities than their neighboring tissues. Such differences lead to a different degree of signal loss in the magnitude image and a different amount of phase accumulation in the phase image, which are combined to provide an exquisite image with enhanced contrast. This work reviews and evaluates common techniques for combining the magnitude and phase information in SWI.
After data acquisition, raw phase images usually require further processing before being combined with the magnitude images to produce the final SWI images. In particular, raw phase images are subject to phase wrapping artifacts wherever phase values exceed the [−π, π] range. Additionally, magnetic field inhomogeneities, partially due to air-tissue interfaces, introduce slowly-varying background gradients to the acquired phase data. Both effects need to be removed to estimate the true phase values, which can then be used to enhance contrast within the magnitude images. The most common and straightforward approach to recover the phase uses a high-pass (HP) homodyne-filter (6). In this approach, a complex division is applied between the original complex data and a low-pass(LP) filtered version of the original data. Then the true phase is calculated as the angle of the division result. Homodyne filtering is an approach that intends to remove both these unwanted phase artifacts simultaneously. Various types of LP filters have been proposed in Homodyne filtering. A rectangular filter in the frequency domain is easy to implement and is applied in some clinical scanners. The NMR signal processing software SPIN (http://www.mrc.wayne.edu/download.htm) employs Hanning and Hamming filters. Other researchers have proposed Gaussian filtering (7). Since the characteristics of these filters vary, results from applying them will differ. Residual phase wraps may occur when the filter size is too small, while the image contrast degrades when the filter size is too large (7).
An alternative approach to remove wraps and background gradients from the raw phase is to perform phase unwrapping followed by HP filtering. Phase unwrapping restores the continuous phase values, ensuring no residual phase wrapping errors (8–11). Inverted Gaussian filtering or boxcar smoothing have been proposed as HP filters to remove background gradients (7,12). Because of the phase unwrapping step, which can be a challenging problem of its own, this approach is more computationally expensive than homodyne filtering approaches.
The quality of SWI results is highly dependent on the accuracy and robustness of post-processing on the phase image. While image phase can provide unique image contrast, it is not a tissue property and is not spatially localized to its source due to the dipole effects. In addition, MR phase is affected by a number of factors, including spatial distribution of susceptibility, echo time, tissue geometric structures and their relative orientation to the magnetic field (13). To overcome these effects, many studies aim to obtain the distribution of susceptibility using quantitative susceptibility mapping (QSM)(14–17). Ideally QSM represents the distribution of an intrinsic tissue property (magnetic susceptibility), but its quantification is challenging because it requires solving an inverse problem involving singularities. Although QSM approaches are quite promising, processing techniques and the interpretation of results are still an emerging area of research. On the other hand, SWI techniques have been applied widely in clinical applications for years and have proven their benefit, particularly in diseases such as brain cancer and traumatic brain injury (TBI).
While the resulting image contrast from SWI is relatively consistent, there are several approaches in processing the image phase, including Homodyne filtering and phase unwrapping approaches as mentioned above. Currently, little work has been done to compare the performance of these approaches, nor to study the influence of filter type and size. The purpose of this work is to quantitatively and qualitatively evaluate these approaches. Using both simulated and in vivophase data, we evaluate phase unwrapping approaches with different filters based on several criteria, including image contrast-to-noise (CNR) ratio, mean and standard deviation of measured phase errors and masked brain percentage due to processing errors. Image artifacts were analyzed and parameters for phase processing were optimized. Preliminary results of this work have been previously reported in a conference paper (7).
METHODS
Phase and Susceptibility Effects
When imaging using a GRE sequence, phase φ of the MR signal linearly accumulates over time according to local angular frequency ω At a given echo time (TE), the acquired phase at a specific location (x, y) is linearly proportional to the local field strength B(x, y) and TE:
| [1] |
where γ0 is the gyromagnetic ratio. Local field strength B(x, y) is largely dependent on the main magnetic field B0, while variations of it mainly come from susceptibility effects. From Eq. [1], longer TE and larger susceptibility effects (usually from iron-concentrated tissue and blood products) result in increased phase contrast, making observations of small vessels and micro-hemorrhages possible. However, phase wraps also occur more extensively at locations with large intensity contrast, which impacts the results of the phase processing method used.
Data Acquisition
Both simulated data and in vivohead MRI data were used in this study. A healthy volunteer and a TBI patient were scanned under an IRB-approved protocol on a 3T Siemens Verio clinical MRI system. Written informed consent was obtained from the healthy volunteer and the TBI patient.
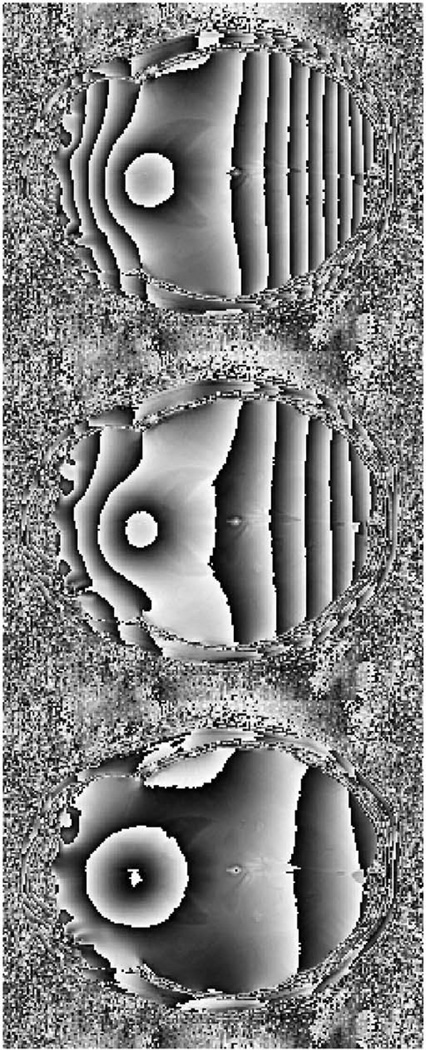
A set of images was simulated to have phase wraps based on an in vivo phase data set acquired from the healthy volunteer using a 3D multi-echo GRE sequence, which did not have phase wraps due to a short TE of 4.5 ms. Particular imaging parameters for the selected phase data were: flip angle 20 degrees, repetition time (TR) 110 ms, TE [4.5, 8.4, 11.7, 15.5, 18.4, 21.8, 25.1, 28.5, 31.8 and 35.1] ms, 28 slices, matrix size 256 × 256, voxel size 1 × 1 × 2.5 mm3. Three cases, defined as limited phase wraps, moderate phase wraps and extensive phase wraps, were simulated by multiplying a parabolic scalar field to the real non-wrapped phase data and applying a wrapping function so that −π < φ ≤ π (Figure 1). The parabolic scalar field is defined by the equation f(x, y) = a(x + b)2 + c, where x and y are directions along the columns and rows of the axial phase image. Three adjustable coefficients a, b and c change the curvature of the field, leading to different degree of vertical phase wraps in our simulations. Roughly compared to our simulated cases with the multi-echo phase images, the effective TE for limited, moderate and extensive phase wraps are approximately in the ranges of 11.7–15.5 ms, 21.8–25.1 ms and 31.8–35.1 ms, respectively.
Figure 1.
Simulated phase wraps cases. From left to right are limited phase wraps, moderate phase wraps and extensive phase wraps.
Magnitude and phase images were also acquired on a TBI patient using a 3D GRE sequence. Particular imaging parameters were: flip angle 12 degrees, TR 50 ms, TE 24 ms, acceleration factor (GRAPPA) 2, 140 slices, voxel resolution 1 × 1 × 1 mm3. SWI processing was performed offline as described in the following section. T2 images were acquired from the same patient for identifying brain tissue volume. Acquisition parameters for T2 images were: flip angle 120 degrees, TR 6000 ms, TE 213 ms, 72 slices, voxel resolution 0.5 × 0.5 × 2 mm3.
SWI Post-processing
SWI post-processing typically involves three steps. First, phase-processing removes unwanted artifacts of the raw phase φr(t) signal obtained directly from scanners, yielding the anatomical phase φ (t). Then, a normalized phase mask is computed using Eq. [2] under the assumption that the phase of interest is negative (2):
| [2] |
whereφminis the minimum phase value. The phase mask therefore is a spatial map that varies between zero and one, with low values in areas of interest, and a value of one elsewhere. If the phase of interest is positive, the phase can be negated prior to computing the mask. Finally, the normalized phase mask is applied to original magnitude M(t) data repeatedly for four times to adequately enhance regions with the phase of interest in the final SWI signal S(t) (2):
| [3] |
A minimum intensity projection over multiple slices may be performed to further enhance the image contrast (18). As the second and third SWI post-processing steps are straightforward, this paper will focus on the first step by systematically comparing the two major phase processing approaches: homodyne filtering and phase unwrapping followed by HP filtering.
For the homodyne filter, a simple complex division in the image domain generates the anatomical phase information:
| [4] |
Here K(t) represents the k-space data yielded from the Fourier Transform (ℱ) of the complex image I(t), where I (t) = M (t) eφr(t). L refers to a user specified LP filter.
For the alternative phase unwrapping followed by HP filtering approaches, several different phase unwrapping methods were examined. Consider a pixel with the 2D-index, (i, j), phase unwrapping finds the wrapping factor Ui, j that connects the unwrapped phase φup(i, j)and raw phase φ r(i, j):
| [5] |
Four different methods were tested to unwrap the raw phase:The Goldstein methodworks by depicting discontinuous phase jumps by networks of cuts (8). This algorithm requires a manually selected a starting seed point for each slice. The Fourier method unwraps phase by solving for the Laplacian operator of the difference between the raw and unwrapped phase (9):
| [6] |
Here (p, q) represent k-space coordinates. ℱ and ℱ−1refer to the Fourier and inverse Fourier Transform, which greatly speeds up the unwrapping procedure.PRELUDEis implemented as part of the FSL imaging software toolkit. It is able to unwrap N-dimensional phase maps based on a cost-function approach and a best-pair-first region merging optimization (10).The Quality-guided method is a motion-insensitive spatiotemporal algorithm that unwraps individual phase values based on a measure of phase quality starting at a user-defined seed point, which depends on the smoothness of the phase in all directions (11). Comparison across phase unwrapping methods was performed using 2D images from the TBI patient’s data. Following phase unwrapping, low frequency background gradients were removed either by performing one minus LP filtering in the Fourier domain or subtraction of a smoothed image in the image domain.
Four types of LP filters were examined in this study: a rectangular filter, a Gaussian filter, a Hanning filter and a Hamming filter. Filter size was parameterized by length and width for the rectangular filter (single width for square) and full width at half maximum (FWHM) for all the other filters in the units of image pixels. To make fair comparisons, filter sizes were forced to be equal for all filters. Note that the FWHM for the Gaussian filter is around 2.4 times its standard deviation, and approximately the same as the input coefficient for Hanning and Hamming filter. All filtering methods were performed in the frequency domain. Other than filtering, spatial smoothing has also been proposed to remove background gradients after phase unwrapping (7, 12). To include this method in the comparison, spatial smoothing following phase unwrapping was implemented using a boxcar averaging operator in the image domain, where the smoothing factor is defined as the width of the boxcar averaging operator (7,12). All phase processing algorithms were implemented and executed in Matlab (R2010a), except PRELUDE (FSL v4.1, http://fsl.fmrib.ox.ac.uk/fsl/fsl-4.1.9/fugue/prelude.html).
Quantitative Evaluation
Unwrapped phase from the four different phase unwrapping approaches were re-wrapped and compared with the original wrapped raw phase. The performance of each phase unwrapping algorithm was evaluated by measuring the difference between the computed wrapped phase, the raw phase, as well as the computation time.
For simulated phase data, tested filter sizes varied from 16 pixels to 96 pixels corresponding to a matrix size of 256 × 256 pixels. The smoothing factor varied from 11 pixels to 41 pixels. For the in vivodata, tested filter sizes varied from 16 pixels to 192 pixels corresponding to a matrix size of 512 × 512 pixels. Spatial smoothing was performed using a boxcar width of 5 to 49 pixels. The final enhanced phase results were evaluated based on (1) CNR in regions of interest (ROI) of enhanced magnitude maps(SWI images), (2) percentage of brain regions masked by phase errors, and (3) standard deviation of measured phase errors in simulated data. Because of the low resolution, image contrast for simulated data was calculated using image intensities averaged between a 3 × 3 ROI selected in the globus pallidus, which has a high concentration of iron, and a 3 × 3 ROI over nearby tissue. Image contrast for the in vivo data was calculated using image intensities averaged from two 3 × 3 pixel ROIs: one over veins and the other over adjacent tissues. Noise standard deviation was computed from a region selected outside brain for the simulation data. Because parallel imaging was used for the in vivo data acquisition, noise standard deviation was calculated from a relatively homogeneous region within the brain. Image contrast divided by noise standard deviation yields CNRs.
In order to evaluate how applying the phase mask to the magnitude map can result in loss of data originally present on the magnitude images, the percentage of brain tissue that was masked due to post-processing introduced phase errors was calculated. First, T2 images were registered to the SWI magnitude images and processed to extract the intracranial volume (19). The results were then segmented into 4 classes using Fuzzy C-means clustering algorithm in Mipav (v5.3.4,http://mipav.cit.nih.gov). Combining classes of gray matter and white matter yielded an estimated brain tissue volume. The masked brain tissue percentages for each tested post-processing approach were estimated as the difference between the original and enhanced magnitude images relative to the brain template. To minimize SWI associated enhancement in vessels, a 3 pixel diameter disk was used to erode the difference image. Results for the whole brain volume are provided in the next section. While registration and segmentation were performed using Mipav, all other calculations were implemented in Matlab (R2010a).
RESULTS
Phase Unwrapping Comparison
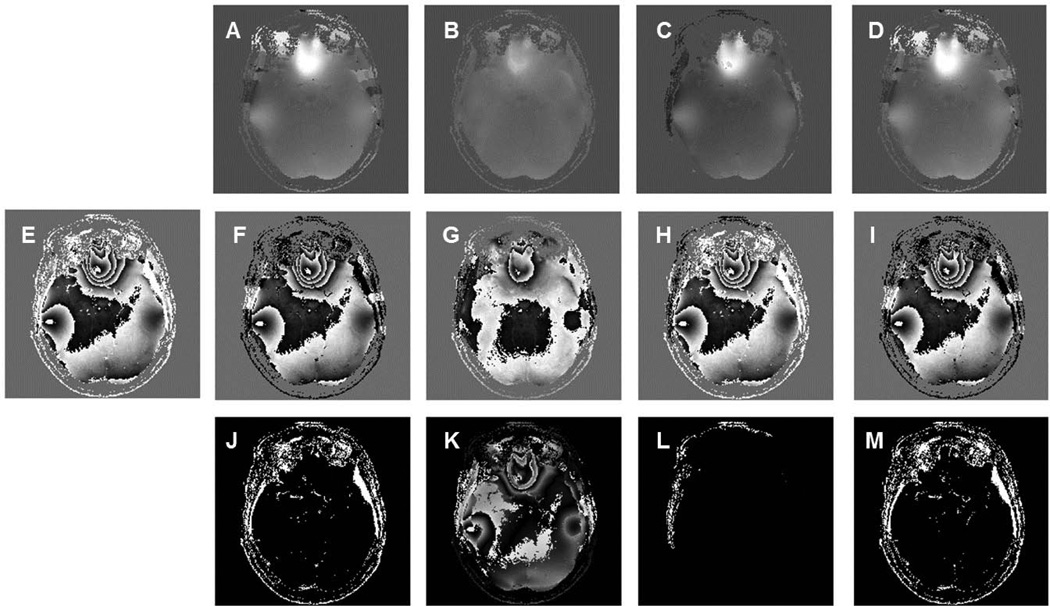
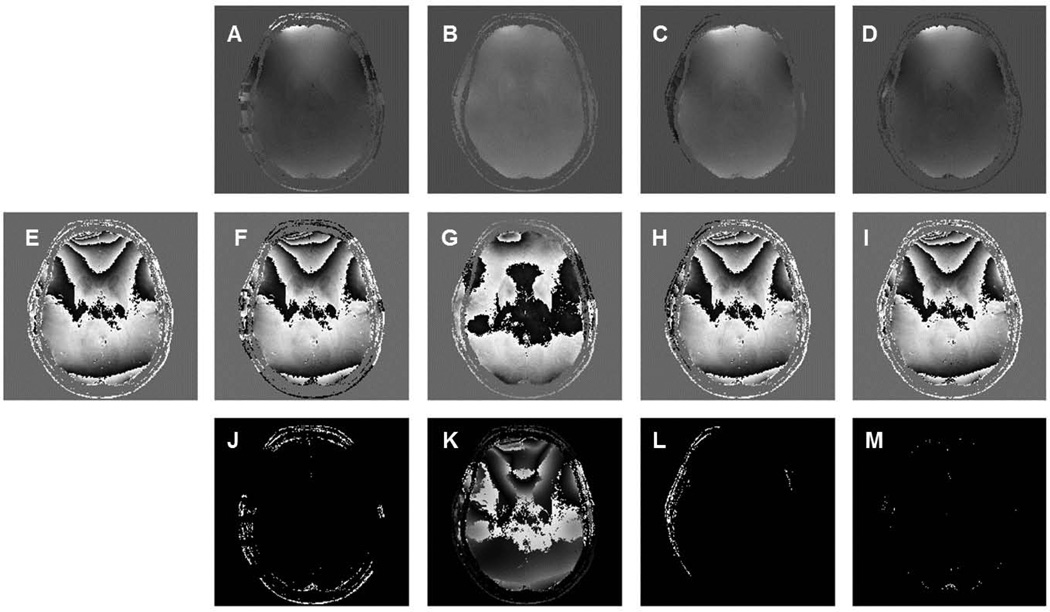
Phase unwrapping was performed through the whole 3D brain volume using the four previously described methods: Goldstein, Fourier, PRELUDE and Quality-Guided. Results from a lower axial brain slice and a higher slice are displayed separately in Figures 2 and 3. Phase tends to wrap extensively at locations where large susceptibility effects are present. At lower axial brain slices, the air-tissue interface near the skull base yields large susceptibility effects, which usually leads to more phase wraps (Figure 2E). In contrast, relatively homogenous field areas at higher brain portions are subject to smaller susceptibility effects, leading to relatively fewer phase wraps (Figure 3E). In both figures, the corresponding wrapped phase images computed from the unwrapped phase were compared with the original raw phase. Examining the unwrapped phase images from four tested methods, the two path-following methods Goldstein and Quality-guide shared similar results. PRELUDE and the Fourier method yielded slightly different unwrapped phase comparing to the path-following approaches. Among all four tested method, the Fourier method produced more smooth looking results, as shown in Figure 2B and Figure 3B. Difference images (computing by subtracting the wrapped phase with raw phase) display quite small differences between the wrapped phase and raw phase for the PRELUDE approach for both lower and higher image slices. More differences were found on lower slices for the Goldstein and Quality-Guide approaches, which may due to the presence of more extensive phase wraps and unbalanced residues caused by the noise. The Fourier approach yields relatively large differences (Figure 2K and 3K). This is because the Fourier method does not constrain the unwrapped phase to integral multiples of 2π larger or smaller than the raw phase as in the other path-following methods. The unwrapped phase from the Fourier approach may deviate from the true phase by a small amount or a constant (9). Another issue with the Fourier approach is that it may have difficulty in dealing with highly wrapped regions and natural phase discontinuities located on the image boundaries (20). Approaches for addressing both issues have previously been proposed and are discussed in the DISCUSSION section.
Figure 2.
Phase unwrapping performed at a lower axial phase image using four different approaches: (A) Goldstein algorithm, (B) Fourier method, (C) PRELUDE (D) Quality-guide method. E is the original raw phase. F, G, H and I are the corresponding wrapped phase computed from A, B, C and D. Subtracting wrapped phase with raw phase yielded absolute difference images (J–M).
Figure 3.
Phase unwrapping performed at a higher axial phase image using four different approaches: (A) Goldstein algorithm, (B) Fourier method, (C) PRELUDE and (D) Quality-guide method. E is the original raw phase. F, G, H and I are the corresponding wrapped phase computed from A, B, C and D. Subtracting wrapped phase with raw phase yielded absolute difference images (J–M).
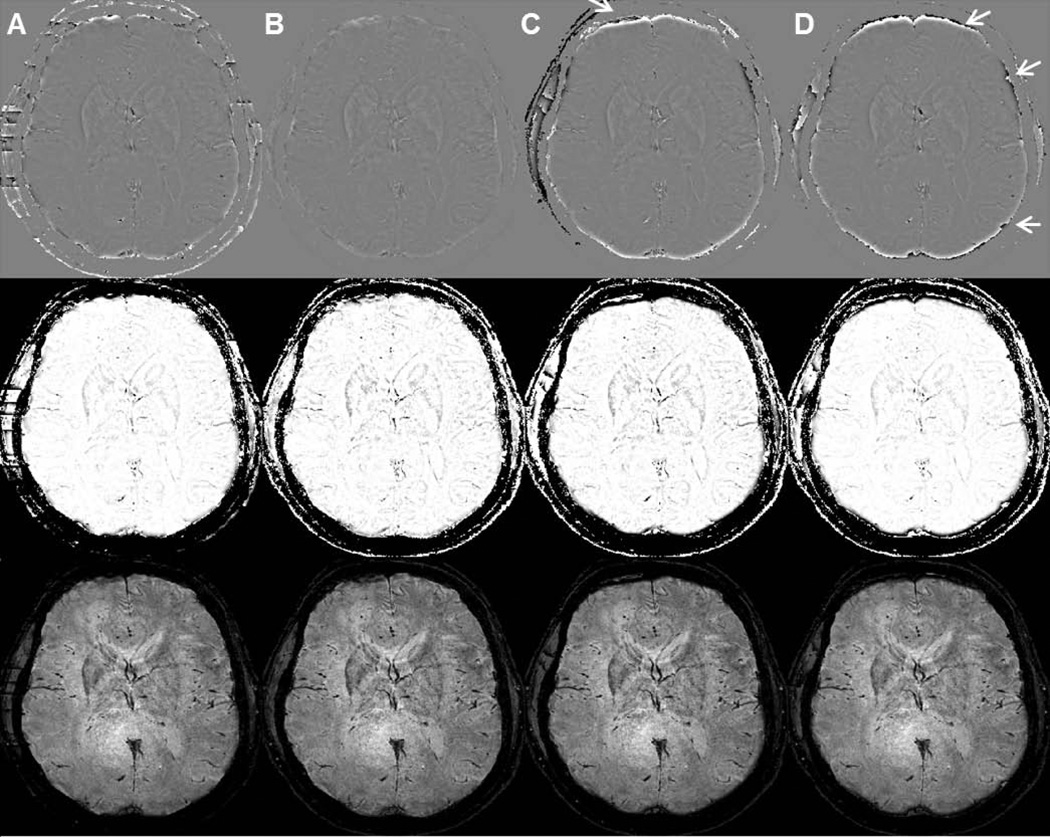
Even though the Fourier approach yields incorrect unwrapped phase, Figure 4 shows that after HP filtering, the enhanced phase, subsequently calculated phase masks and final SWI images is similar to the other three approaches. HP filtering was accompanied by using one minus Gaussian filtering in Figure 4. Both PRELUDE and Quality-guide methods have some boundary errors (white arrows in Figure 4C and 4D), which resulted from incorrect phase unwrapping on edges.Table 1 summarizes the computational efficiency of the three approaches. Overall, the Fourier method runs much faster than the other approaches. Because of its high efficiency and extensibility from 2D to 3D, the Fourier approach was employed to unwrap phase in the remaining comparisons in this paper.
Figure 4.
Unwrapped and filtered phase (top row), corresponding phase masks (middle row) and SWI images (bottom row) generated using different phase unwrapping followed by one minus Gaussian filtering with a filter size of 64 pixels. Specific phase unwrapping methods used were: (A) Goldstein algorithm, (B) Fourier method, (C) PRELUDE and (D) Quality-guide method. White arrows indicate inaccurate boundary values.
Table 1.
Computation time for phase unwrapping approaches
| Goldstein | Fourier | Quality-Guided | PRELUDE | |||
|---|---|---|---|---|---|---|
| Time required to unwrap a 512 × 512 × 140 volume | ~1h 38 m | 28 sec | ~51 h 20 min | ~40 min | ||
| Automatic | No | Yes | No | Yes | ||
Analysis of Simulations
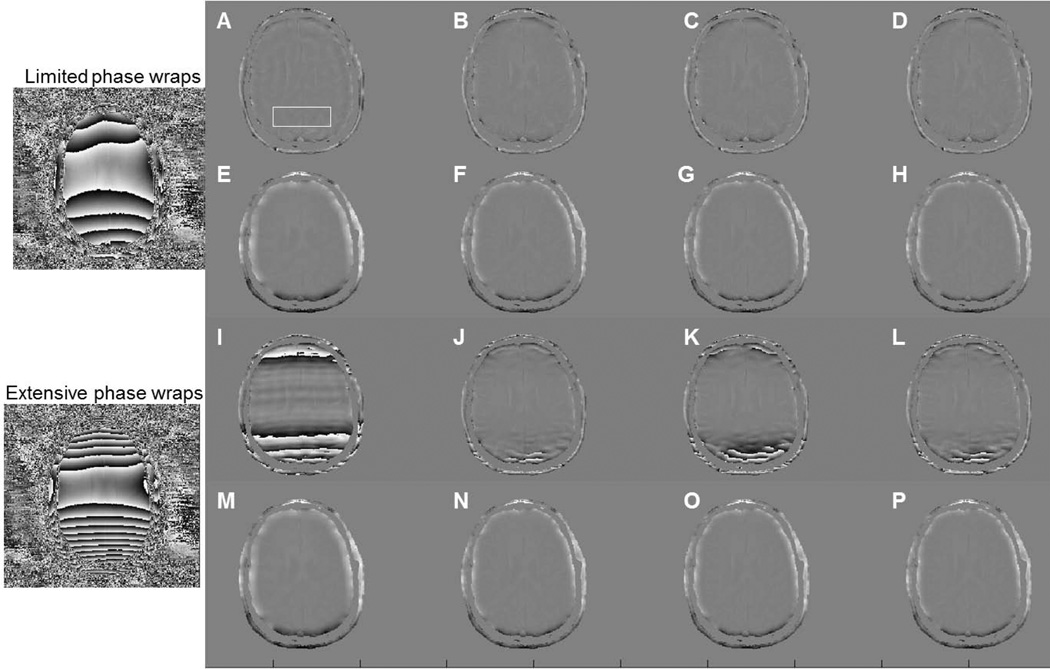
Figure 5 shows the limited and extensive phase wraps simulations, along with their corresponding processed phase images. Background noise was masked out for visualization purposes. For each case, four Homodyne-filtering methods (Homodyne-rectangular filtering, Homodyne-Gaussian filtering, Homodyne-Hanning filtering and Homodyne-Hamming filtering), three phase unwrapping-HP filtering methods (phase unwrapping-Gaussian filtering, phase unwrapping-Hanning filtering, phase unwrapping-Hamming filtering), and phase unwrapping-smoothing approach were used. The specific filter size for this case was 32 pixels while the smoothing factor was 21 pixels. Ringing artifacts appear on the Homodyne-rectangular results (Figure 5A and I), resulting in inaccurate phase calculation. Smoothly rolled off filters, such as Gaussian, Hanning or Hamming filter limit such artifacts. All 8 tested methods work similarly over the limited phase wrap cases, and no obvious image artifacts can be observed within brain areas. On the other hand, residual phase wraps are present in all Homodyne approaches over the extensive phase wrap case. Subjectively, Homodyne-Gaussian filtering (Figure 5J) possesses milder artifacts due to the long tail of Gaussian filter, which preserves information for high spatial frequency while suppresses low spatial frequencies. Performing phase unwrapping prior to filtering avoids residual phase wrap errors (Figure 5M–P), even in extensive phase wrap cases.
Figure 5.
Simulation results for (A–H) limited phase wrap and (I–P) extensive phase wrap case. For each case, enhanced phase images were generated using 8 different methods: (A and I) Homodyne-rectangular filtering, (B and J) Homodyne-Gaussian filtering, (C and K) Homodyne-Hanning filtering, (D and L) Homodyne-Hamming filter, (E and M) phase unwrapping-smoothing, (F and N) phase unwrapping-Gaussian filtering, (G and O) phase unwrapping-Hanning filtering, (H and P) phase unwrapping-Hamming filtering. All filtering methods used a filter size of 32 pixels. Smoothing factors was 21 pixels.
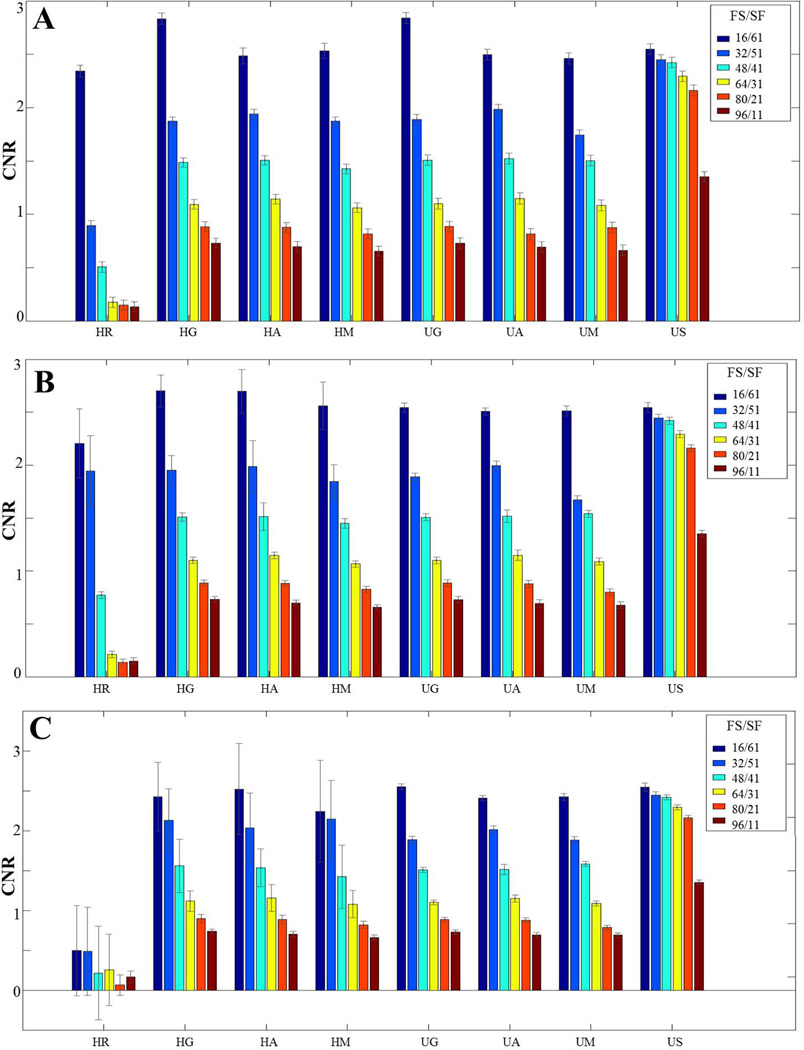
To quantitatively compare the simulation results, image CNR and standard deviation of phase errors were computed. CNR was calculated between a 3 × 3 ROI selected in the iron-concentrated globus pallidus and nearby tissue. The standard deviation (SD) of phase errors in each case was computed over a 20 × 40 pixel ROIs near the bottom of brain area, indicating by the white rectangular in Figure 5A. CNR and SD of phase errors are illustrated as error bars in Figure 6. When there are limited or moderate phase wraps, CNR for all methods were similar to each other. The relatively lower CNR in the Homodyne-Rectangular filtering may be induced by the ringing artifacts mentioned above. Obvious decreases of CNR are observed as the filter size becomes larger or the smoothing factor became smaller. Note that the filter size does not have a one-to-one relationship. Larger range or high CNR of the phase unwrapping-smoothing approach is because the span of the smoothing factor does not have a one to one correspondence with the filter sizes used in the other approaches. Large SD, which represents large phase errors, was observed for all Homodyne approaches over the moderate and extensive phase wrap cases. In such cases, the SD was decreased as the filter size increased, which implies that the amount or intensity of phase errors was reduced. Conversely, the SD for all phase unwrapping-LP filtering approaches remains relatively small, which indicates that only few differences are present between the processed phase and the true model. The observations on images were consistent with implications from the mathematical theory.
Figure 6.
CNR and SD as error bar for (A) limited phase wrap case, (B) moderate phase wrap case and (C) extensive phase wrap case. HR, HG, HA, HM, UG, UA, UM and US indicates Homodyne-rectangular filtering, Homodyne-Gaussian filtering, Homodyne-Hanning filtering, Homodyne-Hamming filtering, phase unwrapping-Gaussian filtering, phase unwrapping-Hanning filtering, phase unwrapping-Hamming filtering and phase unwrapping-smoothing approaches, respectively. FS/SF represent filter sizes/smoothing factors.
Analysis of In Vivo Data
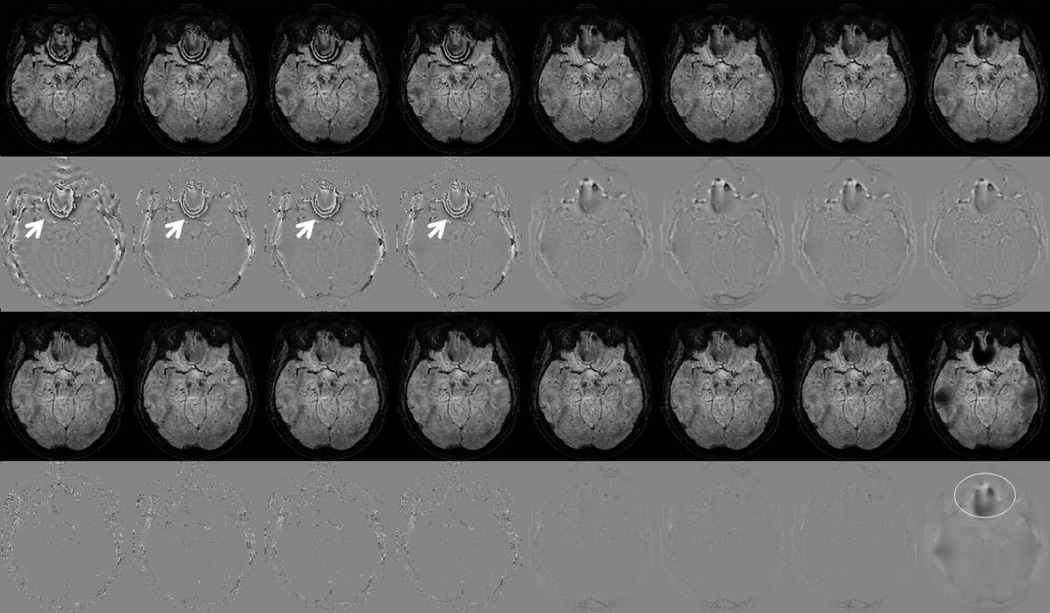
Figure 7 shows SWI and associated phase results computed using all phase processing approaches investigated in this paper, including four types of Homodyne filtering and four types of phase unwrapping-LP filtering/smoothing methods. To highlight the differences between different approaches, results from a lower axial brain slice were chosen to display. When using a relatively small filter size (32 pixels for the matrix size 512 × 512 pixels), all Homodyne filtering methods are subject to phase errors. Such errors came from the residual phase wraps in the processed phase images, highlighted by white arrows in Figure 7 row 2. Under the same circumstances, phase unwrapping prior to HP filtering reduces or eliminates phase errors from residual phase wraps. When using a larger filter size (80 pixels for the matrix size 512 × 512 pixels), all filtering approaches performed similarly, but with lower image contrast compared to the results using smaller filter size. For the phase unwrapping-smoothing approach, a larger smoothing factor corresponds to higher image contrast, though the remaining background gradients may be present when the smoothing factor is too large (51 pixels in this case).
Figure 7.
SWI(row 1,3) and corresponding processed phase(row 2,4) images. Each column represents a different phase processing approaches, from left to right are: Homodyne-rectangular filtering, Homodyne-Gaussian filtering, Homodyne-Hanning filtering, Homodyne-Hamming filtering, phase unwrapping-Gaussian filtering, phase unwrapping-Hanning filtering, phase unwrapping-Hamming filtering and phase unwrapping-smoothing approaches, respectively. First two rows used filter size/smoothing factor of 32/21 pixels. Bottom two rows used filter size/smoothing factor of 80/51 pixels. White arrows point residual phase wrap errors. White circle indicates the present of background gradients due to a relatively large smooth factor.
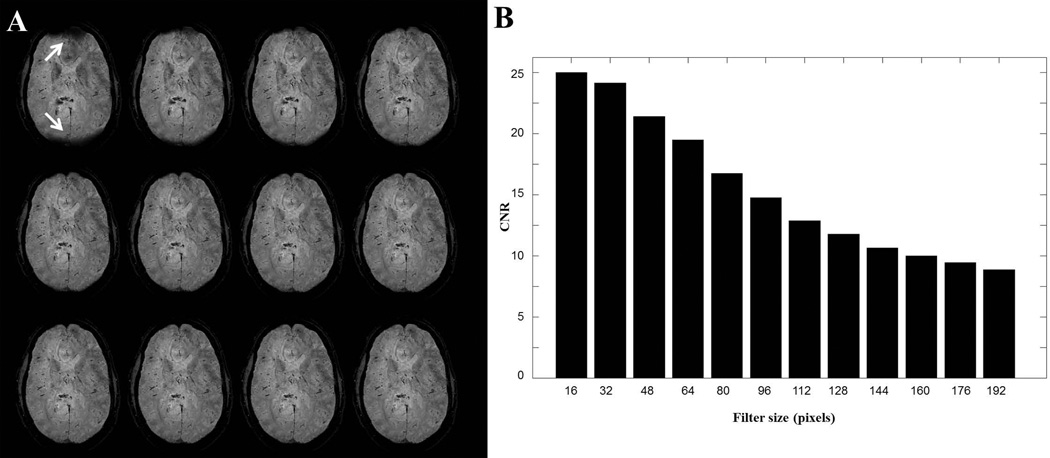
Figure 8A provides a clearer picture of the relationship between image contrasts and filter sizes. A higher axial brain slice processed using phase unwrapping-Gaussian filtering is displayed with different filter sizes varying from 16 pixels to 192 pixels. As the filter size gradually becomes larger, less SWI enhancement was observed. Two ROIs were selected from within vessel areas and the nearby tissue. CNR calculated between the two ROIs is displayed in Figure 8B. As the filter size becomes larger, significant drops of CNR occur. It should be noted that filter size selection is a trade-off between high CNR and phase errors for Homodyne-filtering, but is less of an issue for the phase unwrapping-LP filtering approach. Without the phase error concerns, a smaller filter size always corresponds to higher image contrast in the phase-unwrapping-HP filtering approach.
Figure 8.
A, SWI images for a higher axial brain slice using phase unwrapping-Gaussian filtering. From upper left image to bottom right image, filter size were [16 32 48 64 80 96 112 128 144 160 176 192] pixels. When filter size was too small (16 pixel for this case), incomplete removal of background gradients left dark areas, pointing by white arrows in the upper left image. B, CNR between vessels and nearby tissue decreases in SWI images as the filter size increases in A.
Preserving high CNR is critical for radiologists. More importantly, the brain volume should appear complete. However, the Homodyne filtering approaches often result in residual phase errors due to the relatively inhomogeneous field at lower brain portions. Phase errors can lead to masking portions of the brain. Figure 9 demonstrates the percentage of masked brain regions computed using the method described in the Methods section. A filter size of 32 pixels and a smoothing factor of 17 pixels were used. The percentages of masked brain regions are larger at lower brain slices compared to the middle brain slices for the Homodyne-filtering approaches. Small increases in the percentage were observed for the higher brain slices, which may be due to the enlarged air-filled skull space. All phase unwrapping-filtering/smoothing approaches demonstrated relatively small masked brain percentages compared to the Homodyne-filtering approaches.
Figure 9.
Masked brain percentage due to phase errors for the whole brain volume SWI images. HR, HG, HA, HM, UG, UA, UM and US indicates Homodyne-rectangular filtering, Homodyne-Gaussian filtering, Homodyne-Hanning filtering, Homodyne-Hamming filtering, phase unwrapping-Gaussian filtering, phase unwrapping-Hanning filtering, phase unwrapping-Hamming filtering and phase unwrapping-smoothing approaches, respectively.
DISCUSSION
Commonly used SWI post-processing approaches were evaluated and compared in this paper. Homodyne filtering is computationally convenient, but may yield artifacts at regions where phase wraps are extensive. Selecting a large filter size can reduce such artifacts, but also decrease the susceptibility contrast that SWI aims to enhance. The alternative phase unwrapping-HP filtering approach achieves high image contrast without residual phase wraps artifacts, at the cost of additional computations.
Each of the four tested phase unwrapping approaches has its own pros and cons over the others. The Fourier approach is completely automatic and fast. It unwraps a 512 × 512 × 144 volume in less than 30 seconds. However, the mathematical computations yield numerically inaccurate results, in which the difference between unwrapped phase and wrapped phase is not an integer multiplied of 2π. Rounding the difference divided by 2π partially restores correct unwrapped phase values φuc (9):
| [6] |
However, rounding may not work well when the difference value is halfway between integers. In such situations, additional phase processing may need to be performed. Another issue of the Fourier-based phase unwrapping method is that it imposes periodic image boundary condition, which is generally not realistic (9, 20). Symmetrization of the boundary condition by mirroring the wrapped phase, that is, doubling the image size in each direction, has been suggested (9) at the cost of additional computations and memory demands. Alternatively, shifting and symmetrization of the phase map can be achieved by applying a modulator without increasing the image size (20), avoiding additional computations and memory demands. While low- and mid-frequencies of the unwrapped phase depend on the symmetry of the boundary condition, the high frequencies appear to be less dependent of boundary symmetry. For non-quantitative applications such as SWI, phase masks computed from high-pass filtering the unwrapped phase obtained without considering boundary symmetry appears to be reasonable. On the other hand, the path-following “Goldstein” and Quality-guide phase unwrapping algorithm do not suffer from such problem. They perform phase unwrapping by adding or subtracting integers of 2π values at each pixel, which require much longer computation times as summarized by Table 1. In addition, both methods require a careful selection of a starting seed point, which should have high SNR and be located in a relative uniform phase region. Of these two path-following approaches, the Goldstein method performs much faster, while the Quality-guide method is generally more robust and accurate. The PRELUDE software package is a fully automatic phase unwrapping method that does not require choosing a starting point. The computation time of it is a little bit longer than the Goldstein approach, but much less than the Quality-guide approach.
Large degrees of field inhomogeneities in our test cases appear at the lower portions of the brain, where the air-tissue interface is present. Field inhomogeneities are associated with large susceptibility effects, which lead to extensive phase wraps at such locations. Homodyne filtering fails to perform well at these regions with either residual phase errors or low CNR. However, in most MR cases tested in this work, only a few lower axial brain slices exhibit extensive phase wraps. Most of the higher axial brain slices, which are generally of more interest to radiologists, have limited phase wraps.
Performing phase unwrapping prior to filtering or smoothing leads to easier selection of the filter size or smoothing factor. Although in theory the optimal filter size can be as small as a single pixel to attain high CNR, it should be large enough to remove the background gradients. As shown in the in vivo data exam, the best results for phase unwrapping-Gaussian filtering used a filter size of 48 pixels for a matrix size of 512 × 512, where CNR is highest among all cases without the presence of background gradients. It should be noted that the CNR computation may be inaccurate when the remaining background gradients obscured the ROIs. When ignoring the phase errors, Homodyne approaches yield similar CNR compared to the phase unwrapping-HP approaches using the same filter size.
Four types of filters were tested in this paper. With the same filter size, the hard transitional filter (rectangular) yielded more errors than smooth transitional filters (Gaussian, Hanning and Hamming). This may be due to the sharp frequency cut off using the rectangular filter. The smooth transitional filters performed similarly among each other. When forcing them to have the same FWHM, the frequency roll off rate is quite close to each other. It is expected when the roll off rate is different, the results would look different. Comparison across profiles of four LP filters shows that the Hanning filter covers less low frequency area compared to Gaussian and Hamming filter. The simulation results suggest that Hanning filter yielded more phase errors than Gaussian and Hamming filter.
There are several limitations in both the simulations and in vivo studies. To simulate real phase wraps, parabolic scalar fields were applied to the wrap-free phase acquired with a short TE time. These fields were designed with large vertical variations resulting in more phase wraps in the posterior and anterior areas of an axial acquisition. Although this design mimics the large susceptibility effect due to air-tissue interfaces particularly around the sinuses, real phase can wrap in any direction. Because our investigation focused on the residual phase wraps errors resulting from Homodyne-filtering, this simplified model was enough to demonstrate such errors. A further limitation in this study is the comparison of the in vivoresults. While the Hanning, Gaussian and Hamming filters were performed in the Fourier domain, the spatial smoothing was implemented in the spatial domain. The CNR and masked brain percentage comparisons among filtering and the spatial smoothing approaches may not be strictly equivalent across techniques. Nevertheless, all studies were performed as the re-implementation of previously proposed methods and some insight was gained as to their differences.
In conclusion, SWI post-processing methods were compared in terms of phase unwrapping approach, filter type, and filter size. Comparison was characterized by CNR, masked brain regions, and the presence of phase errors. The homodyne approach is efficient, but may yield phase errors where the field is relatively inhomogeneous. These artifacts potentially mask out important brain regions and can adversely affect a radiological interpretation. Phase unwrapping approaches are more computationally expensive, but errors from residual phase wraps do not occur. With small filter sizes or large smoothing factors, high image contrast can be achieved using a phase unwrapping-HP filtering approach.
ACKNOWLEDGMENTS
Grant Support:
This work was funded by the Department of Defense and the National Institutes of Health in the Center for Neuroscience and Regenerative Medicine.
REFERENCES
- 1.Haacke EM, Xu Y, Cheng YC, Reichenbach JR. Susceptibility Weighted Imaging (SWI) Magn Reson Med. 2004;52:612–618. doi: 10.1002/mrm.20198. [DOI] [PubMed] [Google Scholar]
- 2.Haacke EM, Mittal S, Wu Z, Neelavalli J, Cheng YC. Susceptibility-weighted imaging: technique aspects and clinical applications, part 1. AJNR Am J Neuroradiol. 2009;30:19–30. doi: 10.3174/ajnr.A1400. [DOI] [PMC free article] [PubMed] [Google Scholar]
- 3.Bejoy T, Sivaraman S, Krishnamoorthy T, et al. Clinical applications of susceptibility weighed MR imaging of the brain - a pictorial review. Neuroradiology. 2008;50:105–116. doi: 10.1007/s00234-007-0316-z. [DOI] [PubMed] [Google Scholar]
- 4.Sehgal V, Delproposto Z, Haccke EM, et al. Clinical applications of neuroimaging with susceptibility-weighted imaging. J Magn Reson Imag. 2005;22:439–450. doi: 10.1002/jmri.20404. [DOI] [PubMed] [Google Scholar]
- 5.Graham JM, Paley MNJ, Grunewald RA, Hoggard N, Griffiths PD. Brain iron deposition in Parkinson's disease images using the PRIME magnetic resonance sequence. Brain. 2000;123:2423–2431. doi: 10.1093/brain/123.12.2423. [DOI] [PubMed] [Google Scholar]
- 6.Noll DC, Nishimura DG, Macovski A. Homodyne detection in magnetic resonance imaging. IEEE TMI. 1991;10:154–63. doi: 10.1109/42.79473. [DOI] [PubMed] [Google Scholar]
- 7.Li N, Wang W-T, Sati P, Pham DL, Butman JA. Proceedings of the 2012 SPIE Medical Imaging conference. Vol. 8317. San Diego: 2012. Quantitative evaluation of phase processing approaches in susceptibility weighted imaging; p. 83171S. [Google Scholar]
- 8.Goldstein RM, Zebker HA, Werner CL. Satellite radar interferometry: Two-dimensional phase unwrapping. Radio Science. 1988;23:713–720. [Google Scholar]
- 9.Schofield MA, Zhu Y. Fast phase unwrapping algorithm for interferometric applications. Optics Letter. 2003;28:1194–1196. doi: 10.1364/ol.28.001194. [DOI] [PubMed] [Google Scholar]
- 10.Jenkinson M. Fast, automated, N-dimensional phase unwrapping algorithm. Magn Reson Med. 2003;49:193–197. doi: 10.1002/mrm.10354. [DOI] [PubMed] [Google Scholar]
- 11.Spottiswoode BS, Zhong X, Hess AT, et al. Tracking myocardial motion from cine DENSE images using spatiotemporal phase unwrapping and temporal fitting. IEEE Transactions on medical imaging. 2007;26:15–30. doi: 10.1109/TMI.2006.884215. [DOI] [PubMed] [Google Scholar]
- 12.Rauscher A, Barth M, Reichenbach JR, Stollberger R, Moser E. Automated unwrapping of MR phase images applied to BOLD MR-Venography at 3 tesla. J Magn Reson Imag. 2003;18:175–180. doi: 10.1002/jmri.10346. [DOI] [PubMed] [Google Scholar]
- 13.Schafer A, Wharton S, Gowland P, Bowtell R. Using magnetic field simulation to study susceptibility-related phase contrast in gradient echo MRI. NeuroImage. 2009;48:126–137. doi: 10.1016/j.neuroimage.2009.05.093. [DOI] [PubMed] [Google Scholar]
- 14.Shumeli K, Zwart JA, Gelderen P, Li T-Q, Dodd SJ, Duyn JH. Magnetic susceptibility mapping of brain tissue in vivo using MRI phase data. Magn Reson Med. 2009;62:1510–1522. doi: 10.1002/mrm.22135. [DOI] [PMC free article] [PubMed] [Google Scholar]
- 15.Rochefort L, Liu T, Kressler B, et al. Quantitative susceptibility map reconstruction from MR phase data using Bayesian regularization: validation and application to brain imaging. Magn Reson Med. 2010;63:194–206. doi: 10.1002/mrm.22187. [DOI] [PubMed] [Google Scholar]
- 16.Schweser F, Deistung A, Lehr BW, Reichenbach JR. Quantitative imaging of intrinsic magnetic tissue properties using MRI signal phase: an approach to in vivo brain iron metabolism? NeuroImage. 2011;54:2789–807. doi: 10.1016/j.neuroimage.2010.10.070. [DOI] [PubMed] [Google Scholar]
- 17.Li W, Wu B, Liu C. Quantitative susceptibility mapping of human brain reflects spatial variation in tissue composition. NeuroImage. 2011;55:1645–1656. doi: 10.1016/j.neuroimage.2010.11.088. [DOI] [PMC free article] [PubMed] [Google Scholar]
- 18.Cody DD. AAPM/RSNA physics tutorial for residents: topics in CT image processing in CT. Radiographics. 2002;22:1255–1268. doi: 10.1148/radiographics.22.5.g02se041255. [DOI] [PubMed] [Google Scholar]
- 19.Brummer ME, Mersereau RM, Eisner RL, Lewine RRJ. Automatic detection of brain contours in MRI data sets. IEEE Transactions on medical imaging. 1993;12:153–166. doi: 10.1109/42.232244. [DOI] [PubMed] [Google Scholar]
- 20.Bagher-Ebadian H, Jiang Q, Ewing JR. A modified Fourier-based phase unwrapping algorithm with an application to MRI venography. J Magn Reson Imag. 2008;27:649–652. doi: 10.1002/jmri.21230. [DOI] [PMC free article] [PubMed] [Google Scholar]


