

Abstract
Ozone (O3) is a criteria air pollutant that is associated with numerous adverse health effects, including altered respiratory immune responses. Despite its deleterious health effects, possible epigenetic mechanisms underlying O3-induced health effects remain understudied. MicroRNAs (miRNAs) are epigenetic regulators of genomic response to environmental insults and unstudied in relationship to O3 inhalation exposure. Our objective was to test whether O3 inhalation exposure significantly alters miRNA expression profiles within the human bronchial airways. Twenty healthy adult human volunteers were exposed to 0.4 ppm O3 for 2 h. Induced sputum samples were collected from each subject 48 h preexposure and 6 h postexposure for evaluation of miRNA expression and markers of inflammation in the airways. Genomewide miRNA expression profiles were evaluated by microarray analysis, and in silico predicted mRNA targets of the O3-responsive miRNAs were identified and validated against previously measured O3-induced changes in mRNA targets. Biological network analysis was performed on the O3-associated miRNAs and mRNA targets to reveal potential associated response signaling and functional enrichment. Expression analysis of the sputum samples revealed that O3 exposure significantly increased the expression levels of 10 miRNAs, namely miR-132, miR-143, miR-145, miR-199a*, miR-199b-5p, miR-222, miR-223, miR-25, miR-424, and miR-582-5p. The miRNAs and their predicted targets were associated with a diverse range of biological functions and disease signatures, noted among them inflammation and immune-related disease. The present study shows that O3 inhalation exposure disrupts select miRNA expression profiles that are associated with inflammatory and immune response signaling. These findings provide novel insight into epigenetic regulation of responses to O3 exposure.
Keywords: air pollution, epigenetics, humans, microRNA, ozone
among the criteria air pollutants, ozone (O3) is of significant concern because it is highly oxidizing and has been associated with many adverse health effects. Following acute exposure in humans, O3 can induce decrements in lung function (22), changes in innate immune cell biology (4, 24), and elevated inflammation in the airways (4, 22), marked by neutrophil influx. O3 is also associated with increased risk of asthma as well as increased risk of infection, especially in children and the elderly (27).
There are a variety of mechanisms involved in the cellular response to air pollutant exposure. Animal models have shown that chronic exposure to air pollutants can produce significant changes in gene expression patterns (8, 15, 18, 28, 44), and in humans changes in transcriptional profiles have been correlated with air pollutant exposure (7, 9, 10, 11, 30, 34, 40, 45). Together, these data show that pollutant-induced changes in gene expression levels have biological importance. There is increasing evidence, however, that the epigenome, referring to elements that occur ”above the genome,“ can play a critical role in mediating cellular responses to environmental exposures (20).
MicroRNAs (miRNAs) are key mediators and posttranscriptional modifiers of gene expression. They comprise a large family of small noncoding RNAs that repress or inhibit gene expression by targeting messenger RNA (mRNA) (16, 31). miRNAs can be found in sputum obtained from the central airways (35, 38), a site where O3 induces a robust inflammatory response and produces changes in immune cell responses following controlled inhalational exposures (5, 17). Although there are known links between miRNA expression changes and air pollutants (19, 37), very few studies have assessed genomewide changes in miRNA expression profiles resulting from air toxicant exposure in vivo. Of the studies that have examined the role of miRNAs in pollutant-induced effects, it appears that pollutants with oxidizing potential have the ability to alter miRNA expression profiles (37). Ozone is a potent oxidizing pollutant and therefore has good potential to alter miRNA expression profiles. We have recently shown that genetics play an important role in determining an individual's airway inflammatory response to O3. Specifically, we also showed that the GSTM1null genotype is a significant modulating factor for the severity and persistence of the airway neutrophil response to O3 (3). We have also identified distinct genomic signatures in inflammatory responsive and nonresponsive individuals to O3 (17).
What is less clear, however, is whether epigenetic mechanisms such as miRNAs are modified following O3 exposure, and in turn what posttranscriptional mRNA targets and biological networks are affected by these changes. In the present study we examine genomewide miRNA expression profiles from sputum samples obtained preexposure and postexposure to O3 in healthy humans and report that O3 disrupts miRNA expression profiles that are linked to inflammation and immune response function. Moreover, individuals defined as inflammatory responsive to O3 have a set of constitutively altered miRNAs not seen in inflammatory nonresponsive individuals.
MATERIALS AND METHODS
Ethics statement.
The study protocol was approved by the Institutional Review Board at the University of North Carolina Medical School in Chapel Hill and the US Environmental Protection Agency (EPA), and informed consent was obtained from all subjects before their participation in the study.
Study subjects.
Twenty healthy nonasthmatic adult subjects aged 18–37 yr, with no history of smoking in the past 10 years, completed the study (Table 1). All subjects underwent a physical examination, a routine blood panel with complete blood cell count, and differential and allergy skin testing for common allergens (cat, cockroach, dust, grass, mite, shellfish, tree, weeds). Subjects were required to have a negative methacholine challenge test result. Female subjects were required to have a negative urine pregnancy test result before challenge, and all volunteers were required to be free of chronic cardiorespiratory disease and no acute respiratory illnesses within the previous 4–6 wk of O3 challenge. All subjects had forced expiratory volume in 1 s (FEV1) and forced vital capacity (FVC) values of 80% or greater of predicted value and FEV1/FVC ratios of 75% or greater of predicted normal value for height and age. All subjects were screened for their ability to provide an adequate induced sputum sample during their training session 48 h prior to exposure and this sample acted as their preexposure baseline. Pre- and postexposure sputum samples were separated by a minimum of 48 h.
Table 1.
Characteristics of the study participants and sputum differential cell counts preexposure and postexposure to ozone
| Subject No. | Age | Sex | Race | BMI | Atopy | % PMN Pre | % PMN Post | % Change in %PMN | % MAC Pre | % MAC Post | % Eos Pre | % Eos Post | % Lym Pre | % Lym Post | % BEC Pre | % BEC Post |
|---|---|---|---|---|---|---|---|---|---|---|---|---|---|---|---|---|
| 1 | 28 | Female | Caucasian | 20.2 | 0 | 46.7 | 66.4 | 42.1 | 52 | 30 | 0 | 0 | 1 | 0 | 1 | 4 |
| 2 | 22 | Female | Caucasian | 20.8 | 0 | 15.3 | 61.8 | 304.1 | 81 | 37 | 0.4 | 0 | 2 | 1 | 1 | 0.6 |
| 3 | 22 | Female | Caucasian | 29.8 | 0 | 10.6 | 70.2 | 565.6 | 88 | 28 | 0 | 0.2 | 1 | 1 | 0 | 0 |
| 4 | 35 | Male | African American | 29.1 | 1 | 78.8 | 87.7 | 11.2 | 19 | 12 | 0.6 | 0.4 | 1 | 0.2 | 0.4 | 0 |
| 5 | 18 | Male | Caucasian | 24.9 | 1 | 71 | 50 | −29.6 | 27 | 48 | 0.8 | 0 | 0.6 | 0.9 | 0.2 | 1 |
| 6 | 22 | Female | Caucasian | 21.8 | 1 | 25.1 | 68.1 | 171.3 | 72 | 30 | 0.2 | 0.3 | 0.7 | 0.6 | 1.6 | 0.9 |
| 7 | 20 | Male | African American | 24.6 | 1 | 68.8 | 71.2 | 3.5 | 29 | 27 | 0 | 0.9 | 0.6 | 0.2 | 1.4 | 1 |
| 8 | 22 | Male | Asian | 17.8 | 1 | 11.6 | 71.9 | 521.7 | 87 | 22 | 0 | 5 | 0.4 | 1.4 | 1.3 | 0 |
| 9 | 21 | Male | Hispanic | 22.5 | 1 | 47.9 | 18 | −62.4 | 44 | 28 | 7 | 51 | 0.2 | 0.4 | 1.3 | 2.7 |
| 10 | 24 | Female | Caucasian | 25.7 | 0 | 36.9 | 64.1 | 73.7 | 59 | 32 | 0 | 0 | 2.2 | 1.6 | 1.8 | 1.9 |
| 11 | 23 | Female | Caucasian | 19.2 | 0 | 63.8 | 66.9 | 4.8 | 35 | 32 | 0.2 | 0.2 | 0.4 | 1.1 | 0.9 | 0 |
| 12 | 22 | Male | African American | 25.9 | 1 | 54.1 | 78.4 | 44.9 | 37 | 18 | 2.7 | 2.9 | 0.6 | 0.2 | 5 | 0 |
| 13 | 37 | Male | Caucasian | 27.3 | 0 | 30.3 | 60.4 | 99.5 | 67 | 38 | 0 | 0 | 2.3 | 0.2 | 0.4 | 0.6 |
| 14 | 37 | Female | Caucasian | 25.4 | 0 | 52.2 | 71.8 | 37.5 | 41 | 26 | 0 | 0.4 | 0.2 | 0 | 7 | 1 |
| 15 | 35 | Female | African American | 25 | 0 | 24.3 | 89.8 | 270.2 | 74 | 10 | 0.2 | 0 | 0.2 | 0 | 1.3 | 0.2 |
| 16 | 21 | Female | Caucasian | 27 | 0 | 32.8 | 26.4 | −19.5 | 66 | 70 | 0.2 | 0.2 | 0.2 | 1.8 | 0.7 | 1 |
| 17 | 29 | Female | African American | 38.3 | 1 | 20.5 | 49.8 | 142.6 | 77 | 47 | 0.3 | 0.6 | 0 | 0.4 | 2.6 | 2.3 |
| 18 | 29 | Female | African American | 25.2 | 1 | 25.1 | 94 | 275.1 | 74 | 5 | 1 | 0.6 | 0.4 | 0 | 0 | 0 |
| 19 | 33 | Male | Caucasian | 24.3 | 1 | 7.9 | 73.1 | 826.2 | 91 | 26 | 0 | 0.2 | 0.4 | 0 | 0.4 | 0.3 |
| 20 | 21 | Male | Caucasian | 23.6 | 1 | 19.5 | 82 | 319.6 | 77 | 17 | 0.9 | 0.3 | 1.8 | 0.3 | 0.2 | 0.3 |
Pre, before ozone exposure; Post, after ozone exposure; BMI, body mass index; PMN, polymorphonuclear leukocytes; MAC, macrophages; Eos, eosinophils; Lym, lymphocytes; BEC, bronchial epithelial cells. 0 for atopy represents no allergies, 1 represents allergies.
The O3 exposures were conducted in an exposure chamber at the US EPA Human Studies Facility on the campus of the University of North Carolina (Chapel Hill, NC). Each subject was exposed to 0.4 ppm O3 for 2 h while performing four 15-min sessions of intermittent moderate exercise (expiratory minute ventilation, 30–40 l/min) on a treadmill, separated by 15 min of seated rest. Lung function, breath sounds, and vital signs were assessed immediately preexposure and postexposure.
Sputum was obtained 6 h after exposure and processed as previously described (3). Sputum samples were used because O3 preferentially absorbs in the large central airways during exercise, the same region from which sputum samples originate (1). In brief, three 7-min inhalation periods of nebulized hypertonic saline (3, 4, and 5%; UltraNeb 99 ultrasonic nebulizer; DeVilbiss, Jackson, TN) were followed by expectoration of sputum into a sterile specimen cup. Cell-rich ”plug“ material was selected from the raw sample and treated with a dilute (0.1%) solution of dithiothreitol (Sputolysin; Calbiochem, San Diego, CA) in Dulbecco PBS. Aliquots of sputum supernatant were collected and immediately frozen and stored at −80°C for future cytokine measurement, and the cell pellet was analyzed for cell viability (with Trypan blue exclusion stain), total cell count, and a portion for differential leukocyte counts (Hema-Stain-3; Fisher Scientific, Hampton, NH). The remaining cells were treated with 1 ml of TRIzol reagent (Invitrogen Life Technologies, Carlsbad, CA) and frozen at −80°C until RNA extraction. Sputum samples considered acceptable for subsequent processing had a minimum of 75 mg of selected plug material, cell viability greater than 50%, and squamous epithelial cells less than 40%. All sample processing was performed on the same day of collection.
Sample processing.
Small RNAs were isolated from thawed sputum cell pellet samples. Samples were first disrupted and homogenized in the presence of TRIzol (Invitrogen Life Technologies), and RNA was isolated by the standard TRIzol protocol followed by purification by using the miRNeasy kit (Qiagen) according to the supplier's instruction. Extracted RNA was quantified with a Nanodrop 1000 spectrophotometer (Thermo Scientific, Waltham, MA) and its integrity was verified with a 2100 Bioanalyzer (Agilent Technologies, Santa Clara, CA). RNA was labeled and hybridized to the Agilent Human miRNA Microarray (v1.0). This microarray assesses the relative expression levels of 534 miRNAs measured with 11,080 probe sets. Microarray results were extracted by using Agilent Feature Extraction software. Microarray data have been submitted to National Center for Biotechnology Information (NCBI) Gene Expression Omnibus repository (14) and are available under accession number GSE47977.
Microarray analysis.
Microarray data were normalized by quantile normalization and examined for any batch effects. To eliminate background noise, miRNA probes with signal intensities less than the median signal (signal = 45) across all replicates were eliminated from analysis. Differential expression was defined as a significant difference in miRNA levels between preexposure vs. postexposure to O3, where four statistical requirements were set, similar to our previous publications (36, 37): 1) average fold change of ≥1.3 or ≤−1.3 (average postexposure/average preexposure); 2) individual subject fold change of ≥1.3 or ≤−1.3 (postexposure/preexposure) across at least 15 of the 20 subjects; 3) P value < 0.05 (ANOVA); and 4) a false discovery rate-corrected q-value < 0.05. Analysis of variance (ANOVA) P values were calculated by using Partek Genomics Suite software (St. Louis, MO). A mixed model two-way ANOVA (13) was used to compare miRNA expression profiles preexposure vs. postexposure by using subject identification as a random effect, similar to microarray analyses performed in previous investigations (32, 39). To control the rate of false positives, q-values were calculated as the minimum “false positive discovery rate” that can occur when identifying significant hypotheses (41). An additional mixed model analysis of covariance was performed to assess the influence of the following potential covariates: age, atopy, body mass index, sex, and race. Inclusion of the possible covariates in the statistical model did not change the results and were therefore excluded from the model used for the final analysis.
Comparing O3-responsive miRNAs to immune cell type-specific miRNAs.
Sputum samples contain mixed cell populations, with the predominant cell types in healthy volunteers being macrophages/monocytes and neutrophils (26). To assess whether the O3-induced changes in miRNA expression profiles were attributable to changes in the distribution of cell populations and hence a confounding factor, the O3-responsive miRNAs were compared with miRNAs that have been identified as specifically being expressed in certain immune cell populations. Findings from a recent investigation (6) were used in the comparison, where authors performed genomewide miRNA expression profiling for nine human immune cell subsets: neutrophils, eosinophils, monocytes, B cells, natural killer cells, CD4 T cells, CD8 T cells, myeloid dendritic cells, and plasmacytoid dendritic cells (6). Cell type-specific miRNAs were identified as those specifically expressed on one of the evaluated immune cell types (6). This list of immune cell type-specific miRNAs was compared against the miRNAs identified as O3 responsive in this study. To test possible relationships between an immune cell-specific miRNA change in expression and changes in immune cell proportions found in the subjects' sputum samples, a Spearman rank correlation test was performed.
Predicting targets of O3-responsive miRNAs.
To understand the impact of O3-responsive miRNAs on transcript levels, computational predictions of the mRNA targets of the O3-responsive miRNAs were carried out. The Ingenuity Knowledge Database (Ingenuity Systems, Redwood City, CA) was queried for experimentally observed interactions between miRNAs and their mRNA targets. This database included interactions gathered by Ingenuity Systems curators, as well as interactions from two external databases: TarBase and miRecords. TarBase is a database that represents a comprehensive collection of miRNA targets with experimental support. The interactions in TarBase are curated from both disease- and non-disease-related studies that use methods to increase or decrease the expression of a particular miRNA of interest and evaluate its downstream transcriptional effects (33). miRecords is a database of both experimentally validated miRNA targets gathered through the compilation of findings from 2,705 studies, to date (43). The majority of the information in miRecords is gathered from low-throughput experiments that also involve altering the expression levels of particular miRNAs in animal models (43).
Comparing mRNA targets to additional O3-associated transcriptomic databases.
To further substantiate the mRNA targets predicted to be regulated via O3-responsive miRNAs, the mRNAs were compared against two databases evaluating responses to O3 exposure at the transcriptional level in humans. Firstly, we compared our predicted mRNA data to data from our recent study (17) where 140 genes were differentially expressed in human volunteers' sputum samples following O3 exposure. Secondly, an additional transcriptomic database was obtained by querying the Gene Expression Omnibus (GEO) repository for “ozone exposure humans.” A data series (GSE470) was identified representing transcriptional profiles from bronchial epithelial cells collected from humans preexposure (n = 2) and postexposure (n = 2) to O3. To analyze the mRNA microarray results, Affymetrix Human Genome U95 (v2) array data were first normalized by robust multichip average via Partek Genomics Suite software. Differential expression was defined as a significant difference in mRNA levels between exposed vs. unexposed samples, where two statistical requirements were set similar to the miRNA analysis: 1) fold change of ≥1.3 or ≤−1.3 (average postexposure/average preexposure); 2) P value < 0.05 (ANOVA). A multiple test correction filter could not be applied in this analysis because of limited sample size. The genes that met these statistical requirements were compared against the list of mRNA targets predicted as regulated by miRNAs.
Network analysis.
Two biological network analyses were performed to understand the mechanistic responses to O3 inhalation exposure possibly mediated by miRNA regulation. First, O3-responsive miRNAs were overlaid onto a global interaction network. Networks containing miRNA signaling were algorithmically constructed based on connectivity, as enabled through Ingenuity Pathway Analysis (Ingenuity Systems). Significance for each constructed network was evaluated by a modified Fisher's exact test (12). Biological functions and disease signatures within the constructed networks were then identified. Overrepresented functions/diseases were defined as those that contain more targets than expected by chance, as calculated by the right-tailed Fisher's exact test. A second network analysis was performed, in which the predicted mRNA targets of O3-responsive miRNAs were assessed. Interaction networks were constructed in a similar manner, and biological functions and disease signatures within the constructed networks were identified.
In vitro experimentation for qRT-PCR validation.
To validate the miRNA changes identified as associated with O3 exposure, an in vitro model was used involving differentiated monocyte-derived macrophages. Peripheral blood mononuclear cells (PBMC) were isolated from whole blood obtained from healthy nonsmoking human volunteers via a protocol approved by the University of North Carolina School of Medicine Institutional Review Board for Biomedical Research. The PBMC were isolated by using a Lymphoprep gradient (Life Technologies, Carlsbad, CA). Briefly, the whole blood was diluted with an equal volume of PBS (Life Technologies) and a layer of Lymphoprep was pipetted below the diluted whole blood. The whole blood-Lymphoprep preparation was centrifuged at 800 g for 20 min at room temperature with no break. The PBMC interface was aspirated and washed twice with HBSS containing 2 mM EDTA (Cellgro, Manassas, VA) and 0.1% BSA (Sigma-Aldrich, St. Louis, MO) before isolation of monocytes by negative selection by using the Dynabeads Untouched Human Monocytes Kit according to manufacturer instructions (Life Technologies). The isolated monocytes were plated at 0.5 × 10⁵ cells per well on 12-mm Transwell inserts with 0.4-μm pores (Costar, Cambridge, MA) in RPMI 1640 media supplemented with 10% FBS and 1% penicillin-streptomycin (Life Technologies) and containing 50 ng/ml granulocyte-macrophage colony-stimulating factor (GM-CSF) to induce macrophage differentiation (PeproTech, Rocky Hill, NJ). Media containing 50 ng/ml GM-CSF was refreshed after 4 days of culturing, and the monocyte-derived macrophages were used for experiments after 6 days of culturing.
On the day of exposure, the apical medium was removed and the monocyte-derived macrophages were incubated at the air-liquid interface during the exposure to 0.4 ppm O3 or filtered air for 2 h in exposure chambers (80% relative humidity, 5% CO2) operated by the U.S. EPA Environmental Public Health Division. The exposed monocyte-derived macrophages were collected in 1 ml of TRIzol (Life Technologies) for RNA Isolation.
A subset of miRNAs identified as O3 responsive in human sputum samples were tested in this in vitro model. Specifically, miR-145 and miR-199b-5p expression levels were tested in the 2-h exposure samples by real-time reverse transcriptase polymerase chain reaction (qRT-PCR). TaqMan MicroRNA Primer Assays (ID 4427975) for hsa-miR-145 (no. 002278), hsa-miR-199b-5p (no. 000500), and the U6 housekeeping miRNA (no. 001973) were used with the TaqMan Small RNA Assays PCR kit (Applied Biosystems, Carlsbad, CA). The MyCyler Thermal Cycler (Bio-Rad, Hercules, CA) was used for the reverse transcription step, and the Stratagene Mx3005P QPCR System (Agilent Technologies) was used for the real-time amplification step. The resulting RT-PCR cycle times were normalized against the U6 housekeeping miRNA. To test a subset of mRNA targets of O3-associated miRNAs, QuantiTect Primer Assays were used with QuantiTect SYBR Green PCR kits (Qiagen) and the Stratagene Mx3005P QPCR System (Agilent Technologies). Specifically, cyclin D1 (CCND1) (cat. no. QT00495285) and v-myc avian myelocytomatosis viral oncogene homolog (MYC) (cat. no. QT00035406) were evaluated for changes in mRNA expression. Resulting RT-PCR cycle times were normalized against the β-actin housekeeping gene (cat. no. QT00095431). For both miRNA and miRNA analyses, biological duplicate samples were plated in technical duplicate. Fold changes in expression were calculated with ΔΔ cycle time values. Statistical significance was calculated by unpaired t-tests (exposed vs. unexposed).
RESULTS
PMN response to O3.
Differential cell counts were assessed within sputum samples of 20 human volunteers exposed to 0.4 ppm O3 for 2 h. Differential cell count analysis showed that 17 of the 20 subjects had increases in % polymorphonuclear neutrophils (PMN) after exposure to O3. Three of the subjects had decreases in % PMN after O3 exposure (Table 1). When examined in the context of O3 responders and nonresponders, as previously reported by our group (17), 14 subjects could be classified as inflammatory responders and 6 classified as inflammatory nonresponders, where responders were defined as %PMN preexposure − %PMN postexposure ≥12.
O3 disrupts miRNA expression profiles in sputum samples.
Sputum samples collected preexposure and postexposure were assessed for genomewide changes in miRNA expression profiles by use of the Agilent Human miRNA Microarray. Microarray analysis identified 51 probe sets, representing 10 miRNAs, with significantly increased expression levels following O3 exposure (Fig. 1, see Supplemental Table S1; supplemental material for this article is available online at the Journal website). Altered miRNAs were miR-132, miR-143, miR-145, miR-199a*, miR-199b-5p, miR-222, miR-223, miR-25, miR-424, and miR-582-5p. The data were also analyzed in the context of O3 responders (n = 14) and nonresponders (n = 6). We report that, of the 10 miRNAs that were altered after O3 exposure in the present study, three were significantly different at baseline (e.g., preexposure) when classified according to inflammatory responsiveness. Specifically miR-143, miR-145, and miR-199a* all had lower baseline miRNA expression levels in O3 responders (Fig. 1). Inflammatory responsiveness to O3 (i.e., responder status) had no significant modifying effect on the 10 altered miRNAs after O3 exposure.
Fig. 1.
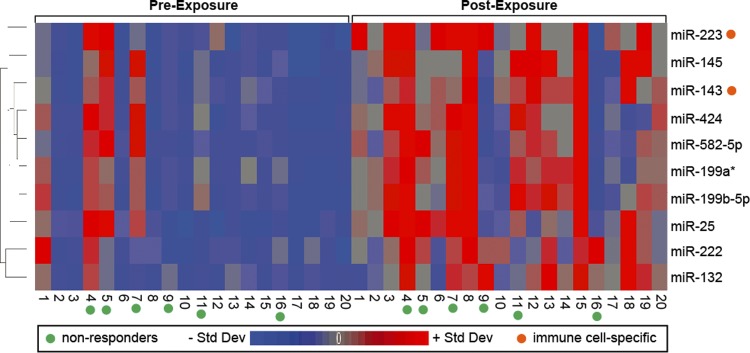
Heat map displaying the relative expression levels of the 10 O3-responsive miRNAs. Expression levels are z-score normalized. Std Dev, standard deviation.
Two O3-responsive miRNAs were immune cell type specific.
Because most of the human volunteers showed increases in % PMN counts after O3 exposure, it was important to evaluate whether the changes in miRNA expression profiles may be linked to changes in immune cell proportion. Two miRNAs were identified as immune cell type-specific (miR-143-neutrophil specific and miR-223-myeloid cell specific) (6) and were consequently excluded from further analysis since their differential expression levels may have resulted from changes in immune cell populations following O3. Consequently, eight miRNAs were left for further examination.
Interestingly, the O3-associated fold change in expression (log2) for the neutrophil-specific miRNA, miR-143, was significantly correlated with the % change in PMN counts (P = 1.49 × 10⁻⁸, R2 = 0.84) (Fig. 2). This finding suggests that miR-143 is predictive of increases in PMN counts and a potential biomarker for changes in PMNs.
Fig. 2.

Correlation between the polymorphonuclear neutrophil (PMN)-specific miRNA, miR-143, expression level changes vs. % change in % PMN in sputum samples.
Network and functional enrichment of O3-responsive miRNAs.
The eight O3-responsive miRNAs that were not immune cell specific were examined for their known roles in the cell and potential for concerted interactions using network analysis (Fig. 3A). Within the identified miRNA network there was an enrichment for 10 diseases/functions, noted among them inflammation and infection-response (Table 2).
Fig. 3.

Network analysis of O3-responsive miRNAs (A) and miRNA-mediated transcript interactome (B).
Table 2.
Ten most significant biological functions and disease signatures associated with O3-responsive miRNAs
| Biological Function/Disease Signature | P Value |
|---|---|
| Inflammatory disease | 2.96E-07 |
| Inflammatory response | 2.96E-07 |
| Cancer | 1.45E-12 |
| Reproductive system disease | 1.45E-12 |
| Gastrointestinal disease | 9.89E-10 |
| Hepatic system disease | 9.89E-10 |
| Endocrine system disorders | 6.00E-08 |
| Digestive system development and function | 2.96E-07 |
| Hepatic system development and function | 2.96E-07 |
| Infectious disease | 2.96E-07 |
Transcriptional targets of O3-responsive miRNAs were predicted.
As mRNA samples were unavailable for the subjects analyzed in the present study, we performed in silico analysis to understand genomic changes likely regulated by the eight O3-responsive miRNAs. Transcriptional targets of the eight O3-responsive miRNAs were predicted by using a database of experimentally observed miRNA-mRNA interactions. Experimental miRNA-mRNA interaction data were not available for one miRNA (miR-582-5p), thus allowing for the final analysis of seven miRNAs. This in silico analysis predicted miR-132 to target 9 mRNAs, miR-145 to target 43 mRNAs, miR-199a* to target 5 mRNAs, miR-199b-5p to target 7 mRNAs, miR-222 to target 21 mRNAs, miR-25 to target 14 mRNAs, and miR-424 to target 178 mRNAs for a total of 277 targets. Since 9 targets overlapped, there were a total of 268 unique mRNA predicted targets (see Supplemental Table S2).
Since seven miRNAs were all increased in expression by O3 exposure, it was predicted that their mRNA targets would show decreased expression. As a form of validation of our predicted analyses, we compared our predicted mRNA data to data from our recent study (17) in which 140 genes were differentially expressed following O3 exposure. A comparison of the 268 predicted mRNA targets reported here with the previously measured 140 genes showed 6 genes to be in common [CCND1, MYC, retinoblastoma 1 (RB1), serpin peptidase inhibitor, clade E (nexin, plasminogen activator inhibitor type 1), member 2 (SERPINE2), superoxide dismutase 2, mitochondrial (SOD2), and thioredoxin 2 (TXN2)] and among them, two changed in the predicted direction (MYC, RB1).
To further assess the transcriptional targets predicted to be regulated by O3-responsive miRNAs, an additional transcriptomic database was obtained through the GEO repository representing transcriptional profiles from bronchial epithelial cells collected from humans preexposure and postexposure to O3. Statistical analysis from this database identified 452 mRNAs associated with O3 exposure, 18 of which were among those predicted here as regulated via O3-responsive miRNAs (see Supplemental Table S3). Of the 18 mRNAs, 12 were altered by O3 exposure in the direction predicted by miRNA regulation: CBFB (core-binding factor, beta subunit), CCND1, E2F3 (E2F transcription factor 3), HBEGF (heparin-binding EGF-like growth factor), JUN (jun proto-oncogene), MECP2 (methyl CpG binding protein 2), MYC, PNP (purine nucleoside phosphorylase), PPIF (peptidylprolyl isomerase F), SLC7A1 [solute carrier family 7 (cationic amino acid transporter, y+ system), member 1], TMEM109 (transmembrane protein 109), and TMEM251 (transmembrane protein 251). Interestingly, CCND1 and MYC were indeed among those predicted to be at decreased expression levels resulting from O3-induced miRNA alterations in the present study as well as that found in the additional GEO-based transcriptomic analysis.
Network and functional enrichment of O3-responsive miRNA targets.
To evaluate the effects of O3-modulated miRNA expression at the systems biology level, networks were constructed with the 268 mRNAs predicted to be regulated by O3-responsive miRNAs. Specifically, 20 significant (P < 10−8) networks were constructed that integrated transcriptional targets (see Supplemental Table S4). These transcripts were predicted to have decreased expression levels resulting from upregulated miRNA mediation. Within these networks, an enrichment for various diseases/functions was identified. Of note, the two most significant functions associated with the mRNA target signaling were cell cycle and cell death/survival (Table 3). Three of the constructed networks contained overlapping signaling molecules, and could thus be combined to construct a miRNA-mediated transcript interactome (Fig. 3B).
Table 3.
Ten most significant biological functions and disease signatures predicted to be regulated by O3-responsive miRNAs
| Biological Function or Disease Signature* | P Value | Number of Inflammation-Associated Transcripts/Total Number of Transcripts | Inflammation-Associated Transcripts |
|---|---|---|---|
| Cell cycle | 1.29E-26 | 33/81 | BCL2, BCL2L11, CCND3, CD44, CDK6, CDKN1A, CDKN1B, ESR1, FGF2, FGFR1, FOS, FOXO3, HBEGF, HIF1A, HMOX1, HSPA1A/HSPA1B, IKZF1, ITGA5, JUN, MDM2, MMP9, MTOR, PPP3CA, PTEN, PTGS2, PURA, RB1, RECK, SIRT1, SOD2, VEGFA, WNT3A, WT1 |
| Cell death and survival | 3.99E-26 | 43/135 | ARHGDIA, BCL2, BCL2L11, BDNF, CARD8, CCND3, CD44, CDK6, CDKN1A, CDKN1B, DDR1, ESR1, FGF2, FGFR1, FOS, FOXO3, HBEGF, HIF1A, HMOX1, HSP90B1, HSPA1A/HSPA1B, ICAM1, IKZF1, ITGA5, JUN, MCL1, MDM2, MMP1, MMP9, MTOR, PPP3CA, PTEN, PTGS2, PURA, RB1, RECK, SIRT1, SOD2, TIA1, TIMP3, VEGFA, WNT3A, WT1 |
| Cancer | 6.58E-26 | 46/167 | ARHGDIA, BCL2, BCL2L11, BDNF, CACNA2D1, CCND3, CD44, CDK6, CDKN1A, CDKN1B, DDR1, ESR1, F11R, FGF2, FGFR1, FOS, FOXO3, H3F3A/H3F3B, HBEGF, HIF1A, HMOX1, HSP90B1, HSPA1A/HSPA1B, ICAM1, IKZF1, ITGA5, JUN, MCL1, MDM2, MMP1, MMP9, MTOR, PPP3CA, PTEN, PTGS2, PURA, RB1, RECK, SIRT1, SLC7A1, SOD2, TIMP3, TJP1, VEGFA, WNT3A, WT1 |
| Cellular development | 4.16E-25 | 43/121 | ARHGDIA, BCL2, BCL2L11, BDNF, CCND3, CD44, CDK6, CDKN1A, CDKN1B, DDR1, ESR1, F11R, FGF2, FGFR1, FOS, FOXO3, HBEGF, HIF1A, HMOX1, HSP90B1, HSPA1A/HSPA1B, ICAM1, IKZF1, ITGA5, JUN, MCL1, MDM2, MMP1, MMP9, MTOR, PPP3CA, PTEN, PTGS2, PURA, RB1, RECK, SIRT1, SOD2, TIMP3, TJP1, VEGFA, WNT3A, WT1 |
| Cellular growth and proliferation | 4.16E-25 | 43/127 | ARHGDIA, BCL2, BCL2L11, BDNF, CCND3, CD44, CDK6, CDKN1A, CDKN1B, DDR1, ESR1, F11R, FGF2, FGFR1, FOS, FOXO3, HBEGF, HIF1A, HMOX1, HSP90B1, HSPA1A/HSPA1B, ICAM1, IKZF1, ITGA5, JUN, MCL1, MDM2, MMP1, MMP9, MTOR, PPP3CA, PTEN, PTGS2, PURA, RB1, RECK, SIRT1, SOD2, TIMP3, TJP1, VEGFA, WNT3A, WT1 |
| Tumor morphology | 4.16E-25 | 36/72 | BCL2, BCL2L11, BDNF, CARD8, CCND3, CD44, CDK6, CDKN1A, CDKN1B, ESR1, FGF2, FGFR1, FOS, FOXO3, HBEGF, HIF1A, HMOX1, HSPA1A/HSPA1B, ICAM1, IKZF1, ITGA5, JUN, MCL1, MDM2, MMP1, MMP9, MTOR, PTEN, PTGS2, RB1, RECK, SIRT1, TIMP3, VEGFA, WNT3A, WT1 |
| Tissue morphology | 3.59E-22 | 42/98 | ARHGDIA, BCL2, BCL2L11, BDNF, CCND3, CD44, CDK6, CDKN1A, CDKN1B, DDR1, ESR1, F11R, FGF2, FGFR1, FOS, FOXO3, HBEGF, HIF1A, HMOX1, HSP90B1, ICAM1, IKZF1, ITGA5, JUN, MCL1, MDM2, MMP9, MTOR, PPP3CA, PTEN, PTGS2, PURA, RB1, RECK, SIRT1, SLC7A1, SOD2, TIA1, TIMP3, VEGFA, WNT3A, WT1 |
| Organismal survival | 3.97E-22 | 42/109 | ARHGDIA, BCL2, BCL2L11, BDNF, CCND3, CD44, CDK6, CDKN1A, CDKN1B, DDR1, ESR1, FGF2, FGFR1, FOS, FOXO3, HBEGF, HIF1A, HMOX1, HSP90B1, HSPA1A/HSPA1B, ICAM1, IKZF1, ITGA5, JUN, MCL1, MDM2, MMP9, MTOR, PPP3CA, PTEN, PTGS2, PURA, RB1, RECK, SIRT1, SLC7A1, SOD2, TIA1, TIMP3, VEGFA, WNT3A, WT1 |
| Hematological system development and function | 1.21E-19 | 42/93 | ARHGDIA, BCL2, BCL2L11, BDNF, CCND3, CD44, CDK6, CDKN1A, CDKN1B, DDR1, ESR1, F11R, FGF2, FGFR1, FOS, FOXO3, HBEGF, HIF1A, HMOX1, HSP90B1, HSPA1A/HSPA1B, ICAM1, IKZF1, ITGA5, JUN, MCL1, MDM2, MMP9, MTOR, PPP3CA, PTEN, PTGS2, PURA, RB1, SIRT1, SLC7A1, SOD2, TIA1, TIMP3, VEGFA, WNT3A, WT1 |
| Cell morphology | 1.55E-19 | 40/102 | ARHGDIA, BCL2, BCL2L11, BDNF, CCND3, CD44, CDK6, CDKN1A, CDKN1B, DDR1, ESR1, F11R, FGF2, FGFR1, FOS, FOXO3, HBEGF, HIF1A, HMOX1, HSPA1A/HSPA1B, ICAM1, IKZF1, ITGA5, JUN, MCL1, MDM2, MMP9, MTOR, PTEN, PURA, RB1, RECK, SIRT1, SLC7A1, SOD2, TIMP3, TJP1, VEGFA, WNT3A, WT1 |
Based on 268 mRNA predicted targets from 7 O3-responsive miRNAs.
In vitro validation of O3 altered miRNAs and mRNA targets.
To validate that O3 alters the expression of miR-145 and miR199b-5p, human monocyte-derived macrophages were exposed in vitro to 0.4 ppm O3 and air for 2 h. Compared with filtered air, we observed modest increased expression of miR-145 and miR-199b-5p following O3, and consequently robust validation for these miRNAs was not achieved. However, two mRNA targets of these miRNAs, namely CCND1 and MYC, showed statistically significant decreased expression (see Supplemental Fig. S1). Additional time points (6 and 24 h) also demonstrated similar trends for CCND1 and MYC expression (data not shown). These in vitro validation data support the effects of O3-induced expression of targets of miR145 and miR199b-5p at the mRNA level.
DISCUSSION
In the present study we set out to investigate the relationship between O3 inhalation exposure and miRNA signaling in human volunteers. To our knowledge, this is the first study to evaluate the effects of O3 exposure on miRNA expression signatures in humans. The majority of subjects responded to a 2-h 0.4 ppm O3 exposure with an expected increase in sputum neutrophils, as well as with changes in immune cell responses previously reported by our group (1, 2, 3, 4, 22, 24). Of the 534 miRNAs examined, we found 10 miRNAs that were significantly altered after O3, and of those eight had known associations with inflammatory signaling (miR-143, miR-145, miR-199a*, miR-199b-5p, miR-222, miR-223, miR-25, miR-424). In particular, miR-223 has been shown to be related to neutrophil hyperactivity (21) and granulocyte development (29), indicating that the airway neutrophil response to O3 could, in part, be influenced by O3-responsive miRNAs within the conducting airways.
We previously demonstrated striking genomic differences after exposure between O3 responders and nonresponders, but surprisingly these genomic differences were not present at preexposure (baseline) (17). Responders did, however, have a primed potential toward PMN influx at baseline because of high preexisting levels of IL-8 (17). Here we demonstrate that, at baseline, O3 responders have lower expression of three miRNAs, namely miR-143, miR-145, and miR-199a*. Interestingly, miR-143 is known to play a role in neutrophil influx (6) and hence may contribute to the constitutively primed airway of responders. These data suggest that interindividual differences in inflammatory responsiveness to O3 may be regulated at the miRNA level.
The cells that are obtained from healthy subjects' sputum represent a mixed leukocyte population containing mostly macrophages and neutrophils. Thus in this study it was important to identify cell-specific miRNAs that could act as potential confounders since some miRNAs are preferentially expressed in certain cell types (6) and O3 exposure caused a significant increase in neutrophils in most of our subjects. A comparison of the 10 O3-responsive miRNAs to a database of immune cell-specific miRNAs (6) showed that miR-143 and miR-223 are immune cell specific and overabundant in neutrophils and myeloid cells. Interestingly, miR-143 expression changes were significantly correlated with % change in PMN counts, suggesting that miR-143 may serve as a biomarker for increases in PMN cell populations. To eliminate the potential for cell-specific bias, we chose to exclude these two miRNAs from further analyses; however, future studies should likely enrich for particular cell types to minimize this potential difficulty.
To understand the functional consequences of miRNA dysregulation, we performed network and functional enrichment analyses on the eight identified O3-responsive miRNAs. Inflammation and immune function were among the most significantly enriched biological functions associated with these miRNAs. In terms of inflammation, miR-223 has neutrophil-specific associations and miR-145 has links to several physiological features of asthma, a group with known susceptibility to the deleterious effects of O3 exposure. In terms of immune response, miR-199b-5p is a direct regulator of the calcineurin/NFAT pathway (42); miR-132 is associated with interferon-stimulated gene expression (23); and miR-434 and miR-25 are regulators of immune cell differentiation (25). Together, these data suggest that alterations in the expression levels of these miRNAs could be responsible for the immune-related responses we have previously reported at the cell surface marker and cell function level in O3-exposed individuals (2, 3). Moreover, the increased expression of these particular miRNAs along with miRNA-223 reveals new insight into possible acquired immune system mechanisms underlying the well-documented inflammatory response that commonly occurs in humans after O3 inhalation exposure.
In silico predictive analysis was used to determine which transcriptional targets would likely be impacted by the observed changes in O3-responsive miRNAs where only experimentally verified interactions were used. We found that many of the transcriptional targets play a role in cell cycle control with known links to airway disease. Altered cell cycle control may be an advantageous mechanism by which human respiratory syncytial virus can promote its own survival in airway epithelial cells. Ozone exposure may indeed contribute to this process since epithelial cells are a key target cell of O3's secondary and tertiary by-products generated in the lung lining fluid layer following inhalation.
As a form of validation of these predicted results, we utilized and compared data from our recent study in 27 adult volunteers that looked at mRNA changes in sputum 5 h following 0.4 ppm O3 exposure. That study showed differential expression in 140 genes (17). We report that there were six genes in common between the predicted mRNA in this study and previously measured mRNA, including MYC and RB1, both of which had changes in the predicted direction. Although the changes in the present study are based on in silico analysis, which contain certain inherent limitations, these validation data give us increased confidence that the altered miRNAs reported here indeed impact the expression of transcripts following exposure to O3.
In the present study, healthy individuals were used to investigate the effects of O3 exposure on miRNA levels. Within these individuals there were demonstrated differences in the magnitude of their inflammatory response to O3. These differences were associated with differences in miRNA expression at baseline. These data suggest that miRNAs may influence interindividual susceptibility to O3 and support inclusion of miRNA evaluation as well as other known genetic risk factors such as the GSTM1null genotype (3), as necessary risk factors to measure to understand the effects of O3 on susceptible populations.
Conclusions.
This study demonstrates that O3 exposure is associated with altered miRNA expression profiles within the human respiratory tract. The identified O3-responsive miRNAs and their targets are notable for their involvement in inflammation and immune cell response. The present study also highlights the role of miRNAs as predictors of interindividual variability in the inflammatory response to O3.
GRANTS
This research was supported in part by NIH grants ES-012796, ES-018417, ES-010126, AT-002620, U19-AI077437, ES019315, ES007018, and EPA Cooperative Agreement CR83346301. Disclaimer: Although the research described in this article has been funded wholly or in part by the United States EPA through cooperative agreement CR833463-01 with the Center for Environmental Medicine, Asthma, and Lung Biology at the University of North Carolina at Chapel Hill, it has not been subjected to the Agency's required peer and policy review and therefore does not necessarily reflect the views of the Agency and no official endorsement should be inferred. Mention of trade names or commercial products does not constitute endorsement or recommendation for use.
DISCLOSURES
No conflicts of interest, financial or otherwise, are declared by the author(s).
AUTHOR CONTRIBUTIONS
R.C.F., I.J., and N.E.A. conception and design of research; R.C.F., J.E.R., R.N.B., E.S., D.B.P., I.J., and N.E.A. analyzed data; R.C.F., J.E.R., R.N.B., E.S., D.B.P., I.J., and N.E.A. interpreted results of experiments; R.C.F., J.E.R., E.S., D.B.P., I.J., and N.E.A. drafted manuscript; R.C.F., J.E.R., R.N.B., E.S., D.B.P., I.J., and N.E.A. edited and revised manuscript; R.C.F., J.E.R., E.S., D.B.P., I.J., and N.E.A. approved final version of manuscript; J.E.R., R.N.B., D.B.P., I.J., and N.E.A. performed experiments; J.E.R. and E.S. prepared figures.
Supplementary Material
ACKNOWLEDGMENTS
The authors acknowledge Heather Wells, Danuta Sujkowska, Lynn Newlin-Clapp, Carol Robinette, Fernando Dimeo, Aline Kalla, Martha Almond, Wenli Zhang, and Margaret Herbst for laboratory and clinical assistance.
REFERENCES
- 1.Alexis N, Urch B, Tarlo S, Corey P, Pengelly D, O'Byrne P, Silverman F. Cyclooxygenase metabolites play a different role in ozone-induced pulmonary function decline in asthmatics compared to normals. Inhal Toxicol 12: 1205–1224, 2000. [DOI] [PubMed] [Google Scholar]
- 2.Alexis NE, Becker S, Bromberg PA, Devlin RB, Peden DB. Circulating cd11b expression correlates with the neutrophil response and airway mcd14 expression is enhanced following ozone exposure in humans. Clin Immunol 111: 126–131, 2004. [DOI] [PubMed] [Google Scholar]
- 3.Alexis NE, Zhou H, Lay JC, Harris B, Hernandez ML, Lu TS, Bromberg PA, Diaz-Sanchez D, Devlin RB, Kleeberger SR, Peden DB. The glutathione-S-transferase mu 1 null genotype modulates ozone-induced airway inflammation in human subjects. J Allergy Clin Immunol 124: 1222–1228, 2009. [DOI] [PMC free article] [PubMed] [Google Scholar]
- 4.Alexis NE, Lay JC, Hazucha M, Harris B, Hernandez ML, Bromberg PA, Kehrl H, Diaz-Sanchez D, Kim C, Devlin RB, Peden DB. Low-level ozone exposure induces airways inflammation and modifies cell surface phenotypes in healthy humans. Inhal Toxicol 22: 593–600, 2010. [DOI] [PMC free article] [PubMed] [Google Scholar]
- 5.Alexis NE, Lay JC, Zhou H, Kim CS, Hernandez ML, Kehrl H, Hazucha MJ, Devlin RB, Diaz-Sanchez D, Peden DB. The glutathione-S-transferase mu 1 (gstm1) null genotype and increased neutrophil response to low-level ozone (0.06 ppm). J Allergy Clin Immunol 131: 610–612, 2013. [DOI] [PMC free article] [PubMed] [Google Scholar]
- 6.Allantaz F, Cheng DT, Bergauer T, Ravindran P, Rossier MF, Ebeling M, Badi L, Reis B, Bitter H, D'Asaro M, Chiappe A, Sridhar S, Pacheco GD, Burczynski ME, Hochstrasser D, Vonderscher J, Matthes T. Expression profiling of human immune cell subsets identifies miRNA-mRNA regulatory relationships correlated with cell type specific expression. PLoS One 7: e29979, 2012. [DOI] [PMC free article] [PubMed] [Google Scholar]
- 7.Baccarelli A, Wright RO, Bollati V, Tarantini L, Litonjua AA, Suh HH, Zanobetti A, Sparrow D, Vokonas PS, Schwartz J. Rapid DNA methylation changes after exposure to traffic particles. Am J Respir Crit Care Med 179: 572–578, 2009. [DOI] [PMC free article] [PubMed] [Google Scholar]
- 8.Belinsky SA, Snow SS, Nikula KJ, Finch GL, Tellez CS, Palmisano WA. Aberrant cpg island methylation of the p16(ink4a) and estrogen receptor genes in rat lung tumors induced by particulate carcinogens. Carcinogenesis 23: 335–339, 2002. [DOI] [PubMed] [Google Scholar]
- 9.Bollati V, Baccarelli A, Hou L, Bonzini M, Fustinoni S, Cavallo D, Byun HM, Jiang J, Marinelli B, Pesatori AC, Bertazzi PA, Yang AS. Changes in DNA methylation patterns in subjects exposed to low-dose benzene. Cancer Res 67: 876–880, 2007. [DOI] [PubMed] [Google Scholar]
- 10.Bollati V, Marinelli B, Apostoli P, Bonzini M, Nordio F, Hoxha M, Pegoraro V, Motta V, Tarantini L, Cantone L, Schwartz J, Bertazzi PA, Baccarelli A. Exposure to metal-rich particulate matter modifies the expression of candidate microRNAs in peripheral blood leukocytes. Environ Health Perspect 118: 763–768, 2010. [DOI] [PMC free article] [PubMed] [Google Scholar]
- 11.Breton CV, Byun HM, Wenten M, Pan F, Yang A, Gilliland FD. Prenatal tobacco smoke exposure affects global and gene-specific DNA methylation. Am J Respir Crit Care Med 180: 462–467, 2009. [DOI] [PMC free article] [PubMed] [Google Scholar]
- 12.Calvano SE, Xiao W, Richards DR, Felciano RM, Baker HV, Cho RJ, Chen RO, Brownstein BH, Cobb JP, Tschoeke SK, Miller-Graziano C, Moldawer LL, Mindrinos MN, Davis RW, Tompkins RG, Lowry SF; Inflamm and Host Response to Injury Large Scale Collab. Res. Program. A network-based analysis of systemic inflammation in humans. Nature 437: 1032–1037, 2005. [DOI] [PubMed] [Google Scholar]
- 13.Downey T. Analysis of a multifactor microarray study using Partek genomics solution. Methods Enzymol 411: 256–270, 2006. [DOI] [PubMed] [Google Scholar]
- 14.Edgar R, Domrachev M, Lash AE. Gene expression omnibus: NCBI gene expression and hybridization array data repository. Nucleic Acids Res 30: 207–210, 2002. [DOI] [PMC free article] [PubMed] [Google Scholar]
- 15.Farraj AK, Hazari MS, Haykal-Coates N, Lamb C, Winsett DW, Ge Y, Ledbetter AD, Carll AP, Bruno M, Ghio A, Costa DL. ST depression, arrhythmia, vagal dominance, and reduced cardiac micro-RNA in particulate-exposed rats. Am J Respir Cell Mol Biol 44: 185–196, 2011. [DOI] [PubMed] [Google Scholar]
- 16.Filipowicz W, Bhattacharyya SN, Sonenberg N. Mechanisms of post-transcriptional regulation by microRNAs: are the answers in sight? Nat Rev Genet 9: 102–114, 2008. [DOI] [PubMed] [Google Scholar]
- 17.Fry RC, Rager JE, Zhou H, Zou B, Brickey JW, Ting J, Lay JC, Peden DB, Alexis NE. Individuals with increased inflammatory response to ozone demonstrate muted signaling of immune cell trafficking pathways. Respir Res 13: 89, 2012. [DOI] [PMC free article] [PubMed] [Google Scholar]
- 18.Izzotti A, Calin GA, Arrigo P, Steele VE, Croce CM, De Flora S. Downregulation of microRNA expression in the lungs of rats exposed to cigarette smoke. FASEB J 23: 806–812, 2009. [DOI] [PMC free article] [PubMed] [Google Scholar]
- 19.Jardim MJ, Fry RC, Jaspers I, Dailey L, Diaz-Sanchez D. Disruption of microRNA expression in human airway cells by diesel exhaust particles is linked to tumorigenesis-associated pathways. Environ Health Perspect 117: 1745–1751, 2009. [DOI] [PMC free article] [PubMed] [Google Scholar]
- 20.Jirtle RL, Skinner MK. Environmental epigenomics and disease susceptibility. Nat Rev Genet 8: 253–262, 2007. [DOI] [PMC free article] [PubMed] [Google Scholar]
- 21.Johnnidis JB, Harris MH, Wheeler RT, Stehling-Sun S, Lam MH, Kirak O, Brummelkamp TR, Fleming MD, Camargo FD. Regulation of progenitor cell proliferation and granulocyte function by miRNA-223. Nature 451: 1125–1129, 2008. [DOI] [PubMed] [Google Scholar]
- 22.Kim CS, Alexis NE, Rappold AG, Kehrl H, Hazucha MJ, Lay JC, Schmitt MT, Case M, Devlin RB, Peden DB, Diaz-Sanchez D. Lung function and inflammatory responses in healthy young adults exposed to 0.06 ppm ozone for 66 h. Am J Respir Crit Care Med 183: 1215–1221, 2011. [DOI] [PMC free article] [PubMed] [Google Scholar]
- 23.Lagos D, Pollar G, Henderson S, Gartrix G, Fabani M, Milne RSB, Gotch F, Boshoff C. Mir-132 regulates antiviral innate immunity through suppression of the p300 transcriptional co-activator. Nat Cell Biol 12: 513–530, 2010. [DOI] [PubMed] [Google Scholar]
- 24.Lay JC, Alexis NE, Kleeberger SR, Roubey RA, Harris BD, Bromberg PA, Hazucha MJ, Devlin RB, Peden DB. Ozone enhances markers of innate immunity and antigen presentation on airway monocytes in healthy individuals. J Allergy Clin Immunol 120: 719–722, 2007. [DOI] [PubMed] [Google Scholar]
- 25.Lindsay MA. MicroRNAs and the immune response. Trends Immunol 29: 343–351, 2008. [DOI] [PubMed] [Google Scholar]
- 26.Lippmann M. Health effects of tropospheric ozone. Environ Sci Technol 25: 1954–1962, 1991. [Google Scholar]
- 27.Lippmann M. Health effects of tropospheric ozone: review of recent research findings and their implications to ambient air quality standards. J Expo Anal Environ Epidemiol 3: 103–129, 1993. [PubMed] [Google Scholar]
- 28.Liu J, Ballaney M, Al-alem U, Quan C, Jin X, Perera F, Chen LC, Miller RL. Combined inhaled diesel exhaust particles and allergen exposure alter methylation of T helper genes and IgE production in vivo. Toxicol Sci 102: 76–81, 2008. [DOI] [PMC free article] [PubMed] [Google Scholar]
- 29.Lu TX, Rothenberg ME. Diagnostic, functional, and therapeutic roles of microRNA in allergic diseases. J Allergy Clin Immunol 132: 3–13, 2013. [DOI] [PMC free article] [PubMed] [Google Scholar]
- 30.Madrigano J, Baccarelli A, Mittleman MA, Wright RO, Sparrow D, Vokonas PS, Tarantini L, Schwartz J. Prolonged exposure to particulate pollution, genes associated with glutathione pathways, and DNA methylation in a cohort of older men. Environ Health Perspect 119: 977–982, 2011. [DOI] [PMC free article] [PubMed] [Google Scholar]
- 31.Mattick JS, Makunin IV. Non-coding RNA. Hum Mol Genet 15: R17–R29, 2006. [DOI] [PubMed] [Google Scholar]
- 32.Ollinger J, Bowen B, Wiedmann M, Boor KJ, Bergholz TM. Listeria monocytogenes sigmaB modulates Prfa-mediated virulence factor expression. Infect Immun 77: 2113–2124, 2009. [DOI] [PMC free article] [PubMed] [Google Scholar]
- 33.Papadopoulos GL, Reczko M, Simossis VA, Sethupathy P, BC, Hatzigeorgiou AG. The database of experimentally supported targets: A functional update of TarBase. Nucleic Acids Res 37: D155–D158, 2009. [DOI] [PMC free article] [PubMed] [Google Scholar]
- 34.Pavanello S, Bollati V, Pesatori AC, Kapka L, Bolognesi C, Bertazzi PA, Baccarelli A. Global and gene-specific promoter methylation changes are related to anti-B[a]PDE-DNA adduct levels and influence micronuclei levels in polycyclic aromatic hydrocarbon-exposed individuals. Int J Cancer 125: 1692–1697, 2009. [DOI] [PubMed] [Google Scholar]
- 35.Pottelberge GR, Mestdagh P, Bracke KR, Thas O, Durme YM, Joos GF, Vandesompele J, Brusselle GG. MicroRNA expression in induced sputum of smokers and patients with chronic obstructive pulmonary disease. Am J Respir Crit Care Med 183: 898–906, 2011. [DOI] [PubMed] [Google Scholar]
- 36.Rager JE, Smeester L, Jaspers I, Sexton KG, Fry RC. Epigenetic changes induced by air toxics: formaldehyde exposure alters miRNA expression profiles in human lung cells. Environ Health Perspect 119: 494–500, 2011. [DOI] [PMC free article] [PubMed] [Google Scholar]
- 37.Rager JE, Moeller BC, Doyle-Eisele M, Kracko D, Swenberg JA, Fry RC. Formaldehyde and epigenetic alterations: microRNA changes in the nasal epithelium of nonhuman primates. Environ Health Perspect 121: 339–344, 2013. [DOI] [PMC free article] [PubMed] [Google Scholar]
- 38.Roa WH, Kim JO, Razzak R, Du H, Guo L, Singh R, Gazala S, Ghosh S, Wong E, Joy AA, Xing JZ, Bedard EL. Sputum microRNA profiling: a novel approach for the early detection of non-small cell lung cancer. Clin Invest Med 35: E271, 2012. [DOI] [PubMed] [Google Scholar]
- 39.Sciuto AM, Phillips CS, Orzolek LD, Hege AI, Moran TS, Dillman JF., 3rd Genomic analysis of murine pulmonary tissue following carbonyl chloride inhalation. Chem Res Toxicol 18: 1654–1660, 2005. [DOI] [PubMed] [Google Scholar]
- 40.Sood A, Petersen H, Blanchette CM, Meek P, Picchi MA, Belinsky SA, Tesfaigzi Y. Wood smoke exposure and gene promoter methylation are associated with increased risk for COPD in smokers. Am J Respir Crit Care Med 182: 1098–1104, 2010. [DOI] [PMC free article] [PubMed] [Google Scholar]
- 41.Storey JD. The positive false discovery rate: a Bayesian interpretation and the q-value. Ann Statist 31: 2013–2035, 2003. [Google Scholar]
- 42.Urbich C, Kuehbacher A, Dimmeler S. Role of microRNAs in vascular diseases, inflammation, and angiogenesis. Cardiovasc Res 79: 581–588, 2008. [DOI] [PubMed] [Google Scholar]
- 43.Xiao F, Zuo Z, Cia G, Kang S, Gao X, Li T. miRecords: an integrated resource for microRNA-target interactions. Nucleic Acids Res 37: D105–D110, 2009. [DOI] [PMC free article] [PubMed] [Google Scholar]
- 44.Yauk C, Polyzos A, Rowan-Carroll A, Somers CM, Godschalk RW, Van Schooten FJ, Berndt ML, Pogribny IP, Koturbash I, Williams A, Douglas GR, Kovalchuk O. Germ-line mutations, DNA damage, and global hypermethylation in mice exposed to particulate air pollution in an urban/industrial location. Proc Natl Acad Sci USA 105: 605–610, 2008. [DOI] [PMC free article] [PubMed] [Google Scholar]
- 45.Zhang AH, Bin HH, Pan XL, Xi XG. Analysis of p16 gene mutation, deletion and methylation in patients with arseniasis produced by indoor unventilated-stove coal usage in Guizhou, China. J Toxicol Environ Health 70: 970–975, 2007. [DOI] [PubMed] [Google Scholar]
Associated Data
This section collects any data citations, data availability statements, or supplementary materials included in this article.