

Abstract
Insulin signaling in the central nervous system (CNS) regulates energy balance and peripheral glucose homeostasis. Rictor is a key regulatory/structural subunit of the mTORC2 complex and is required for hydrophobic motif site phosphorylation of Akt at serine 473. To examine the contribution of neuronal Rictor/mTORC2 signaling to CNS regulation of energy and glucose homeostasis, we utilized Cre-LoxP technology to generate mice lacking Rictor in all neurons, or in either POMC or AgRP expressing neurons. Rictor deletion in all neurons led to increased fat mass and adiposity, glucose intolerance and behavioral leptin resistance. Disrupting Rictor in POMC neurons also caused obesity and hyperphagia, fasting hyperglycemia and pronounced glucose intolerance. AgRP neuron specific deletion did not impact energy balance but led to mild glucose intolerance. Collectively, we show that Rictor/mTORC2 signaling, especially in POMC-expressing neurons, is important for central regulation of energy and glucose homeostasis.
Keywords: Rictor, mTORC2, CNS insulin, POMC neurons, AgRP neurons, Energy balance, Food intake, Obesity
1. Introduction
Mammalian target of rapamycin (mTOR) exists in two functionally distinct multi-protein complexes, mTORC1 and mTORC2, both of which are involved in cell survival, growth and metabolism, but are regulated very differently [1]. The mTORC1 complex is composed of rapamycin-sensitive partner of TOR (Raptor), mLST8, PRAS40, and mTOR and regulates protein synthesis in response to nutrients [2]. Rictor (rapamycin-insensitive companion of TOR) is a component of the mTORC2 complex, composed of mSIN1, mLST8 and mTOR that is required for phosphorylation and activation of AGC kinase family members [3], including Akt (also known as Protein Kinase B), serum/glucocorticoid regulated kinase 1 (SGK1) and protein kinase C α (PKCα) [1]. Akt is a downstream signaling target and mediator of insulin’s glucoregulatory effects in peripheral tissues [4], [5]. Insulin also activates Akt in the central nervous system (CNS), where insulin action is critical for neuroendocrine and homeostatic responses involved in energy balance, hepatic glucose production, hypoglycemic counter-regulation, peripheral fat metabolism, and reproduction [6], [7], [8], [9]. Evidence from rodent models of diet-induced obesity (DIO) suggests that dietary fat exposure is associated with CNS insulin resistance, which may contribute to the development of obesity and diabetes following consumption of a high-fat diet [10], [11], [12].
Neuronal subsets found within the arcuate nucleus express receptors for insulin and the adipocyte hormone leptin, are differentially regulated by these two adiposity signals, and function as primary neurons in distributed neural circuits that control food intake and energy expenditure [13]. Two of the better characterized populations are orexogenic neuropeptide Y (NPY) and agouti-related protein (AgRP) coexpressing neurons [14], [15], and anorexigenic proopiomelanocortin (POMC) and cocaine and amphetamine related transcript (CART) coexpressing neurons [16], [17]. These act as first-order neurons that assimilate and integrate information about adipose stores (long term energy availability) and meal-related signals, in the form of circulating nutrients and hormones, and orchestrate hormonal and autonomic responses via differential regulation of downstream neurons in the hypothalamus, brain stem and other brain regions [18]. Rodent models of DIO rapidly develop CNS resistance to insulin and leptin in response to dietary fat exposure [19], [20], [21], [22]. Mice with genetic mutation of the insulin receptor (IR) or its downstream signaling mediators in the CNS display an obesity phenotype characterized by hyperphagia, increased adiposity, reduced energy expenditure and impaired glucose homeostasis [6], [23], [24].
The specific events involved in insulin signal transduction in hypothalamic neurons are well characterized (reviewed in [25], [26]). For example, insulin binding to IR expressed on the cell surface promotes receptor auto-phosphorylation at intracellular tyrosine residues, resulting in recruitment of downstream effector molecules, including insulin receptor substrate protein 2 (IRS2). IRS2 in turn activates the SH2 (Src-homology 2) domain-containing protein phosphoinositide 3’OH-kinase (PI3K), leading to release of the p110 catalytic subunit and 3’OH phosphorylation of membrane bound phosphoinositol bisphosphate, converting it to phosphatidylinositol (3,4,5) trisphosphate (PIP3) (reviewed in [25]). PI3K can be activated by both insulin and leptin signaling [27], and in response to PI3K activation, Akt is recruited to the plasma membrane through an association between its N-terminal Pleckstrin homology domain and membrane bound PIP3. Akt is phosphorylated by 3’-phosphoinositide-dependent kinase 1 (PDK1) at threonine 308 (T308) within the activation T-loop of the catalytic domain and at serine 473 (S473) on the carboxyl terminal hydrophobic domain by the mTORC2 complex [28], [29]. Once phosphorylated, Akt may translocate to the nucleus, where it phosphorylates and promotes exclusion of forkhead box protein O1 (FOXO1) from the nucleus, resulting in inactivation of FOXO1-dependent target gene regulation [29], [30], [31]. In NPY/AgRP arcuate neurons, Akt-mediated phosphorylation of FOXO1 results in transcriptional inactivation of orexogenic NPY and AgRP gene expression leading to a reduction in food intake [32].
Rictor is required for mTORC2 signaling and Akt activation in a wide variety of tissues and is implicated in cellular and systemic growth and metabolism [5], [33], [34], [35], [36]. Rictor is indispensable for embryonic development and global ablation leads to embryonic lethality at E.11 [37]. Conditional deletion of Rictor in skeletal myocytes, hepatocytes, pancreatic β cells and adipocytes impairs insulin signaling and leads to systemic metabolic defects in glucose and lipid homeostasis [5], [33], [34], [35], [36]. Substantially less is known about mTORC2 signaling and its function in cellular activities in the CNS that underlie complex neurological processes. Rictor has been implicated in monoamine turnover and dopamine signaling within brain regions involved in cognition and reward [38], [39], [40]. Conditional genetic deletion of Rictor in neurons results in behavioral abnormalities, including hyperactivity, decreased anxiety and impaired sensorimotor gaiting [40], suggesting a role for Rictor/mTORC2 signaling in the neurological processing defects that occur in psychiatric and neurodegenerative diseases [39]. Thus, evidence indicates that Rictor/mTORC2 activity is a critical mediator of cellular, tissue and organismal homeostasis, including in the CNS.
The role that Rictor/mTORC2 signaling plays in CNS regulation of energy homeostasis is not known. Here, we hypothesized that Cre-LoxP-mediated neuronal Rictor deletion would, independent of dietary-fat exposure, phenocopy the effects of a high-fat diet, inducing obesity, insulin resistance, and glucose intolerance, to the extent that mTORC2 dysfunction is involved in the development of DIO and diabetes.
2. Methods and materials
2.1. Experimental animals
Neuronal Rictor knockout mice have been described previously [39]. Briefly, Rictorflox/flox mice [37] were crossed with neuronal nestin Cre (Nes-Cre) +/+ mice [41] resulting in F1 generation offspring of the genotype Nes-Cre+/−; Rictor flox/WT (where WT is wild type). Mice lacking Rictor in either POMC neurons or in AgRP neurons were generated by crossing Rictorflox/flox mice with mice homozygous for the Cre recombinase transgene expressed under the control of either the POMC (POMC-Cre) or AgRP (AgRP-Cre) promoter [16]. Double heterozygote male mice were crossed with Rictorflox/flox dams to obtain the following knockout lines: neuronal Rictor knockout (NRic-KO) mice of genotype Nes-Cre +/−; Rictorflox/flox, POMC-specific Rictor knockout (POMC Ric-KO) mice of genotype POMC-Cre +/−; Rictorflox/flox and AgRP-specific knockout (AgRP Ric-KO) mice of genotype AgRP-Cre +/−; Rictorflox/flox and their Cre negative, floxed littermate controls. Male NRic-KO mice were studied from the age of 6–30 weeks of age. POMC Ric-KO and AgRP Ric-KO mice were studied at 8 and 22 weeks of age, as well as 50 weeks of age in the case of POMC Ric-KOs. Genotyping of mice for the “floxed” Rictor allele and respective Cre transgenes was performed by PCR using DNA extracted from tail clippings by the Hot Shot method [42]. All parental mouse lines were backcrossed to C57BL/6 mice for at least 8 generations.
2.2. Animal care
Mice were housed in a temperature (22 °C) and light (12 h light/dark cycle) controlled room with free access to standard laboratory rodent chow diet (#5001, LabDiet; St. Louis, MO) and water except where indicated. All studies were approved by the Vanderbilt University Institutional Animal Care and Use Committee and were conducted in accordance with the Guide for the Care and Use of Laboratory Animals.
2.3. Food intake and body composition analysis
Mice were grouped by genotype and housed 3 to a cage. Body weight was determined once per week, on a standard balance. Body composition was measured by nuclear magnetic resonance (NMR) in a Bruker Body Composition Analyzer (Bruker Optics; Billerica, MA). Adiposity (% body fat) was calculated as ((fat mass/total body weight)×100). Caloric intake (kcal) was determined from bi-weekly measurements of food intake in genotype matched, group housed mice between the ages of 8–30 weeks of age. Feed efficiency is the ratio of weight gained (total body weight, fat and lean), divided by calories consumed (kcal) over the indicated period.
2.4. Behavioral leptin sensitivity
Nine-week-old mice were housed individually and acclimated to intraperitoneal (IP) injections (saline, 300 µl) for 7 days. On the day of the study, food was withdrawn at 2:00 PM and mice were fasted for 4 h. A known quantity of food was placed in the cage at the onset of the dark period (6:00 PM), at which time mice received an IP injection of leptin (5 μg/g body weight) (ProSpec; East Brunswick, NJ) or vehicle (saline, 300 µl). Total caloric intake and caloric intake normalized to body weight were determined for the 24 h period after leptin treatment.
2.5. Indirect calorimetry
Indirect calorimetry was performed to assess energy expenditure in NRic-KO mice at 12 weeks of age, and in POMC Ric-KO mice at 50 weeks of age. Mice were placed into individual Columbus Instruments Comprehensive Lab Animal Monitoring System chambers (Oxymax/CLAMS) (Columbus Instruments; Columbus, Ohio) with free access to food and water. VO2 and VCO2 (mL/h) were measured after a 24 h acclimation period and calculated based on the input and output rates of O2 consumption and CO2 production. The respiratory exchange ratio (RER) (RER=VCO2/VO2) and heat production (kcal/h=(3.815+1.232×RER)×(VO2)) were calculated using software provided by the manufacturer (Columbus Instruments; Columbus, Ohio). Data were normalized to body weight (g) and also lean mass (g) measured by NMR on the day mice were placed in the chambers.
2.6. Glucose tolerance test
Glucose tolerance tests were performed in 9 week-old NRic-KO, and in POMC Ric-KO and AgRP Ric-KO mice at 18 weeks of age. Mice were fasted for 4 h prior to receiving an IP glucose bolus injection (d-glucose, 1 g/kg body weight in 200 μL saline). Blood glucose was measured using a Freestyle handheld glucometer (Abbott Labs; Abbott Park, IL) in blood obtained from a small incision made at the tip of the tail with a sterile razor blade. Readings were made at baseline and 0, 15, 30, 60, 90 and 120 min after glucose was administered.
2.7. Hypothalamic–pituitary–adrenal axis function
Plasma corticosterone levels were assessed as previously described in 18 week-old mice [43]. Mice were housed individually for 7 days prior to sample collection. Blood samples were collected from the submandibular vein (>100 μL) every three days. Nadir samples were collected at 8:00 AM and peak samples were collected three days later at 5:00 PM. Stress induced corticosterone levels were assessed after another 3 day recovery period at the nadir time point, in mice subjected to one minute of mild handling stress. Following handling, mice were returned to their home cages for 30 min prior to sample collection. Plasma corticosterone levels were measured by radioimmunoassay (RIA) as previously described [43].
2.8. Plasma hormones and metabolites
Trunk blood was collected from non-fasted 9 week-old mice and plasma was separated by centrifugation and stored at −80 °C. Plasma concentrations of insulin and leptin were measured by RIA (Hormone Assay & Analytical Services Core, Vanderbilt DRTC). Plasma triglycerides (TG) and free fatty acid (FFA) levels were measured using kits from Waco Diagnostics (Richmond, VA).
2.9. Western blot analysis
Mediobasal hypothalamus dissection was performed as described [44] from 60-week-old NRic-KO and control mice following a 4 h fast. Frozen samples were sonicated in cold TPER buffer (10 μL/mg tissue, Thermo Scientific; Rockford, IL) with added protease and phosphatase inhibitors (Promega; Madison, WI). Protein levels were measured with the Micro BCA Protein Assay Kit (Thermo Scientific; Rockford, IL). For Western Blot analysis, a total of 20 μg of each protein sample was subjected to denaturing electrophoresis on a 4–12% Tris Acetate gel with XT Tricine Running Buffer using the Bio-Rad XT Criterion System (Bio-Rad; Hercules, CA). Protein was transferred to 0.2 μm nitrocellulose (Millipore; Billerica, MA) membranes using the Criterion Blotter module, according to the manufacturer’s instructions (Bio-Rad; Hercules, CA). Membranes were blocked in Blocking Buffer (5% BSA and 0.2% Tween 20) for 1 h at room temperature and incubated overnight with primary antibodies (diluted 1/1000 in blocking buffer) detecting Rictor (Bethyl Laboratories, Inc., #A300-459 A-2; Montgomery, TX), Raptor (Cell Signaling #2280), mTOR (Cell Signaling #2983), phosphorylated Akt (p’Akt) (S473) (Cell Signaling #9271), p’Akt (T308) (Cell Signaling #2965), total Akt (Cell Signaling #4691), p’protein kinase Cα (p’PKCα) (S638) (Santa Cruz #SC-12356) and total PKCα (Santa Cruz #SC-8393). Levels of heat shock cognate protein 70 (HSC70) (Enzo Life Sciences #ADI-SPA-816) were used as a loading control. Membranes were incubated with species-specific horse radish peroxidase-conjugated secondary antibodies (Promega; Madison, WI) in blocking buffer for 1 h at room temperature then washed (3×10 min) in TBS-T (150 mM sodium chloride, 0.1% Tween 20, 20 mM Tris, pH 7.6). Antibody detection was performed with Western Lighting Plus ECL (PerkinElmer; Waltham, MA) and GeneMate Blue Ultra film (BioExpress; Kaysville, UT). Band intensity from X-ray film detection was analyzed by densitometry using ImageJ software from the National Institutes of Health.
2.10. Statistical analysis
Data are reported as group mean±SEM. Statistical analysis of differences was performed using GraphPad Prism version 5.0 for Windows (San Diego, CA). The two-tailed student׳s t-test for non-paired values was used for two group comparisons. Two or more groups were compared using a one-way ANOVA followed by post hoc Tukey׳s multiple comparison test. A p-value <0.05 was considered statistically significant.
3. Results
3.1. Neuronal Rictor deletion impairs hypothalamic Akt and PKCα signaling
The impact of Rictor deletion on hypothalamic mTORC2 function was assessed by Western Blot analysis of hypothalamic protein extracts from NRic-KO and control mice. Conditional neuronal deletion of the floxed Rictor allele lead to an 86% reduction in Rictor protein levels in hypothalamus of NRic-KO mice (Figure 1; p<0.001). Levels of both mTOR and the mTORC1 binding partner Raptor were not altered (Figure 1). Deletion of Rictor led to a 71% reduction in basal Akt phosphorylation at the serine 473 residue (Akt S473) (Figure 1; p<0.001), whereas phosphorylation of Akt at threonine 308 (T308), which is mediated by PDK1, was largely intact in the absence of Rictor (Figure 1). Total levels of Akt protein were not altered in NRic-KO mice (Figure 1). Phosphorylated levels of PKCα, an additional downstream effector of mTORC2 signaling were reduced by 43% in NRic-KO animals (Figure 1; p<0.001) [45]. Additionally, total levels of PKCα protein content were reduced by 70% (Figure 1; p<0.001) in the absence of Rictor protein expression.
Figure 1.
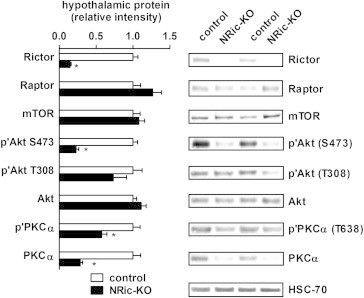
Neuronal Rictor expression is required for hypothalamic Akt and PKCα signaling. Mediobasal hypothalamic total protein extracts from NRic-KO mice and control mice were subjected to Western blot analysis and probed with the indicated primary antibodies. Levels of heat shock cognate protein 70 (HSC70) were determined and used as a loading control. Phosphorylated and total protein levels were determined by densitometry and used to calculate the phosphorylation index of activation for Akt and protein kinase C alpha (PKCα). Values represent the mean±SEM of 6–8 animals of each genotype. ∗ p<0.05.
3.2. Neuronal Rictor deletion reduces lean mass and increases adiposity
At 5 weeks of age, NRic-KO mice were smaller, weighing 37% less than littermate control mice (Figure 2A: control 19.03±0.55 g vs. NRic-KO 11.99±0.52 g, p<0.001). Although noticeably smaller at weaning, NRic-KO mice rapidly gained weight, and eventually attained a normal body weight by 12 weeks of age (Figure 2A). Following the rapid growth phase (5–12 weeks) NRic-KO mice gained body weight and maintained a similar body weight as control mice through 30 weeks of age (Figure 2A). Consistent with lower total weight, lean mass was reduced by 34% in 5-week-old NRic-KO mice (Figure 2B: control 15.77±0.38 g vs. NRic-KO 10.35±0.83 g, p<0.001), which was maintained but to a lesser degree through 30 weeks (Figure 2B: control 20.91±0.38 g vs. NRic-KO 18.72±0.60 g, p<0.05).
Figure 2.
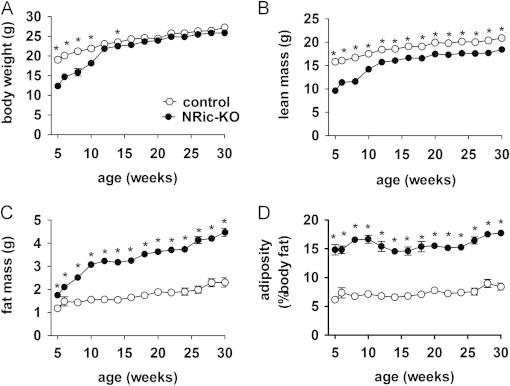
Regulation of body weight and adiposity by neuronal Rictor. (A) Body weight was measured in NRic-KO (filled circles) and control mice (open circles) at the indicated ages, from 5–30 weeks of age. (B) Lean and (C) total body fat mass were determined by NMR. (D) Adiposity (% body fat) was calculated ((fat mass/total body weight)×100). Values represent the mean±SEM of 6–8 animals of each genotype. ∗ p<0.05.
Loss of neuronal Rictor expression led to profound obesity in NRic-KO mice. Despite lower total and lean mass at baseline, fat mass was greater by 1.5-fold in 5-week-old NRic-KO mice (Figure 2C: 1.18±0.09 g vs. NRic-KO 1.75±0.04 g, p<0.001) and was 2.0-fold higher at 30 weeks, relative to control mice (Figure 2C: control 2.31±0.20 g vs. NRic-KO 4.48±0.18 g, p<0.0001). Increased fat mass in the face of lower lean and equivalent total mass, translated to 2.1-fold higher adiposity in NRic-KO animals (% body fat=(fat mass (g)/total body weight (g))×100) (Figure 2D: control 8.47±0.64 vs. NRic-KO 17.75±0.59, p<0.001).
3.3. Neuronal Rictor deletion has little effect on food intake, but enhances weight gain and feed efficiency
Food intake, weight gain and feed efficiency were evaluated in control and NRic-KO mice from 8–30 weeks of age (Figure 3A and B). Consistent with smaller body size, NRic-KO mice consumed fewer calories at 8 weeks of age (Figure 3A: p<0.05). Over the period of 10–15 weeks of age during which NRic-KO mice exhibited rapid weight gain, food intake increased to the level of control mice and remained similar to intake of the control group up to an age of 30 weeks (Figure 3A). Collectively, total food intake was not different during the growth period (8–15 weeks) or steady state period (15–30 weeks) (Figure 3B) resulting in similar cumulative food intake in NRic-KO and control mice over the experimental period of 8–30 weeks of age (Figure 3B).
Figure 3.
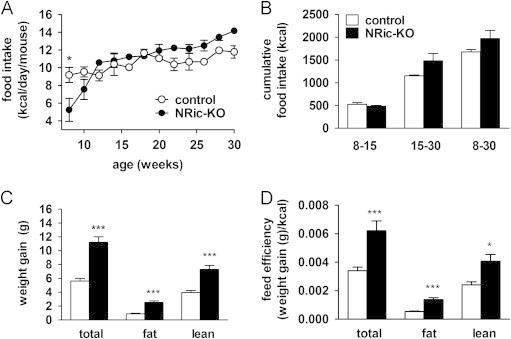
Energy intake and weight gain in NRic-KO mice. (A) Food intake was measured in NRic-KO (filled circles) and control mice (open circles) and is expressed as the average daily intake of genotype matched, group housed mice (2–3 mice/cage). (B) Cumulative food intake (kcal) over 22 weeks (8–30 weeks of age) is shown as well as for young mice (8–15 weeks of age) and adults (15–30 weeks old) (n=3/group). (C) Weight gained between the ages of 8–30 weeks is shown for total body, fat and lean mass by mice of the indicated genotypes. (D) Feed efficiency over the corresponding 22 week period was calculated (change in total body weight, fat or lean mass (g)/(cumulative kcal consumed)) for mice of the indicated genotypes. Values represent the mean±SEM of 6–8 animals of each genotype. ∗∗∗ p<0.001, ∗∗ p<0.01, ∗ p<0.05.
In spite of similar food intake, NRic-KO mice gained 2.0-fold, or 5.6 g more total body weight (Figure 3C: p<0.001) from 8–30 weeks of age. NMR analysis of body composition showed this was due to significant increases in both fat (Figure 3C: p<0.001) and lean mass (Figure 3C: p<0.001). Feed efficiency (change in total body weight, fat or lean mass (g)/(cumulative kcal consumed)) was increased by 1.8-fold for total weight gain in NRic-KO mice (Figure 3D: p<0.01). NRic-KO mice gained 1.7 g, or 2.9-fold, more fat mass (Figure 3C: p<0.001) and 3.4 g, or 1.8-fold, more lean mass (Figure 3C: p<0.001) than control mice. NRic-KO mice were much more efficient at storing calories as fat mass; feed efficiency for conversion of consumed calories to fat mass was increased by 2.6-fold in the absence of neuronal Rictor expression (Figure 3D: p<0.001). The ability to accrue lean mass was elevated by 1.9-fold in NRic-KO mice (Figure 3D: p<0.05). Thus, NRic-KO mice gain more weight despite equivalent food intake, suggesting that lower energy expenditure was a factor associated with excess fat and total weight gain.
3.4. Effects of neuronal Rictor deletion on the respiratory exchange ratio and energy expenditure
Indirect calorimetry was performed when mice were 12-weeks-old to determine if neuronal Rictor deletion influences energy expenditure and macronutrient utilization. During the calorimetry, food intake was similar between NRic-KO and control animals (Figure 4A, Supplemental data, Table 1). Energy expenditure (heat production; kcal/24 h) was reduced by 22% in NRic-KO mice relative to controls (Figure 4B, Supplemental data, Table 1: p<0.001). There were no differences in activity between the groups, in either the light or dark period (Figure 4C, Supplemental data, Table 1). The respiratory exchange ratio (RER) (VCO2/VO2) was significantly decreased in NRic-KO mice in both the light and dark phases (Figure 4D, Supplemental data, Table 1: p<0.01) relative to control mice. To correct for differences in metabolically active lean mass between NRic-KO and control mice, food intake and calorimetry data were normalized to both total body weight and lean mass (Supplemental data, Table 1). Food intake was not different when normalized to body weight although NRic-KO mice exhibited reduced energy expenditure for their body mass, relative to control mice (Supplemental data, Table 1). When corrected for differences in lean mass, NRic-KO compared to control mice consumed more calories (kcal/g lean mass) but had similar energy expenditure per gram lean tissue (Supplemental data, Table 1). Core body temperature was also reduced in NRic-KO relative to control mice (Figure 4E, control 37.00±0.11 °C vs. NRic-KO 36.16±0.22 °C, p<0.01).
Figure 4.
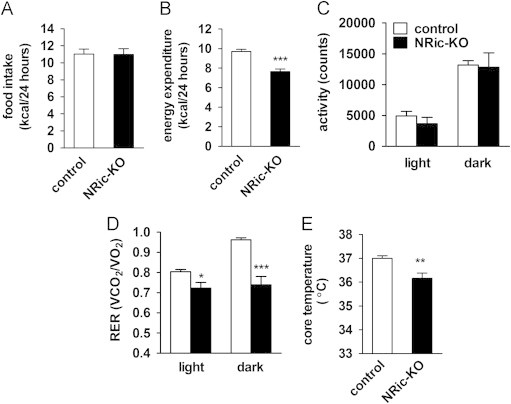
Assessment of energy balance parameters in NRic-KO mice. (A) Daily food intake is illustrated for individually housed, 12-week-old NRic-KO and control mice. (B) Daily energy expenditure was monitored using the Oxymax/CLAMS indirect calorimetry system in 12-week-old mice of the indicated genotypes. (C) Total activity in light and dark periods in mice of the indicated genotypes is depicted. (D) Respiratory exchange ratio (RER) (VCO2/VO2) during the light and dark periods is shown. (E) Core body temperature measured during the light phase in mice of the indicated genotypes. Values represent mean±SEM of 4–5 animals of each genotype. ∗∗∗ p<0.001, ∗∗ p<0.01, ∗ p<0.05.
3.5. Neuronal Rictor KO mice exhibit impaired behavioral leptin sensitivity and elevated hypothalamic orexigenic neuropeptide expression
Increased adiposity in 9-week-old NRic-KO compared to control mice was accompanied by a 3.0-fold elevation in leptin levels (Figure 5A: control 2.26±0.32 ng/mL vs. NRic-KO 6.89±0.88 ng/mL, p<0.001). Because hyperleptinemia is indicative of leptin resistance, we evaluated the behavioral effects of exogenous leptin treatment on food intake over a 24-h period. In order to correct for small differences in body size, we normalized food intake to body weight. Peripheral leptin (5 mg/kg) treatment reduced the amount of food consumed by control mice over the preceding 24-h period by 18% (Figure 5B: p<0.01) but failed to reduce food intake in NRic-KO mice (Figure 5B: p=0.08, n=8-10 mice). Whether food intake was corrected for body weight or not, the NRic-KO mice did not lower food intake in response to leptin, which together with hyperleptinemia, suggests that NRic-KO mice have leptin resistance. While modest, leptin resistance may have resulted directly from mTORC2 dysfunction, or as a result of obesity.
Figure 5.
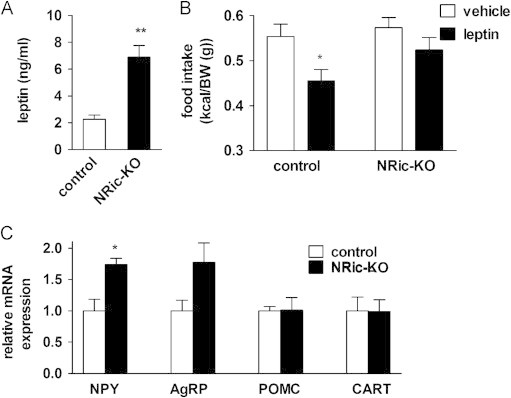
Leptin sensitivity and hypothalamic neuropeptide mRNA expression. (A) Plasma leptin levels of 9-week-old NRic-KO and control mice were measured. (B) Leptin tolerance tests were performed in 9-week-old mice of the indicated genotypes. Following leptin treatment (5 μg/g body weight, IP), food intake was measured in individually housed mice over 24 h and is shown normalized to body weight. (C) Hypothalamic neuropeptide mRNA levels of mice of the indicated genotypes were measured. Target gene mRNA levels were normalized to endogenous RPL13A levels, and then expressed relative to that of the control group. Values represent the mean±SEM of 5–7 animals of each genotype. (A and C) ∗∗ p<0.01, ∗ p<0.05 vs. control or (B) ∗ p<0.05 vs. genotype matched vehicle control.
The PI3K-Akt-FOXO pathway is an important mediator of the transcriptional effects of insulin and leptin on anorectic and orexogenic neuropeptide gene expression in hypothalamic neurons [46], [47], [48]. Real-time PCR analysis of hypothalamic neuropeptide expression in NRic-KO mice revealed a 1.7-fold increase in NPY mRNA levels, relative to controls (Figure 5C; p<0.05), consistent with impaired Akt-FOXO signaling in the absence of Rictor/mTORC2 function [29]. Neuronal deficiency of Rictor did not significantly affect the expression of another orexogenic neuropeptide, AgRP, or the anorexigenic neuropeptides, POMC and CART (Figure 5C).
3.6. Glucose homeostasis, plasma hormone and metabolite levels as well as HPA axis function are altered in NRic-KO mice
Insulin signaling in hypothalamic neuronal populations has been shown to regulate peripheral glucose homeostasis, through effects on insulin secretion and hepatic glucose production [26]. To investigate the role of neuronal Rictor in these effects, we next evaluated the glucodynamic responses of control and NRic-KO animals through an IP glucose tolerance test (IP-GTT). At 9 weeks of age, NRic-KO mice exhibited slight hyperglycemia in the basal, non-fasting state (Figure 6A: control 163.8±4.2 mg/dl vs. NRic-KO 197.8±8.6 mg/dl, p<0.01) despite 1.6-fold greater insulin levels than control mice (Figure 6C: control 0.56±0.04 ng/ml vs. NRic-KO 0.91±0.14 ng/ml, p<0.05). Glucose tolerance was also mildly impaired in NRic-KO mice, resulting in a 25% increase in the area under the curve (AUC) value after a glucose challenge (Figure 6B: p<0.001). Hyperinsulinemia with impaired glucose tolerance suggests that the NRic-KO animals have peripheral insulin resistance.
Figure 6.
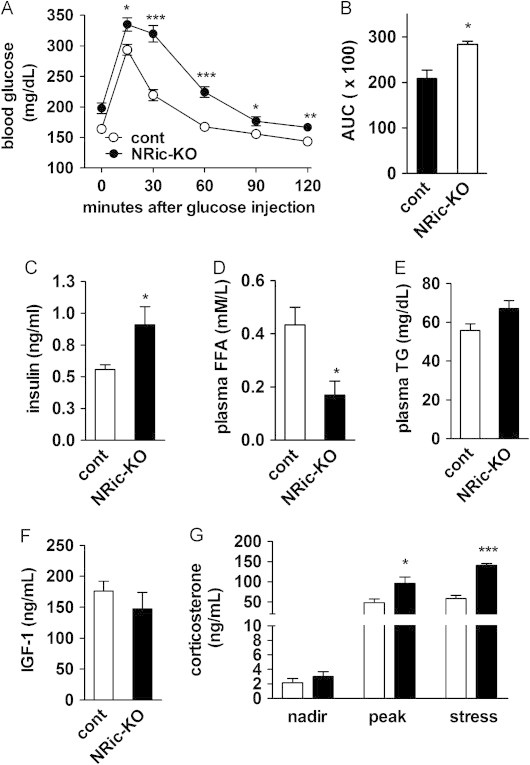
Glucose homeostasis, plasma hormone and metabolite levels as well as HPA axis function in NRic-KO mice. (A) Glucose tolerance tests were performed in 9-week-old NRic-KO (filled circle) and control mice (open circles). (B) Quantitation of area under the glucose curve (AUC) analysis is shown from glucose tolerance testing. (C) Non-fasting plasma insulin, (D) free fatty acid (FFA), and (E) triglyceride (TG) levels of 9-week-old mice of the indicated genotypes were measured. (F) Insulin-like growth factor 1 (IGF-1) levels were measured in 18-week-old mice of the indicated genotypes. (G) Circadian and handling stress induced plasma corticosterone levels of 18-week-old mice of the indicated genotypes were measured. Nadir (8 am), peak (5 pm) and mild handling stress induced samples were collected 3 days apart. Values represent the mean±SEM of 6–8 animals of each genotype. ∗∗∗ p<0.001, ∗∗ p<0.01, ∗ p<0.05.
Circulating concentrations of FFAs, an indirect marker of lipolysis and insulin sensitivity in adipose tissue, were decreased by 60% in NRic-KO mice, relative to control animals (Figure 6D: control 0.43±0.07 mM vs. NRic-KO 0.17±0.05 mM, p<0.05). These lower FFA levels in NRic-KO mice would be predicted given their higher levels of insulin (Figure 6C), if adipose tissue insulin sensitivity was maintained. We also determined triglyceride (TG) levels in plasma of 4-h fasted mice, as an indirect measure of the ability of insulin to repress hepatic triglyceride production [49], [50]. TG levels were not significantly different between control and NRic-KO mice (Figure 6E), despite the higher insulin levels in NRic-KO mice, which suggests some degree of hepatic insulin resistance.
To better understand the causes of drastic differences in body composition and growth in NRic-KO animals, we assessed plasma levels of insulin-like growth factor 1 (IGF-1), a hormone implicated in the maintenance of lean mass, and the stress hormone corticosterone, implicated in glucose intolerance and abdominal obesity. Plasma IGF-1 levels were similar in 12-week-old control and NRic-KO mice (Figure 6F), as were the nadir levels of corticosterone (Figure 6G), but peak corticosterone values were increased by 2.0-fold in NRic-KO mice (Figure 6G: control 47.9±8.8 ng/ml vs. NRic-KO 96.0±15.6 ng/ml, p<0.05). Mice were subjected to mild handling stress to evoke a physiological rise in nadir plasma corticosterone levels. Stress-induced corticosterone levels were 2.4-fold higher in NRic-KO mice, relative to control mice (Figure 6G: control 58.2±8.2 vs. ng/ml vs. NRic-KO 140.6±4.5 ng/ml, p<0.001).
3.7. The role of Rictor in POMC and AgRP hypothalamic neurons
We investigated the specific role of Rictor/mTORC2 signaling in distinct hypothalamic neuronal populations involved in the regulation of energy balance and glucose homeostasis. AgRP Ric-KO and POMC Ric-KO mice were viable and did not display noticeable phenotypic abnormalities. We first evaluated the contributions of POMC and AgRP neurons to the body composition phenotype of NRic-KO mice by comparing body weight, lean and fat mass, and adiposity, of each KO line and control animals at two ages; in young, 8 weeks of age, and then again when these mice were adults, at 22 weeks of age. Body weight, lean mass, fat mass and adiposity of AgRP Ric-KO mice were similar to control levels at 8 and 22 weeks (Figure 7A–D). At 8 weeks, body weight of POMC Ric-KO mice was not different from control mice, however by 22 weeks, POMC Ric-KO mice were 12% heavier than control mice (Figure 7A: p<0.05). Loss of Rictor in POMC neurons did not alter lean mass which was similar to control mice at both time points (Figure 7B). However, fat mass of POMC Ric-KO mice was increased by 1.4-fold at 8 weeks of age and was increased by 2.5-fold at 22 weeks of age (Figure 7C: p<0.05). Higher fat mass but similar lean mass in POMC Ric-KO mice was reflected in a drastic increase in adiposity, which was elevated by 1.4-fold at 8 weeks of age and was increased by 2.0-fold, reaching the level of adiposity in NRic-KO mice, at 22 weeks of age (Figure 7D: p<0.001). Over the study period AgRP Ric-KO mice gained similar amounts of total weight, lean and fat mass as control mice (Figure 7E). POMC Ric-KO mice gained a similar amount of total body weight and lean mass as control mice (Figure 7E), but fat mass gained by POMC Ric-KO was similar to that of NRic-KO mice (Figure 7E). When compared to NRic-KO mice, POMC Ric-KO mice gained a similar amount of fat mass but less lean mass, resulting in lower overall weight gain (Figure 7E).
Figure 7.
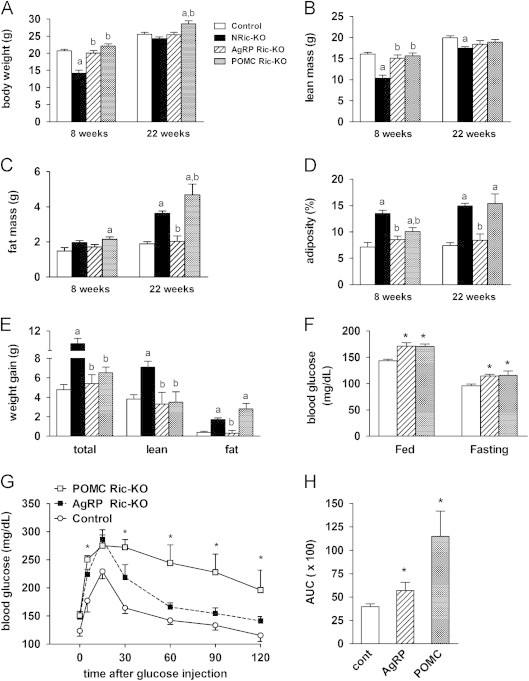
Regulation of adiposity and glucose homeostasis by Rictor in POMC neurons. (A) Body weight, (B) lean mass, (C) fat mass and (D) adiposity (% body fat, calculated as (fat mass/total body weight)×100), and (E) increase in total body, fat and lean mass was measured in NRic-KO, POMC Ric-KO, AgRP Ric-KO and control mice at 8 and 22 weeks of age. (F) Random fed and 24-h fasting blood glucose levels of mice of the indicated genotypes are shown. (G) Glucose tolerance tests were performed in 18-week-old POMC Ric-KO (gray squares), AgRP Ric-KO (black squares) and control mice (open circles). (H) Quantitation of area under the glucose curve (AUC) analysis from glucose tolerance testing is illustrated. Values represent the mean±SEM of 4–8 animals of each genotype. (A–E) The a indicates p<0.05 vs. control and b indicates p<0.05 vs. NRic-KO. (F–H) ∗ indicates p<0.05 vs. control.
Hypothalamic insulin signaling regulates peripheral glucose homeostasis and hepatic glucose production [7]. We next determined if loss of Rictor signaling in either POMC or AgRP neurons contributed to the hyperglycemia and glucose intolerance we observed in NRic-KO animals. Adult AgRP Ric-KO and POMC Ric-KO mice exhibited mild hyperglycemia in both the non-fasted (Figure 7F: p<0.01) and fasting states (Figure 7F: p<0.05). An IP-GTT revealed modest glucose intolerance in AgRP Ric-KO mice resulting in a 1.4-fold increase in the AUC (Figure 7G and H: p<0.05). During the GTT, POMC Ric-KO mice exhibited more profound hyperglycemia, with significantly elevated blood glucose levels 5, 15, 60, 90 and 120 min after glucose was administrated (Figure 7F: p<0.05 for all), resulting in a 2.2-fold elevation in the AUC compared to control mice (Figure 7G: p<0.01).
3.8. Loss of Rictor in POMC neurons leads to hyperphagia and obesity
To evaluate the contribution of Rictor signaling in POMC neurons to the impaired energy balance of NRic-KO mice, we assessed energy intake and expenditure of 50-week-old POMC Ric-KO and control mice using indirect calorimetry. There were no differences in RER values between POMC Ric-KO and control mice, in either the light or dark period (Figure 8A). Energy expenditure (kcal/mouse/day) was not different (Figure 8B), although POMC Ric-KO mice consumed 40% more calories per day than control mice (Figure 8C: p<0.01). Fasting evoked a similar hyperphagic response in both groups; relative to their ad libitum intake, resulting in POMC Ric-KO mice consuming more energy than controls during the refeeding period (Figure 8C: p<0.001). Fasting resulted in similar total weight loss in both groups (Figure 8D); however, POMC Ric-KO mice lost 56% less fat mass than control mice (Figure 8D: p<0.05). Therefore, while energy expenditure was not altered by loss of Rictor in POMC neurons, hyperphagia coupled with a decreased rate of fat loss may contribute to obesity in POMC Ric-KO mice.
Figure 8.
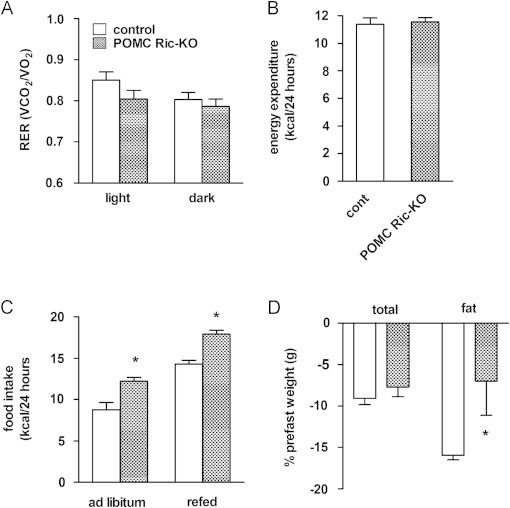
Assessment of energy balance parameters in POMC Ric-KO mice. Fifty-week-old POMC Ric-KO and control mice were monitored for 48 h using Oxymax/CLAMS cages to assess the (A) respiratory exchange ratio (RER) (VCO2/VO2) during the light and dark periods and (B) daily energy expenditure during calorimetry in mice of the indicated genotypes. (C) Food intake of fed and after 24 h of fasting in 50-week-old mice of the indicated genotypes was measured over 24 h. (D) Percentage of total body weight and fat mass lost following a 24-h fast in 50-week-old mice of the indicated genotypes. Values represent the mean±SEM of 4–6 animals per genotype. ∗ p<0.05 vs. control.
4. Discussion
The regulation of energy balance is complex and involves many brain regions and neurobiological systems [51]. Of these, the hypothalamus is involved in the sensing of nutrients, hormones and metabolites that all serve to generate neuronal responses to changes in energy availability [13]. Mediobasal hypothalamic neurons then coordinate, via projections to numerous other brain areas, the regulation of food intake, energy expenditure and glucose homeostasis [52]. Two key long-term regulators of energy balance, the adiposity negative feedback signals, insulin and leptin, signal via a range of intracellular signal transduction mechanisms, including PI3K-Akt and JAK-STAT pathways [8], [27], [53], [54], [55]. We hypothesized herein that defects in Akt activation generated by genetic inactivation of mTORC2 signaling would lead to an obesity phenotype on a chow-diet, similar to high-fat diet-induced obesity, where acquired defects in neuronal sensitivity to adiposity negative feedback signals are hypothesized to have a role in the pathogenesis of weight gain and increased adiposity. Neuronal deletion of Rictor indeed impaired Akt activation and led to a rather remarkable obesity syndrome that shares some features of typical DIO, but is also unique in several aspects. In mice with targeted deletion of Rictor in POMC or AgRP neurons, we also show that Rictor/mTORC2 signaling has divergent roles in these neuronal subsets, in the regulation of energy balance and glucose homeostasis.
4.1. Neuronal Akt activation
Two mTOR kinase complexes, mTORC1 and mTORC2, participate in distinct aspects of insulin signaling. These two mTOR complexes have distinct modes of regulation. Compared to mTORC1, relatively less is known about upstream activators of mTORC2 signaling and its function in cellular processes [1]. Rictor is a key component of the mTORC2 complex that phosphorylates the hydrophobic motif site S473 of Akt in response to insulin and growth factor signaling [56]. We first examined the biochemistry of various signal transduction pathways in mediobasal hypothalamic extracts given that this brain region is notably involved in energy balance regulation [13]. Neuronal deletion of Rictor was sufficient to reduce phosphorylation of the Akt hydrophobic motif site S473 by 75%, while total Akt levels remained unchanged. It is noteworthy that the biochemical signaling changes were observed in the context of hyperinsulinemia and occurred despite normal PDK1-dependent phosphorylation of Akt at T308, in agreement with other Rictor knockout models, where activation of the T308 site is not altered [5], [57]. By inference, our findings suggest that Rictor/mTORC2 mediates full Akt activation.
mTORC2 is also known to couple insulin/growth factor signaling with activation of PKCα, another member of the AGC family of serine/threonine kinases [58], [59]. Rictor regulates cytoskeleton remodeling through PKCα modulation of actin dynamics [28], which has been implicated in the maintenance of dendritic arbor morphology of hippocampal neurons [60] and Purkinje cells [61], as well as hippocampal long-term memory formation [62]. Following neuronal Rictor deletion, phosphorylated as well as total levels of PKCα were drastically reduced within the hypothalamus of NRic-KO mice. This is consistent with reports that Rictor regulates PKCα phosphorylation, protein maturation and stability [45], and agrees with data from other mutant mouse models of neuronal Rictor deletion that exhibit similar alterations in PKCα protein expression levels and activation [40], [61].
4.2. Body weight and body composition
Although NRic-KO mice were initially smaller than controls, they rather rapidly catch up in growth and ultimately maintain a normal body weight. Lean mass remained slightly lower, while fat mass and adiposity were dramatically elevated in adults. Major defects in the growth hormone axis do not appear to play an important role in the phenotype, as IGF-1 levels were not different between the groups. Fuel partitioning can occur through several mechanisms that include alterations in adipose and lean mass metabolism and function. In adipose tissue, fat mass can accumulate due to differences in the rate of uptake of fatty acids from circulating triglycerides in lipoproteins, increased rates of lipogenesis or decreased lipolysis whereby lipid is retained in adipose tissue due to decreased release of stored fatty acids from triglyceride. NRic-KO mice were insulin resistant and exhibited hyperglycemia and hyperinsulinemia; however, levels of circulating FFAs were reduced by 61%, suggesting that insulin sensitivity may be preserved in adipose tissue of NRic-KO mice, despite the development of insulin resistance in other tissues. Reduced FFA levels also raise the possibility that autonomic outflow promoting adipose lipolysis may be impaired in the absence of CNS Rictor/mTORC2 signaling [63].
In many respects the phenotype of NRic-KO mice is comparable to what has been reported for other genetic mouse models of defective neuronal insulin signaling and impaired energy balance regulation. First described by Bruning et al., neuronal insulin receptor knockout (NIRKO) mice exhibit an adiposity phenotype on chow diet and mild, diet-sensitive hyperphagia and obesity [6]. Neuronal IRS2 knockout mice are hyperphagic and develop obesity with elevated body weight, fat mass and adiposity on a normal chow diet [23]. Ultimately, in terms of body composition, a similar increase in adiposity following deletion of IR, IRS2 and Rictor in neurons is consistent with the hypothesis that a reduction of Rictor/mTORC2 activation resulting from these genetic defects in CNS may mediate the effects on accrual and/or maintenance of fat mass.
4.3. Energetics: caloric intake
While initially smaller, NRic-KO animals had daily food intake levels that were similar to controls and cumulative food intake was not different over the entire study period. However, when accounting for lower total body weight and lean mass, the NRic-KO animals consumed more calories than control mice. When weight gain over the entire study is considered, neuronal NRic-KO mice gain more total weight, fat and lean mass per calorie consumed than did the controls. Thus, normalized food intake and feed efficiency were significantly increased in NRic-KO animals, suggestive of reduced energy expenditure. Indeed, indirect calorimetry revealed that NRic-KO animals had significantly lower energy expenditure and reduced body temperature. NIRKO mice also exhibit increased feed efficiency and adiposity on a chow diet [6], while loss of IRS2 in neuronal populations that express the long form of the leptin receptor (LepRb) leads to obesity resulting from hyperphagia and reduced energy expenditure [24].
4.4. Hormone sensitivity and glucodynamics
CNS resistance to adiposity negative feedback signals is thought to be important in the development of obesity. The hyperleptinemia observed in NRic-KO mice was consistent with increased fat mass, which in the setting of similar or slightly elevated food intake, suggests the possibility of leptin resistance. We sought to determine whether genetic impairment in Akt activation would similarly yield leptin resistance, by treating mice that were conditioned to handling and injections with IP leptin and subsequently assessing 24 h food intake. Whereas control animals displayed a reduction in food intake, leptin treatment failed to cause a statistically significant reduction of food intake in NRic-KO mice. The adiposity and hyperleptinemia phenotype resulting from neuronal deletion of Rictor resembles that reported in NIRKO mice [6], likewise following genetic mutation of IRS2 in all neurons [23], or specifically in cells expressing the long form of the leptin receptor (LepRb) [24]. Our results, however, do not discriminate whether rictor deletion directly resulted in modest leptin resistance, or whether the resistance is due to obesity induced by other mechanisms. Chemical inhibition of PI3K signaling in rodents blunts the ability of ICV insulin to reduce food intake and Akt has been implicated in insulin’s ability to modulate feeding [8], [19], [21], [22]. Neuronal rictor animals would, therefore, be a good model in which to determine if insulin has any non-Akt mediated effects on feeding.
The effect of Rictor deletion on leptin sensitivity contrasts with the evidence that mutation of IRS2 does not alter sensitivity to the behavioral effects of exogenous leptin on food intake [23], [24], since both insulin and leptin activate IRS2-PI3K signaling within mediobasal hypothalamic neurons [8], [17]. The effects of CNS insulin and leptin action on regulation of autonomic outflow and peripheral glucose homeostasis are dependent on PI3K-mediated modulation of ATP-sensitive potassium (K+ATP) channels and neuronal firing [64], through a process that also requires cytoskeletal remodeling [55]. More work is needed to determine if leptin resistance is a secondary consequence of the rather profound obesity in this model or if Rictor/mTORC2 signaling, potentially acting through additional AGC kinases such as PKCα, influences leptin sensitivity in neurons.
Hyperinsulinemia in the NRic-KO mice suggests insulin resistance, not surprising in the context of such excess adiposity. We screened glucodynamic responses to an intraperitoneal glucose bolus and observed that NRic-KO animals compared to controls had slightly higher baseline blood glucose and insulin levels, a greater excursion of plasma glucose levels from basal, and a larger AUC for the glucose excursion curve. The degree of glucose intolerance of NRic-KO mice is comparable to what has been reported for neuronal IRS2 KO animals, which exhibit fasting hyperglycemia, hyperinsulinemia and impaired glucose tolerance [23]. Hypothalamic insulin action controls glucose homeostasis via autonomic circuits that regulate insulin secretion and hepatic glucose production [7], [65], [66].
Relative to a role for PI3K-Akt in hypothalamic neurons in adiposity negative feedback and nutrient signaling [8], the obesity observed in NRic-KO animals is generally consistent with what would be expected from neuronal dysfunction in this brain area. Rictor/mTORC2 is required for Akt signaling to FOXO1 [29], which in the unphosphorylated state stimulates transcription of NPY/AgRP gene expression [46]. Thus, loss of Rictor/mTORC2 function would be expected to prevent insulin and/or leptin repression of orexogenic neuropeptide gene expression [20], [32]. Indeed, NPY expression levels were elevated in hypothalami of NRic-KO mice, despite pronounced hyperinsulinemia and hyperleptinemia. An elevation in NPY expression could potentially explain the greater food intake seen, when food intake is normalized to either body weight or lean mass, and the reduction of energy expenditure that was observed in these animals [67], [68], [69]. Elevated levels of hypothalamic NPY expression may also explain the inability of insulin action to suppress hepatic TG [49], [50] and possibly glucose production [70] in NRic-KO mice.
Altered body composition and impaired glucose homeostasis suggested the involvement of endocrine abnormalities in the phenotype of NRic-KO mice. IGF1 levels were not altered in NRic-KO mice indicating that defects in the growth hormone-IGF1 axis cannot explain the phenotypic abnormalities seen in adult mice. Excess fat accumulation, muscle atrophy and metabolic derangements observed in NRic-KO mice may, however, be explained by glucocorticoid excess. Assessment of HPA-axis function revealed that both peak and stress induced corticosterone levels were elevated in NRic-KO mice. The metabolic derangements observed in NRic-KO mice are consistent with the systemic effects of glucocorticoid action to increase hepatic TG [71] and glucose production [72], and promote insulin secretion [73]. Reduced energy expenditure and lower RER, together with decreased body temperature, observed in NRic-KO mice are also consistent with the reported actions of corticosterone to promote preferential oxidation of fat over glucose in muscle [74], while simultaneously decreasing the rate of fat oxidized through non-shivering thermogenesis in brown adipose tissue [75]. Glucocorticoid excess also promotes muscle proteolysis and breakdown [76] and may contribute to muscle atrophy in NRic-KO mice. Disruption of hypothalamic glucocorticoid receptors leads to hyperactivation of the HPA axis and excess adiposity in mice [77], In humans, glucocorticoid excess associated with Cushing’s Disease leads to similar metabolic abnormalities, including visceral adiposity, reduced lean mass and impaired glucose homeostasis [78]. In NRic-KO mice, nadir plasma corticosterone levels were not altered and corticosterone levels exhibited diurnal rhythmicity suggesting that activation of the HPA-axis in response to physiological and/or psychological stress may be augmented, which could culminate in excess glucocorticoid action.
4.5. Targeted deletion of Rictor in POMC and AgRP neurons
Comparing phenotype among the crosses generated, the obesity phenotype resulting from loss of Rictor in all neurons resembles that of deletion in POMC neurons while loss of Rictor in AgRP neurons did not impact energy balance. Similar to the effects of deleting Rictor in all neurons, loss of Rictor only in POMC neurons led to elevated fat mass and adiposity; however, lean mass was not altered in POMC Ric-KO mice. We did not detect differences in energy expenditure, which suggests mild hyperphagia in these mice promotes excess fat mass gain and obesity. POMC Ric-KO mice exhibited a glucose intolerance phenotype that was nearly as severe as NRic-KO animals. Further studies will be required to determine whether Rictor/mTORC2 dysfunction in hypothalamic POMC neurons directly contributes to impaired glucose homeostasis or if glucose intolerance is a secondary consequence of corticosterone excess or the rather profound obesity associated with this model.
Our findings contrast with reports that deletion of IR and IRS2 specifically in POMC expressing neurons does not lead to a discernible energy balance or glucose homeostasis phenotype [23], [79]. A potential explanation for this discrepancy is that the PI3K signaling pathway can be activated by a number of other stimuli including leptin and cytokines [8], [16], [55], [80], [81]. Such non-canonical activation of PI3K-Akt signaling in neurons where IR or IRS2 has been deleted may be sufficient to maintain the function of POMC neurons in the regulation of glucose homeostasis in response to central insulin action in these models. IR-mediated activation of PI3K signaling and subsequent hyperpolarization of POMC neurons may directly influence neuronal sensitivity to the acute effects of leptin on food intake, but it could be less important for the long term regulation of energy balance [82]. Collectively, this evidence together with our findings suggests an important role for Rictor in POMC neurons in the regulation of food intake and glucose homeostasis.
The obesity phenotype of POMC Ric-KO mice does resemble the initial phenotype resulting from ablation of Akt T308 phosphorylation via genetic disruption of PDK1 in POMC neurons; however, POMC PDK1 KO mice exhibit progressive hypocorticosteronemia resulting from loss of POMC-derived adrenocorticotropic hormone (ACTH) gene expression in pituitary corticotropes [31], [83]. Coexpression of transactivation-deficient FOXO1 rescues the obesity phenotype but does not prevent HPA axis dysfunction or correct corticosterone deficiency in POMC-specific PDK1 null mice [31], [83]. We did not observe evidence of hypocorticosteronemia in POMC Ric-KO mice, which displayed pronounced obesity through 50 weeks of age. Furthermore, hypothalamic POMC mRNA levels were not altered and peak and stress induced corticosterone levels were increased, rather than decreased in NRic-KO mice. This evidence suggests divergent, Akt-dependent and Akt-independent roles for Rictor directed mTORC2 and PDK1, within POMC neurons in regulation hypothalamic-pituitary corticotroph and HPA axis function.
Lack of a body composition phenotype in Ric AgRP-KO mice indicates that Rictor is not important for the regulation of energy balance in AgRP neurons. Deletion of PDK1 in AgRP neurons reduces food intake, and leads to reduced body weight, lean mass and lower adiposity [47]. Expression of dominant negative FOXO1 rescues the metabolic phenotype of PDK1 deletion in AgRP neurons but interestingly, this occurs independent of changes in neuropeptide expression [47], potentially consistent with evidence that Rictor is necessary for Akt-FOXO1 signaling [29]. The increase in NPY expression in NRic-KO mice might, therefore, suggest an indirect effect of neuronal Rictor deletion on NPY neurons and NPY expression.
Drastic differences in fat mass and body composition between mice lacking Rictor in all neurons, or in POMC neurons, would be predicted to have implications for glucose homeostasis and insulin sensitivity. Although AgRP-specific deletion of Rictor was not associated with an energy balance phenotype, AgRP Ric-KO mice displayed mild fasting hyperglycemia and slight glucose intolerance. This contrasts with evidence that loss of IRS2 or PDK1 in AgRP neurons does not lead to a discernible glucose homeostasis phenotype [23], [47]. However, the results of our study are consistent with reports that link IR function in AgRP neurons to CNS regulation of hepatic glucose production and glucose homeostasis [79], [84].
4.6. Conclusions
Collectively, our findings reveal Rictor to be important in CNS regulation of energy balance and glucose homeostasis. We observed that loss of Rictor in neurons results in an obesity phenotype that is similar to that observed in NIRKO and neuronal IRS2 KO mice, suggesting Rictor/mTORC2 activation is a point of convergence for IR-IRS2 signaling and potential mediator of neuronal responses to insulin activation of the PI3K signaling pathway on energy homeostasis. Phenotypic differences resulting from targeted CNS deletion of Rictor and those reported following deletion of PDK1 in distinct hypothalamic neuronal subtypes indicates divergent roles for these two Akt kinases, in the regulation of body composition, glucose homeostasis and HPA axis function. A number of phenotypic abnormalities observed in NRic-KO mice can be explained by changes associated with elevated corticosterone and NPY, and these systems may act in concert through a reciprocal positive feedback loop to promote and maintain the observed disturbances in energy and glucose homeostasis [85]. Future exploration of how this signaling molecule and its downstream targets influence cellular signaling networks and neurological circuits involved in energy and glucose homeostasis may led to the identification of novel molecular targets and opportunities for developing effective treatments and therapies for obesity and diabetes.
Acknowledgments
This project was supported by resources of the Tennessee Valley Healthcare System and the National Institutes of Health (DK064857, DK085712) to KDN, the Vanderbilt Diabetes Research and Training Center (DK02059), Molecular Endocrinology (DK07563) and Ruth Kirschstein (DK083222) Training Grants to HEK, Hormone Assay and Analysis Services Core (DK020593 and DK059637), Metabolic Physiology Shared Resource Core (DK020593), the Digestive Diseases Research Center (DK058404), and the Mouse Metabolic Phenotyping Center (DK059637).
Footnotes
Supplementary data associated with this article can be found in the online version at doi:10.1016/j.molmet.2014.01.014.
Conflict of interest
None declared.
Appendix A. Supplementary materials
Supplementary data
References
- 1.Weber J.D., Gutmann D.H. Deconvoluting mTOR biology. Cell Cycle. 2012;11:236–248. doi: 10.4161/cc.11.2.19022. [DOI] [PMC free article] [PubMed] [Google Scholar]
- 2.Sengupta S., Peterson T.R., Sabatini D.M. Regulation of the mTOR complex 1 pathway by nutrients, growth factors, and stress. Molecular Cell. 2010;40:310–322. doi: 10.1016/j.molcel.2010.09.026. [DOI] [PMC free article] [PubMed] [Google Scholar]
- 3.Oh W.J., Jacinto E. mTOR complex 2 signaling and functions. Cell Cycle. 2011;10:2305–2316. doi: 10.4161/cc.10.14.16586. [DOI] [PMC free article] [PubMed] [Google Scholar]
- 4.Bae S.S., Cho H., Mu J., Birnbaum M.J. Isoform-specific regulation of insulin-dependent glucose uptake by Akt/protein kinase B. Journal of Biological Chemistry. 2003;278:49530–49536. doi: 10.1074/jbc.M306782200. [DOI] [PubMed] [Google Scholar]
- 5.Kumar A., Harris T.E., Keller S.R., Choi K.M., Magnuson M.A. Muscle-specific deletion of rictor impairs insulin-stimulated glucose transport and enhances Basal glycogen synthase activity. Molecular and Cellular Biology. 2008;28:61–70. doi: 10.1128/MCB.01405-07. [DOI] [PMC free article] [PubMed] [Google Scholar]
- 6.Bruning J.C., Gautam D., Burks D.J., Gillette J., Schubert M. Role of brain insulin receptor in control of body weight and reproduction. Science. 2000;289:2122–2125. doi: 10.1126/science.289.5487.2122. [DOI] [PubMed] [Google Scholar]
- 7.Obici S., Zhang B.B., Karkanias G., Rossetti L. Hypothalamic insulin signaling is required for inhibition of glucose production. Nature Medicine. 2002;8:1376–1382. doi: 10.1038/nm1202-798. [DOI] [PubMed] [Google Scholar]
- 8.Niswender K.D., Morrison C.D., Clegg D.J., Olson R., Baskin D.G. Insulin activation of phosphatidylinositol 3-kinase in the hypothalamic arcuate nucleus: a key mediator of insulin-induced anorexia. Diabetes. 2003;52:227–231. doi: 10.2337/diabetes.52.2.227. [DOI] [PubMed] [Google Scholar]
- 9.Koch L., Wunderlich F.T., Seibler J., Konner A.C., Hampel B. Central insulin action regulates peripheral glucose and fat metabolism in mice. Journal of Clinical Investigation. 2008;118:2132–2147. doi: 10.1172/JCI31073. [DOI] [PMC free article] [PubMed] [Google Scholar]
- 10.Heymsfield S.B., Greenberg A.S., Fujioka K., Dixon R.M., Kushner R. Recombinant leptin for weight loss in obese and lean adults: a randomized, controlled, dose-escalation trial. Journal of the American Medical Association. 1999;282:1568–1575. doi: 10.1001/jama.282.16.1568. [DOI] [PubMed] [Google Scholar]
- 11.Cheng A., Uetani N., Simoncic P.D., Chaubey V.P., Lee-Loy A. Attenuation of leptin action and regulation of obesity by protein tyrosine phosphatase 1B. Developmental Cell. 2002;2:497–503. doi: 10.1016/s1534-5807(02)00149-1. [DOI] [PubMed] [Google Scholar]
- 12.Munzberg H., Flier J.S., Bjorbaek C. Region-specific leptin resistance within the hypothalamus of diet-induced obese mice. Endocrinology. 2004;145:4880–4889. doi: 10.1210/en.2004-0726. [DOI] [PubMed] [Google Scholar]
- 13.Schwartz M.W., Woods S.C., Porte D., Jr., Seeley R.J., Baskin D.G. Central nervous system control of food intake. Nature. 2000;404:661–671. doi: 10.1038/35007534. [DOI] [PubMed] [Google Scholar]
- 14.Schwartz M.W., Erickson J.C., Baskin D.G., Palmiter R.D. Effect of fasting and leptin deficiency on hypothalamic neuropeptide Y gene transcription in vivo revealed by expression of a lacZ reporter gene. Endocrinology. 1998;139:2629–2635. doi: 10.1210/endo.139.5.6000. [DOI] [PubMed] [Google Scholar]
- 15.Hahn T.M., Breininger J.F., Baskin D.G., Schwartz M.W. Coexpression of Agrp and NPY in fasting-activated hypothalamic neurons. Nature Neuroscience. 1998;1:271–272. doi: 10.1038/1082. [DOI] [PubMed] [Google Scholar]
- 16.Xu A.W., Kaelin C.B., Takeda K., Akira S., Schwartz M.W. PI3K integrates the action of insulin and leptin on hypothalamic neurons. Journal of Clinical Investigation. 2005;115:951–958. doi: 10.1172/JCI24301. [DOI] [PMC free article] [PubMed] [Google Scholar]
- 17.Morton G.J., Gelling R.W., Niswender K.D., Morrison C.D., Rhodes C.J. Leptin regulates insulin sensitivity via phosphatidylinositol-3-OH kinase signaling in mediobasal hypothalamic neurons. Cell Metabolism. 2005;2:411–420. doi: 10.1016/j.cmet.2005.10.009. [DOI] [PubMed] [Google Scholar]
- 18.Berthoud H.R. Multiple neural systems controlling food intake and body weight. Neuroscience & Biobehavioral Reviews. 2002;26:393–428. doi: 10.1016/s0149-7634(02)00014-3. [DOI] [PubMed] [Google Scholar]
- 19.De Souza C.T., Araujo E.P., Bordin S., Ashimine R., Zollner R.L. Consumption of a fat-rich diet activates a proinflammatory response and induces insulin resistance in the hypothalamus. Endocrinology. 2005;146:4192–4199. doi: 10.1210/en.2004-1520. [DOI] [PubMed] [Google Scholar]
- 20.Ropelle E.R., Pauli J.R., Prada P., Cintra D.E., Rocha G.Z. Inhibition of hypothalamic Foxo1 expression reduced food intake in diet-induced obesity rats. Journal of Physiology. 2009;587:2341–2351. doi: 10.1113/jphysiol.2009.170050. [DOI] [PMC free article] [PubMed] [Google Scholar]
- 21.Clegg D.J., Gotoh K., Kemp C., Wortman M.D., Benoit S.C. Consumption of a high-fat diet induces central insulin resistance independent of adiposity. Physiology and Behavior. 2011;103:10–16. doi: 10.1016/j.physbeh.2011.01.010. [DOI] [PMC free article] [PubMed] [Google Scholar]
- 22.Posey K.A., Clegg D.J., Printz R.L., Byun J., Morton G.J. Hypothalamic proinflammatory lipid accumulation, inflammation, and insulin resistance in rats fed a high-fat diet. American Journal of Physiology – Endocrinology and Metabolism. 2009;296:E1003–E1012. doi: 10.1152/ajpendo.90377.2008. [DOI] [PMC free article] [PubMed] [Google Scholar]
- 23.Choudhury A.I., Heffron H., Smith M.A., Al-Qassab H., Xu A.W. The role of insulin receptor substrate 2 in hypothalamic and beta cell function. Journal of Clinical Investigation. 2005;115:940–950. doi: 10.1172/JCI24445. [DOI] [PMC free article] [PubMed] [Google Scholar]
- 24.Sadagurski M., Leshan R.L., Patterson C., Rozzo A., Kuznetsova A. IRS2 signaling in LepR-b neurons suppresses FoxO1 to control energy balance independently of leptin action. Cell Metabolism. 2012;15:703–712. doi: 10.1016/j.cmet.2012.04.011. [DOI] [PMC free article] [PubMed] [Google Scholar]
- 25.Niswender K.D., Schwartz M.W. Insulin and leptin revisited: adiposity signals with overlapping physiological and intracellular signaling capabilities. Frontiers in Neuroendocrinology. 2003;24:1–10. doi: 10.1016/s0091-3022(02)00105-x. [DOI] [PubMed] [Google Scholar]
- 26.Plum L., Belgardt B.F., Bruning J.C. Central insulin action in energy and glucose homeostasis. Journal of Clinical Investigation. 2006;116:1761–1766. doi: 10.1172/JCI29063. [DOI] [PMC free article] [PubMed] [Google Scholar]
- 27.Niswender K.D., Gallis B., Blevins J.E., Corson M.A., Schwartz M.W. Immunocytochemical detection of phosphatidylinositol 3-kinase activation by insulin and leptin. Journal of Histochemistry and Cytochemistry. 2003;51:275–283. doi: 10.1177/002215540305100302. [DOI] [PubMed] [Google Scholar]
- 28.Sarbassov D.D., Ali S.M., Kim D.H., Guertin D.A., Latek R.R. Rictor, a novel binding partner of mTOR, defines a rapamycin-insensitive and raptor-independent pathway that regulates the cytoskeleton. Current Biology. 2004;14:1296–1302. doi: 10.1016/j.cub.2004.06.054. [DOI] [PubMed] [Google Scholar]
- 29.Guertin D.A., Stevens D.M., Thoreen C.C., Burds A.A., Kalaany N.Y. Ablation in mice of the mTORC components raptor, rictor, or mLST8 reveals that mTORC2 is required for signaling to Akt-FOXO and PKCalpha, but not S6K1. Developmental Cell. 2006;11:859–871. doi: 10.1016/j.devcel.2006.10.007. [DOI] [PubMed] [Google Scholar]
- 30.Kim M.S., Pak Y.K., Jang P.G., Namkoong C., Choi Y.S. Role of hypothalamic Foxo1 in the regulation of food intake and energy homeostasis. Nature Neuroscience. 2006;9:901–906. doi: 10.1038/nn1731. [DOI] [PubMed] [Google Scholar]
- 31.Belgardt B.F., Husch A., Rother E., Ernst M.B., Wunderlich F.T. PDK1 deficiency in POMC-expressing cells reveals FOXO1-dependent and -independent pathways in control of energy homeostasis and stress response. Cell Metabolism. 2008;7:291–301. doi: 10.1016/j.cmet.2008.01.006. [DOI] [PubMed] [Google Scholar]
- 32.Schwartz M.W., Sipols A.J., Marks J.L., Sanacora G., White J.D. Inhibition of hypothalamic neuropeptide Y gene expression by insulin. Endocrinology. 1992;130:3608–3616. doi: 10.1210/endo.130.6.1597158. [DOI] [PubMed] [Google Scholar]
- 33.Bentzinger C.F., Romanino K., Cloetta D., Lin S., Mascarenhas J.B. Skeletal muscle-specific ablation of raptor, but not of rictor, causes metabolic changes and results in muscle dystrophy. Cell Metabolism. 2008;8:411–424. doi: 10.1016/j.cmet.2008.10.002. [DOI] [PubMed] [Google Scholar]
- 34.Kumar A., Lawrence J.C., Jr., Jung D.Y., Ko H.J., Keller S.R. Fat cell-specific ablation of rictor in mice impairs insulin-regulated fat cell and whole-body glucose and lipid metabolism. Diabetes. 2010;59:1397–1406. doi: 10.2337/db09-1061. [DOI] [PMC free article] [PubMed] [Google Scholar]
- 35.Gu Y., Lindner J., Kumar A., Yuan W., Magnuson M.A. Rictor/mTORC2 is essential for maintaining a balance between beta-cell proliferation and cell size. Diabetes. 2011;60:827–837. doi: 10.2337/db10-1194. [DOI] [PMC free article] [PubMed] [Google Scholar]
- 36.Hagiwara A., Cornu M., Cybulski N., Polak P., Betz C. Hepatic mTORC2 activates glycolysis and lipogenesis through Akt, glucokinase, and SREBP1c. Cell Metabolism. 2012;15:725–738. doi: 10.1016/j.cmet.2012.03.015. [DOI] [PubMed] [Google Scholar]
- 37.Shiota C., Woo J.T., Lindner J., Shelton K.D., Magnuson M.A. Multiallelic disruption of the rictor gene in mice reveals that mTOR complex 2 is essential for fetal growth and viability. Developmental Cell. 2006;11:583–589. doi: 10.1016/j.devcel.2006.08.013. [DOI] [PubMed] [Google Scholar]
- 38.Mazei-Robison M.S., Koo J.W., Friedman A.K., Lansink C.S., Robison A.J. Role for mTOR signaling and neuronal activity in morphine-induced adaptations in ventral tegmental area dopamine neurons. Neuron. 2011;72:977–990. doi: 10.1016/j.neuron.2011.10.012. [DOI] [PMC free article] [PubMed] [Google Scholar]
- 39.Siuta M.A., Robertson S.D., Kocalis H., Saunders C., Gresch P.J. Dysregulation of the norepinephrine transporter sustains cortical hypodopaminergia and schizophrenia-like behaviors in neuronal rictor null mice. PLoS Biology. 2010;8:e1000393. doi: 10.1371/journal.pbio.1000393. [DOI] [PMC free article] [PubMed] [Google Scholar]
- 40.Carson R.P., Fu C., Winzenburger P., Ess K.C. Deletion of Rictor in neural progenitor cells reveals contributions of mTORC2 signaling to tuberous sclerosis complex. Human Molecular Genetics. 2012 doi: 10.1093/hmg/dds414. [DOI] [PMC free article] [PubMed] [Google Scholar]
- 41.Tronche F., Kellendonk C., Kretz O., Gass P., Anlag K. Disruption of the glucocorticoid receptor gene in the nervous system results in reduced anxiety. Nature Genetics. 1999;23:99–103. doi: 10.1038/12703. [DOI] [PubMed] [Google Scholar]
- 42.Truett G.E., Heeger P., Mynatt R.L., Truett A.A., Walker J.A. Preparation of PCR-quality mouse genomic DNA with hot sodium hydroxide and tris (HotSHOT) Biotechniques. 2000;29(52):54. doi: 10.2144/00291bm09. [DOI] [PubMed] [Google Scholar]
- 43.Boyle M.P., Brewer J.A., Funatsu M., Wozniak D.F., Tsien J.Z. Acquired deficit of forebrain glucocorticoid receptor produces depression-like changes in adrenal axis regulation and behavior. Proceedings of the National Academy of Sciences of the United States of America. 2005;102:473–478. doi: 10.1073/pnas.0406458102. [DOI] [PMC free article] [PubMed] [Google Scholar]
- 44.Sasaki T., Kim H.J., Kobayashi M., Kitamura Y.I., Yokota-Hashimoto H. Induction of hypothalamic Sirt1 leads to cessation of feeding via agouti-related peptide. Endocrinology. 2010;151:2556–2566. doi: 10.1210/en.2009-1319. [DOI] [PubMed] [Google Scholar]
- 45.Ikenoue T., Inoki K., Yang Q., Zhou X., Guan K.L. Essential function of TORC2 in PKC and Akt turn motif phosphorylation, maturation and signalling. EMBO Journal. 2008;27:1919–1931. doi: 10.1038/emboj.2008.119. [DOI] [PMC free article] [PubMed] [Google Scholar]
- 46.Kitamura T., Feng Y., Kitamura Y.I., Chua S.C., Jr., Xu A.W. Forkhead protein FoxO1 mediates Agrp-dependent effects of leptin on food intake. Nature Medicine. 2006;12:534–540. doi: 10.1038/nm1392. [DOI] [PubMed] [Google Scholar]
- 47.Cao Y., Nakata M., Okamoto S., Takano E., Yada T. PDK1-Foxo1 in agouti-related peptide neurons regulates energy homeostasis by modulating food intake and energy expenditure. PLoS One. 2011;6:e18324. doi: 10.1371/journal.pone.0018324. [DOI] [PMC free article] [PubMed] [Google Scholar]
- 48.Morrison C.D., Morton G.J., Niswender K.D., Gelling R.W., Schwartz M.W. Leptin inhibits hypothalamic Npy and Agrp gene expression via a mechanism that requires phosphatidylinositol 3-OH-kinase signaling. American Journal of Physiology – Endocrinology and Metabolism. 2005;289:E1051–E1057. doi: 10.1152/ajpendo.00094.2005. [DOI] [PubMed] [Google Scholar]
- 49.Rojas J.M., Stafford J.M., Saadat S., Printz R.L., Beck-Sickinger A.G. Central nervous system neuropeptide Y signaling via the Y1 receptor partially dissociates feeding behavior from lipoprotein metabolism in lean rats. American Journal of Physiology – Endocrinology and Metabolism. 2012;303:E1479–E1488. doi: 10.1152/ajpendo.00351.2012. [DOI] [PMC free article] [PubMed] [Google Scholar]
- 50.Stafford J.M., Yu F., Printz R., Hasty A.H., Swift L.L. Central nervous system neuropeptide Y signaling modulates VLDL triglyceride secretion. Diabetes. 2008;57:1482–1490. doi: 10.2337/db07-1702. [DOI] [PMC free article] [PubMed] [Google Scholar]
- 51.Berthoud H.R. Homeostatic and non-homeostatic pathways involved in the control of food intake and energy balance. Obesity (Silver Spring) 2006;14(Suppl. 5):S197–S200. doi: 10.1038/oby.2006.308. [DOI] [PubMed] [Google Scholar]
- 52.Porte D., Jr., Baskin D.G., Schwartz M.W. Leptin and insulin action in the central nervous system. Nutrition Reviews. 2002;60:S20–S29. doi: 10.1301/002966402320634797. (discussion S68–S84, S85–S27) [DOI] [PubMed] [Google Scholar]
- 53.Vaisse C., Halaas J.L., Horvath C.M., Darnell J.E., Jr., Stoffel M. Leptin activation of Stat3 in the hypothalamus of wild-type and ob/ob mice but not db/db mice. Nature Genetics. 1996;14:95–97. doi: 10.1038/ng0996-95. [DOI] [PubMed] [Google Scholar]
- 54.Bates S.H., Stearns W.H., Dundon T.A., Schubert M., Tso A.W. STAT3 signalling is required for leptin regulation of energy balance but not reproduction. Nature. 2003;421:856–859. doi: 10.1038/nature01388. [DOI] [PubMed] [Google Scholar]
- 55.Mirshamsi S., Laidlaw H.A., Ning K., Anderson E., Burgess L.A. Leptin and insulin stimulation of signalling pathways in arcuate nucleus neurones: PI3K dependent actin reorganization and KATP channel activation. BMC Neuroscience. 2004;5:54. doi: 10.1186/1471-2202-5-54. [DOI] [PMC free article] [PubMed] [Google Scholar]
- 56.Sarbassov D.D., Guertin D.A., Ali S.M., Sabatini D.M. Phosphorylation and regulation of Akt/PKB by the rictor-mTOR complex. Science. 2005;307:1098–1101. doi: 10.1126/science.1106148. [DOI] [PubMed] [Google Scholar]
- 57.Jacinto E., Facchinetti V., Liu D., Soto N., Wei S. SIN1/MIP1 maintains rictor-mTOR complex integrity and regulates Akt phosphorylation and substrate specificity. Cell. 2006;127:125–137. doi: 10.1016/j.cell.2006.08.033. [DOI] [PubMed] [Google Scholar]
- 58.Garcia-Martinez J.M., Alessi D.R. mTOR complex 2 (mTORC2) controls hydrophobic motif phosphorylation and activation of serum- and glucocorticoid-induced protein kinase 1 (SGK1) Biochemical Journal. 2008;416:375–385. doi: 10.1042/BJ20081668. [DOI] [PubMed] [Google Scholar]
- 59.Yan L., Mieulet V., Lamb R.F. mTORC2 is the hydrophobic motif kinase for SGK1. Biochemical Journal. 2008;416:e19–e21. doi: 10.1042/BJ20082202. [DOI] [PubMed] [Google Scholar]
- 60.Urbanska M., Gozdz A., Swiech L.J., Jaworski J. Mammalian target of rapamycin complex 1 (mTORC1) and 2 (mTORC2) control the dendritic arbor morphology of hippocampal neurons. Journal of Biological Chemistry. 2012;287:30240–30256. doi: 10.1074/jbc.M112.374405. [DOI] [PMC free article] [PubMed] [Google Scholar]
- 61.Thomanetz V., Angliker N., Cloetta D., Lustenberger R.M., Schweighauser M. Ablation of the mTORC2 component rictor in brain or Purkinje cells affects size and neuron morphology. Journal of Cell Biology. 2013;201:293–308. doi: 10.1083/jcb.201205030. [DOI] [PMC free article] [PubMed] [Google Scholar]
- 62.Huang W., Zhu P.J., Zhang S., Zhou H., Stoica L. mTORC2 controls actin polymerization required for consolidation of long-term memory. Nature Neuroscience. 2013 doi: 10.1038/nn.3351. [DOI] [PMC free article] [PubMed] [Google Scholar]
- 63.Bartness T.J., Shrestha Y.B., Vaughan C.H., Schwartz G.J., Song C.K. Sensory and sympathetic nervous system control of white adipose tissue lipolysis. Molecular and Cellular Endocrinology. 2010;318:34–43. doi: 10.1016/j.mce.2009.08.031. [DOI] [PMC free article] [PubMed] [Google Scholar]
- 64.Pocai A., Lam T.K., Gutierrez-Juarez R., Obici S., Schwartz G.J. Hypothalamic K(ATP) channels control hepatic glucose production. Nature. 2005;434:1026–1031. doi: 10.1038/nature03439. [DOI] [PubMed] [Google Scholar]
- 65.Paranjape S.A., Chan O., Zhu W., Horblitt A.M., Grillo C.A. Chronic reduction of insulin receptors in the ventromedial hypothalamus produces glucose intolerance and islet dysfunction in the absence of weight gain. American Journal of Physiology – Endocrinology and Metabolism. 2011;301:E978–E983. doi: 10.1152/ajpendo.00304.2011. [DOI] [PMC free article] [PubMed] [Google Scholar]
- 66.Obici S., Feng Z., Karkanias G., Baskin D.G., Rossetti L. Decreasing hypothalamic insulin receptors causes hyperphagia and insulin resistance in rats. Nature Neuroscience. 2002;5:566–572. doi: 10.1038/nn0602-861. [DOI] [PubMed] [Google Scholar]
- 67.Tiesjema B., la Fleur S.E., Luijendijk M.C., Adan R.A. Sustained NPY overexpression in the PVN results in obesity via temporarily increasing food intake. Obesity. 2009;17:1448–1450. doi: 10.1038/oby.2008.670. [DOI] [PubMed] [Google Scholar]
- 68.Luo N., Marcelin G., Liu S.M., Schwartz G., Chua S., Jr. Neuropeptide Y and agouti-related peptide mediate complementary functions of hyperphagia and reduced energy expenditure in leptin receptor deficiency. Endocrinology. 2011;152:883–889. doi: 10.1210/en.2010-1135. [DOI] [PMC free article] [PubMed] [Google Scholar]
- 69.Sousa-Ferreira L., Garrido M., Nascimento-Ferreira I., Nobrega C., Santos-Carvalho A. Moderate long-term modulation of neuropeptide Y in hypothalamic arcuate nucleus induces energy balance alterations in adult rats. PLoS One. 2011;6:22. doi: 10.1371/journal.pone.0022333. [DOI] [PMC free article] [PubMed] [Google Scholar]
- 70.van den Hoek A.M., Voshol P.J., Karnekamp B.N., Buijs R.M., Romijn J.A. Intracerebroventricular neuropeptide Y infusion precludes inhibition of glucose and VLDL production by insulin. Diabetes. 2004;53:2529–2534. doi: 10.2337/diabetes.53.10.2529. [DOI] [PubMed] [Google Scholar]
- 71.Diamant S., Shafrir E. Modulation of the activity of insulin-dependent enzymes of lipogenesis by glucocorticoids. European Journal of Biochemistry. 1975;53:541–546. doi: 10.1111/j.1432-1033.1975.tb04097.x. [DOI] [PubMed] [Google Scholar]
- 72.Winnick J.J., Ramnanan C.J., Saraswathi V., Roop J., Scott M. Effects of 11beta-hydroxysteroid dehydrogenase-1 inhibition on hepatic glycogenolysis and gluconeogenesis. American Journal of Physiology – Endocrinology and Metabolism. 2013;304:12. doi: 10.1152/ajpendo.00639.2012. [DOI] [PMC free article] [PubMed] [Google Scholar]
- 73.Rafacho A., Marroqui L., Taboga S.R., Abrantes J.L., Silveira L.R. Glucocorticoids in vivo induce both insulin hypersecretion and enhanced glucose sensitivity of stimulus-secretion coupling in isolated rat islets. Endocrinology. 2010;151:85–95. doi: 10.1210/en.2009-0704. [DOI] [PubMed] [Google Scholar]
- 74.Morgan S.A., Gathercole L.L., Simonet C., Hassan-Smith Z.K., Bujalska I. Regulation of lipid metabolism by glucocorticoids and 11beta-HSD1 in skeletal muscle. Endocrinology. 2013;154:2374–2384. doi: 10.1210/en.2012-2214. [DOI] [PubMed] [Google Scholar]
- 75.Strack A.M., Bradbury M.J., Dallman M.F. Corticosterone decreases nonshivering thermogenesis and increases lipid storage in brown adipose tissue. American Journal of Physiology. 1995;268:R183–R191. doi: 10.1152/ajpregu.1995.268.1.R183. [DOI] [PubMed] [Google Scholar]
- 76.Schakman O., Kalista S., Barbe C., Loumaye A., Thissen J.P. Glucocorticoid-induced skeletal muscle atrophy. International Journal of Biochemistry & Cell Biology. 2013;24:00181–00187. doi: 10.1016/j.biocel.2013.05.036. [DOI] [PubMed] [Google Scholar]
- 77.Laryea G., Schutz G., Muglia L.J. Disrupting hypothalamic glucocorticoid receptors causes HPA axis hyperactivity and excess adiposity. Molecular Endocrinology. 2013;27:1655–1665. doi: 10.1210/me.2013-1187. [DOI] [PMC free article] [PubMed] [Google Scholar]
- 78.Burt M.G., Gibney J., Ho K.K. Characterization of the metabolic phenotypes of Cushing׳s syndrome and growth hormone deficiency: a study of body composition and energy metabolism. Clinical Endocrinology. 2006;64:436–443. doi: 10.1111/j.1365-2265.2006.02488.x. [DOI] [PubMed] [Google Scholar]
- 79.Konner A.C., Janoschek R., Plum L., Jordan S.D., Rother E. Insulin action in AgRP-expressing neurons is required for suppression of hepatic glucose production. Cell Metabolism. 2007;5:438–449. doi: 10.1016/j.cmet.2007.05.004. [DOI] [PubMed] [Google Scholar]
- 80.Geraghty K.M., Chen S., Harthill J.E., Ibrahim A.F., Toth R. Regulation of multisite phosphorylation and 14-3-3 binding of AS160 in response to IGF-1, EGF, PMA and AICAR. Biochemical Journal. 2007;407:231–241. doi: 10.1042/BJ20070649. [DOI] [PMC free article] [PubMed] [Google Scholar]
- 81.Nobukuni T., Joaquin M., Roccio M., Dann S.G., Kim S.Y. Amino acids mediate mTOR/raptor signaling through activation of class 3 phosphatidylinositol 3OH-kinase. Proceedings of the National Academy of Sciences of the United States of America. 2005;102:14238–14243. doi: 10.1073/pnas.0506925102. [DOI] [PMC free article] [PubMed] [Google Scholar]
- 82.Hill J.W., Williams K.W., Ye C., Luo J., Balthasar N. Acute effects of leptin require PI3K signaling in hypothalamic proopiomelanocortin neurons in mice. Journal of Clinical Investigation. 2008;118:1796–1805. doi: 10.1172/JCI32964. [DOI] [PMC free article] [PubMed] [Google Scholar]
- 83.Iskandar K., Cao Y., Hayashi Y., Nakata M., Takano E. PDK-1/FoxO1 pathway in POMC neurons regulates Pomc expression and food intake. American Journal of Physiology – Endocrinology and Metabolism. 2010;298:E787–E798. doi: 10.1152/ajpendo.00512.2009. [DOI] [PubMed] [Google Scholar]
- 84.Lin H.V., Plum L., Ono H., Gutierrez-Juarez R., Shanabrough M. Divergent regulation of energy expenditure and hepatic glucose production by insulin receptor in agouti-related protein and POMC neurons. Diabetes. 2010;59:337–346. doi: 10.2337/db09-1303. [DOI] [PMC free article] [PubMed] [Google Scholar]
- 85.Krysiak R., Obuchowicz E., Herman Z.S. Interactions between the neuropeptide Y system and the hypothalamic-pituitary-adrenal axis. European Journal of Endocrinology. 1999;140:130–136. doi: 10.1530/eje.0.1400130. [DOI] [PubMed] [Google Scholar]
Associated Data
This section collects any data citations, data availability statements, or supplementary materials included in this article.
Supplementary Materials
Supplementary data